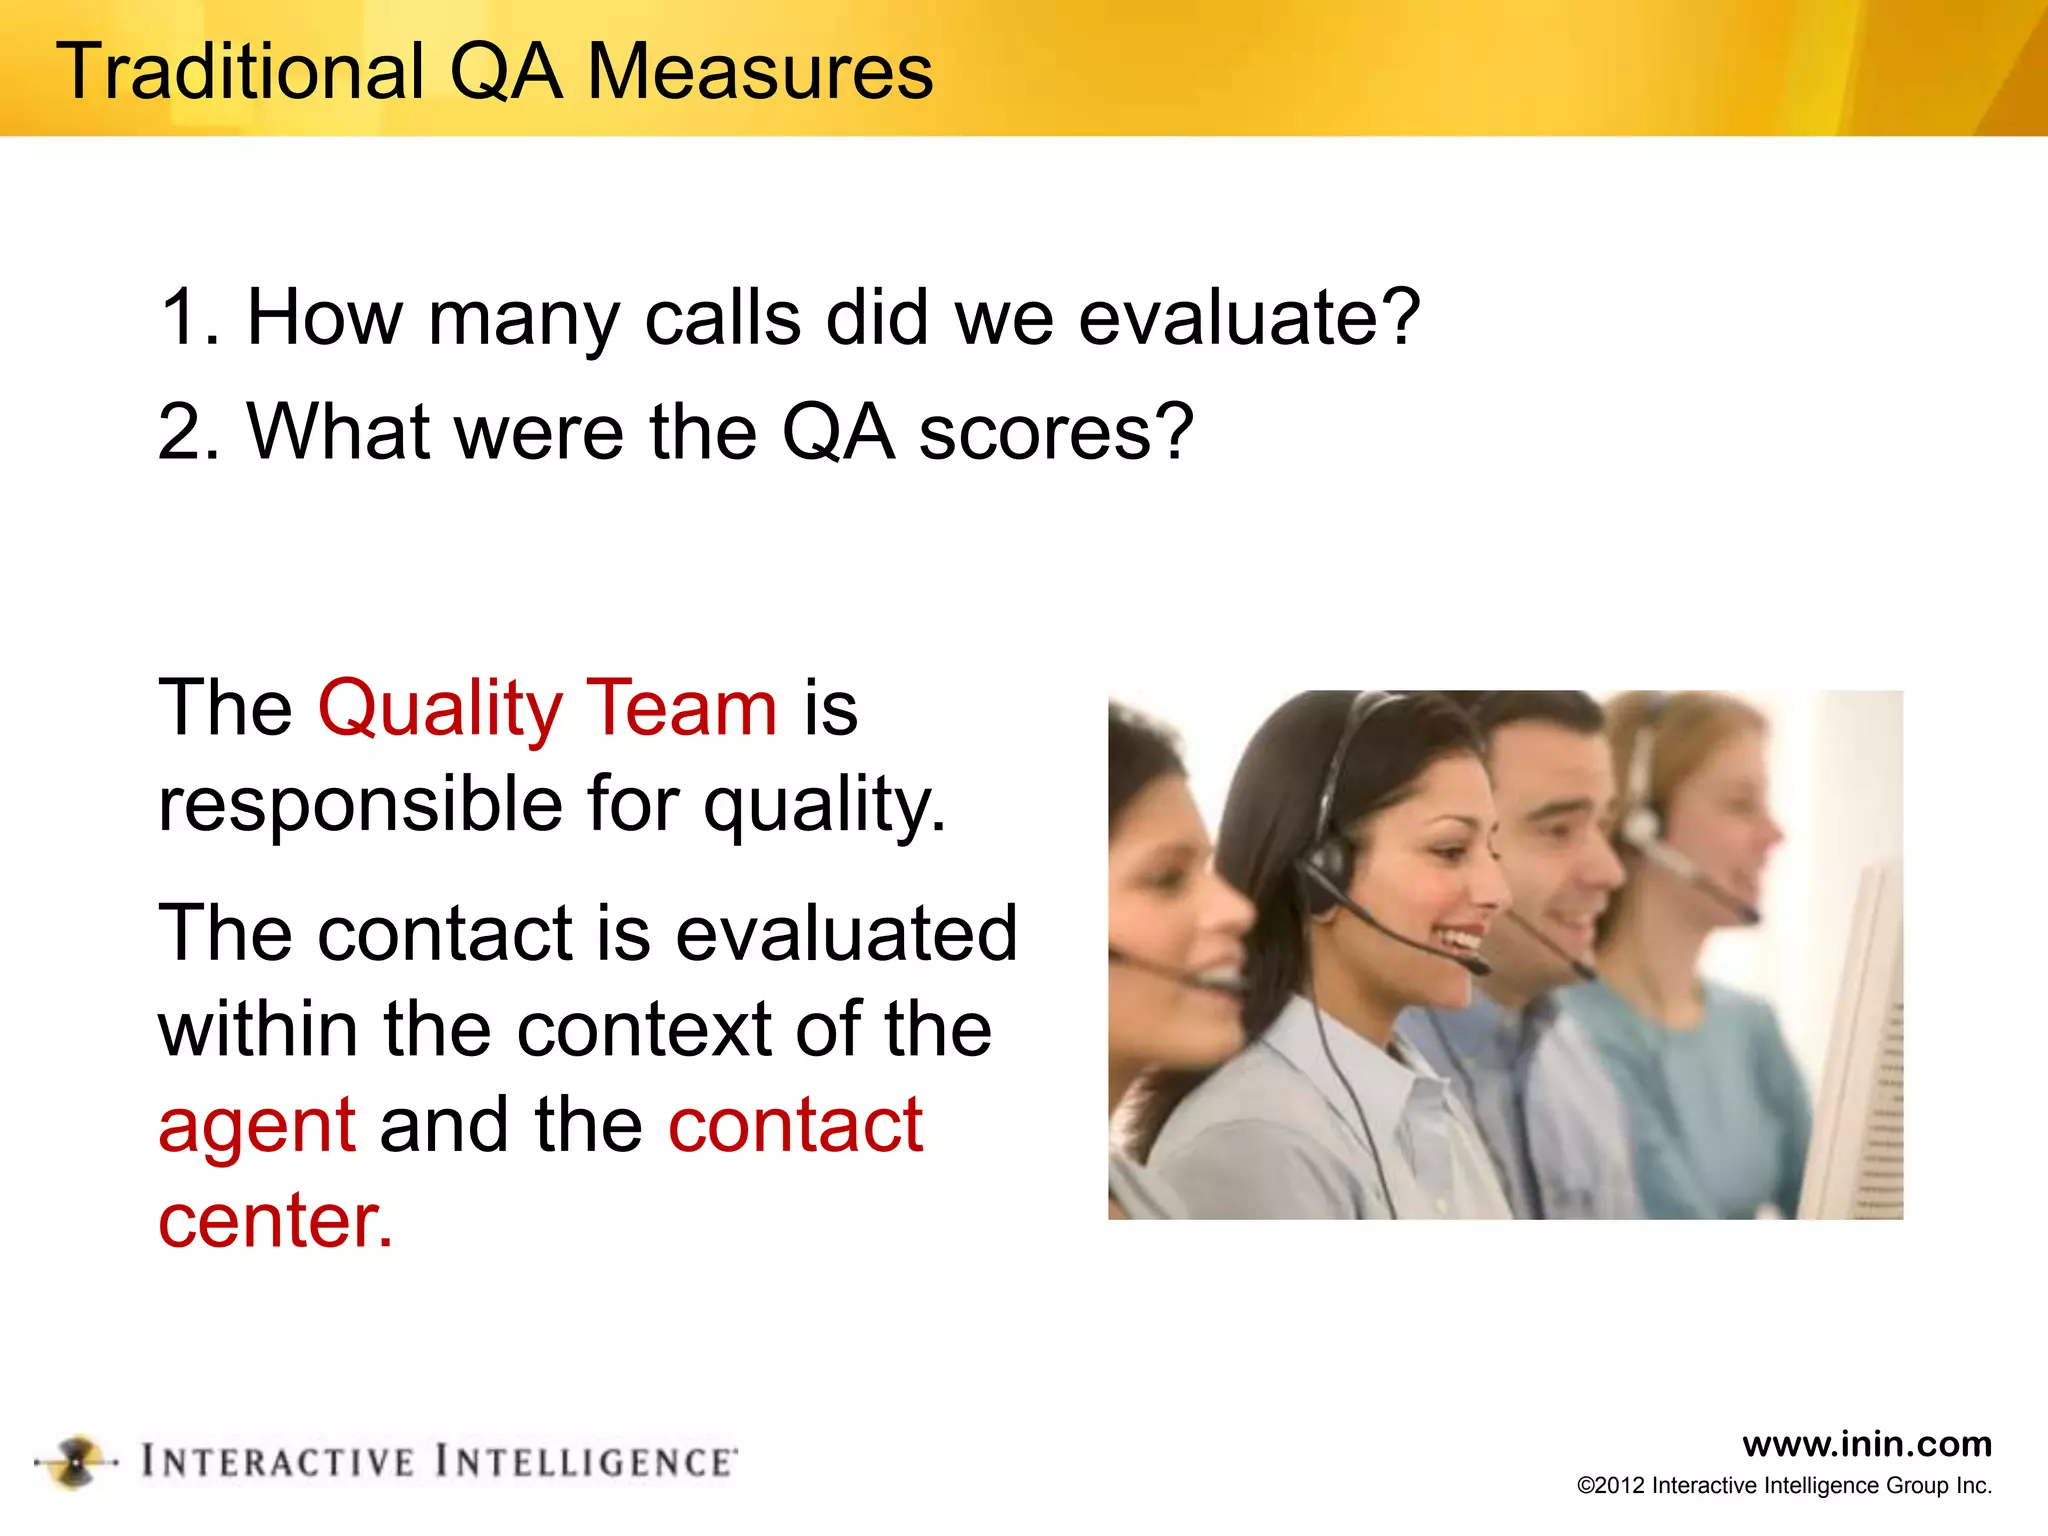
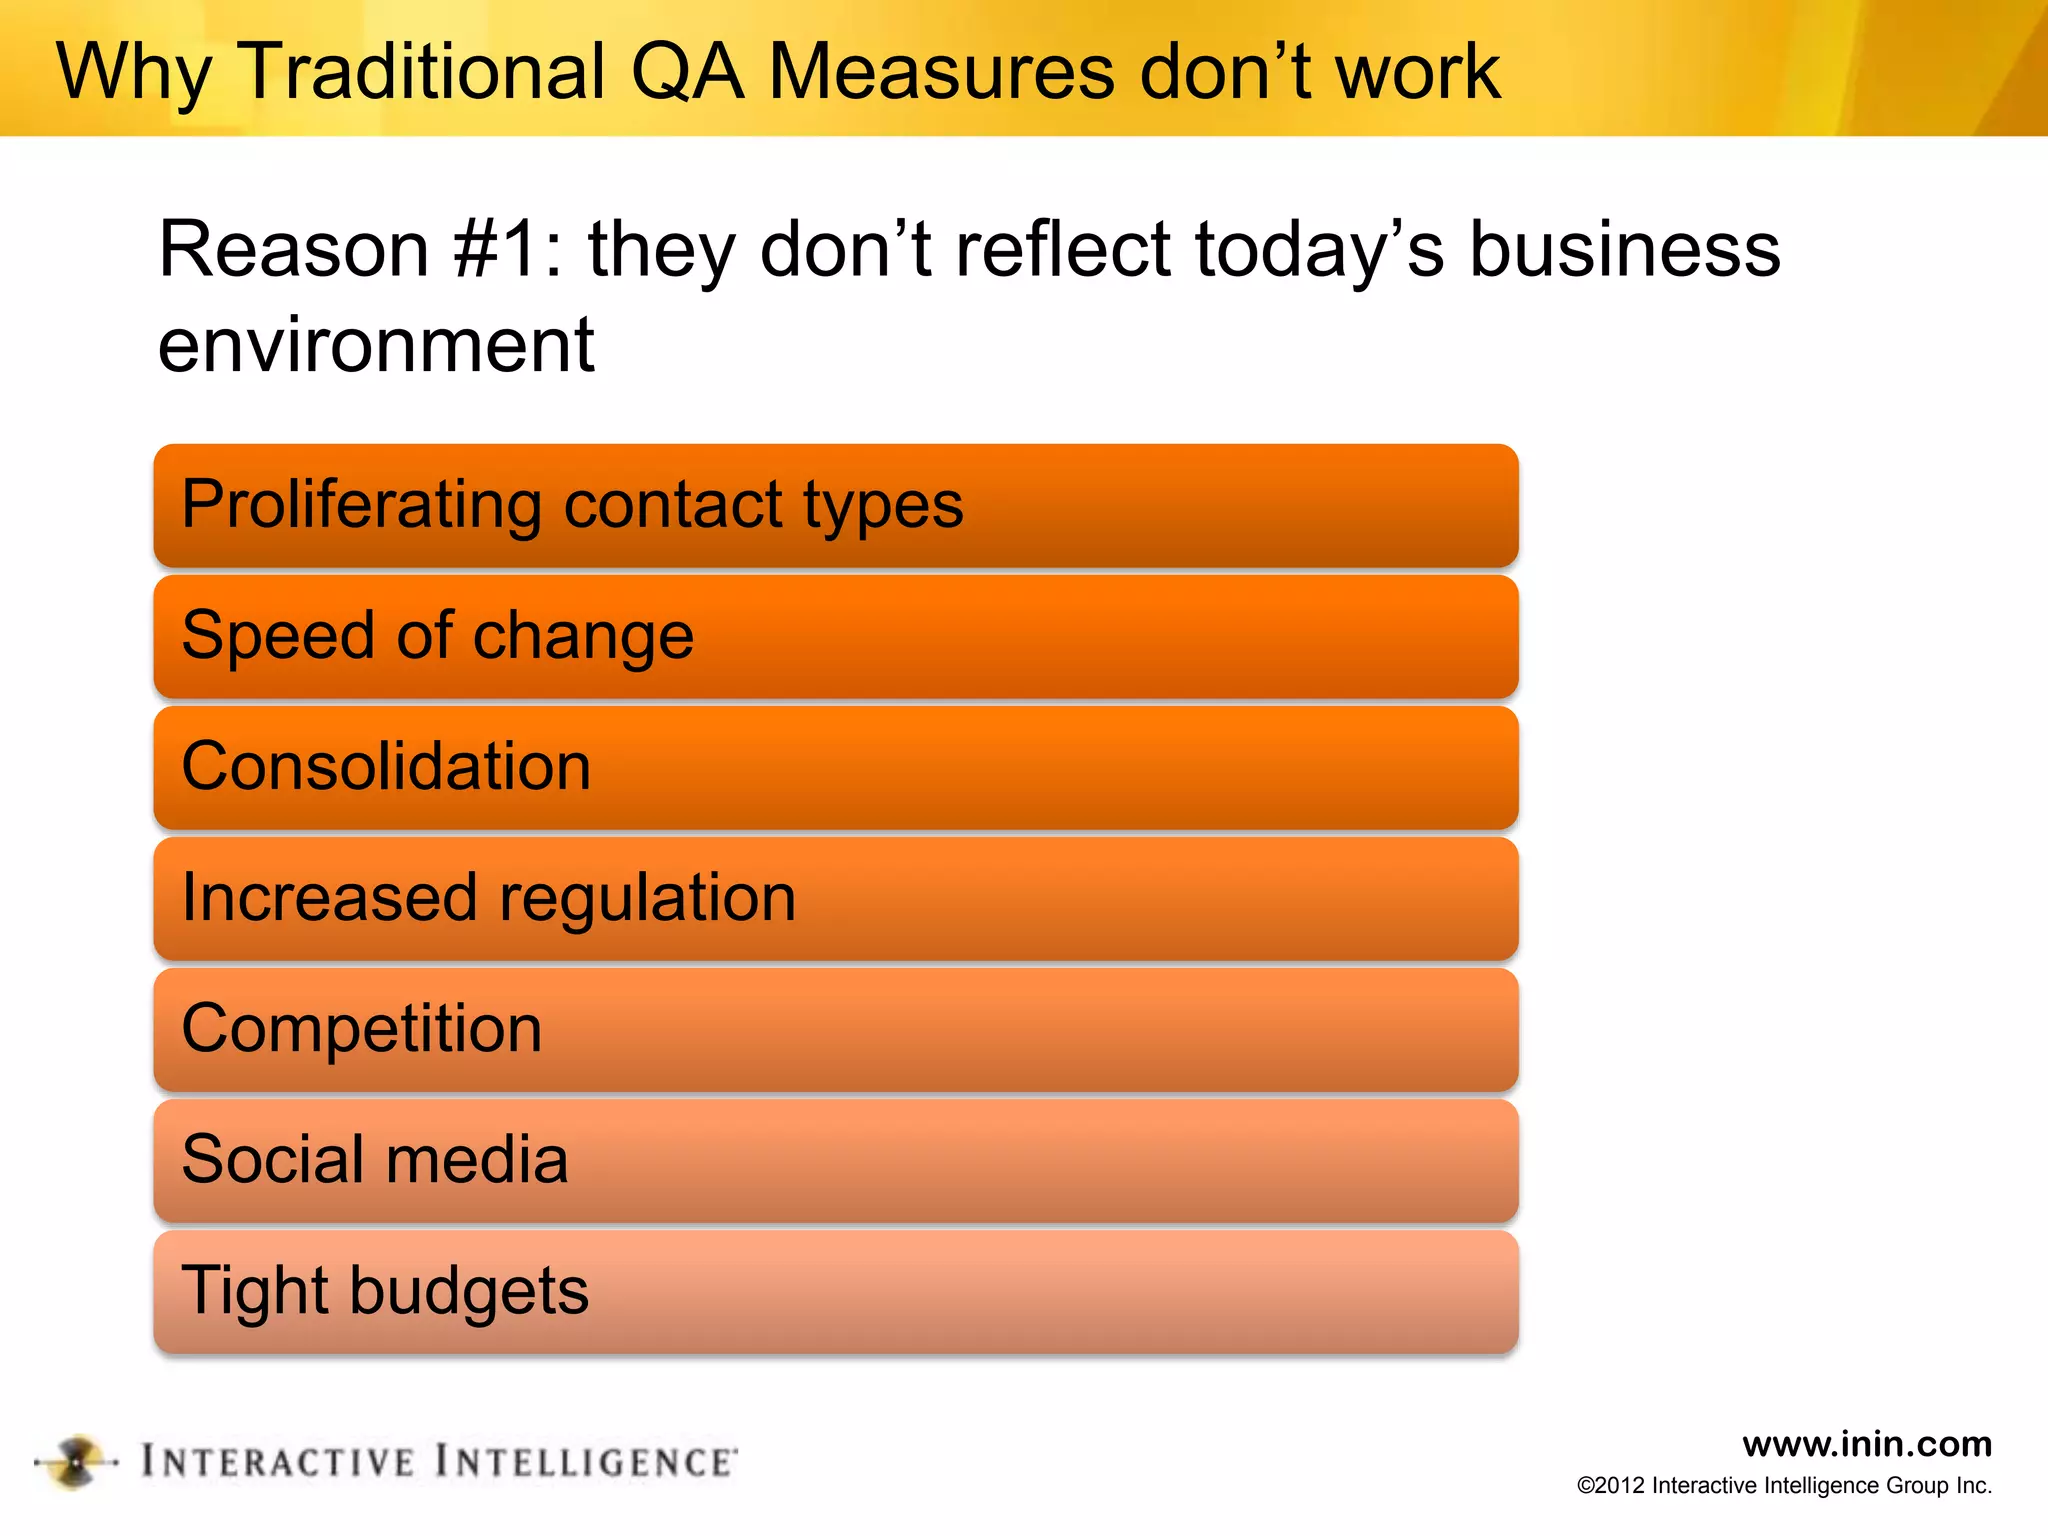
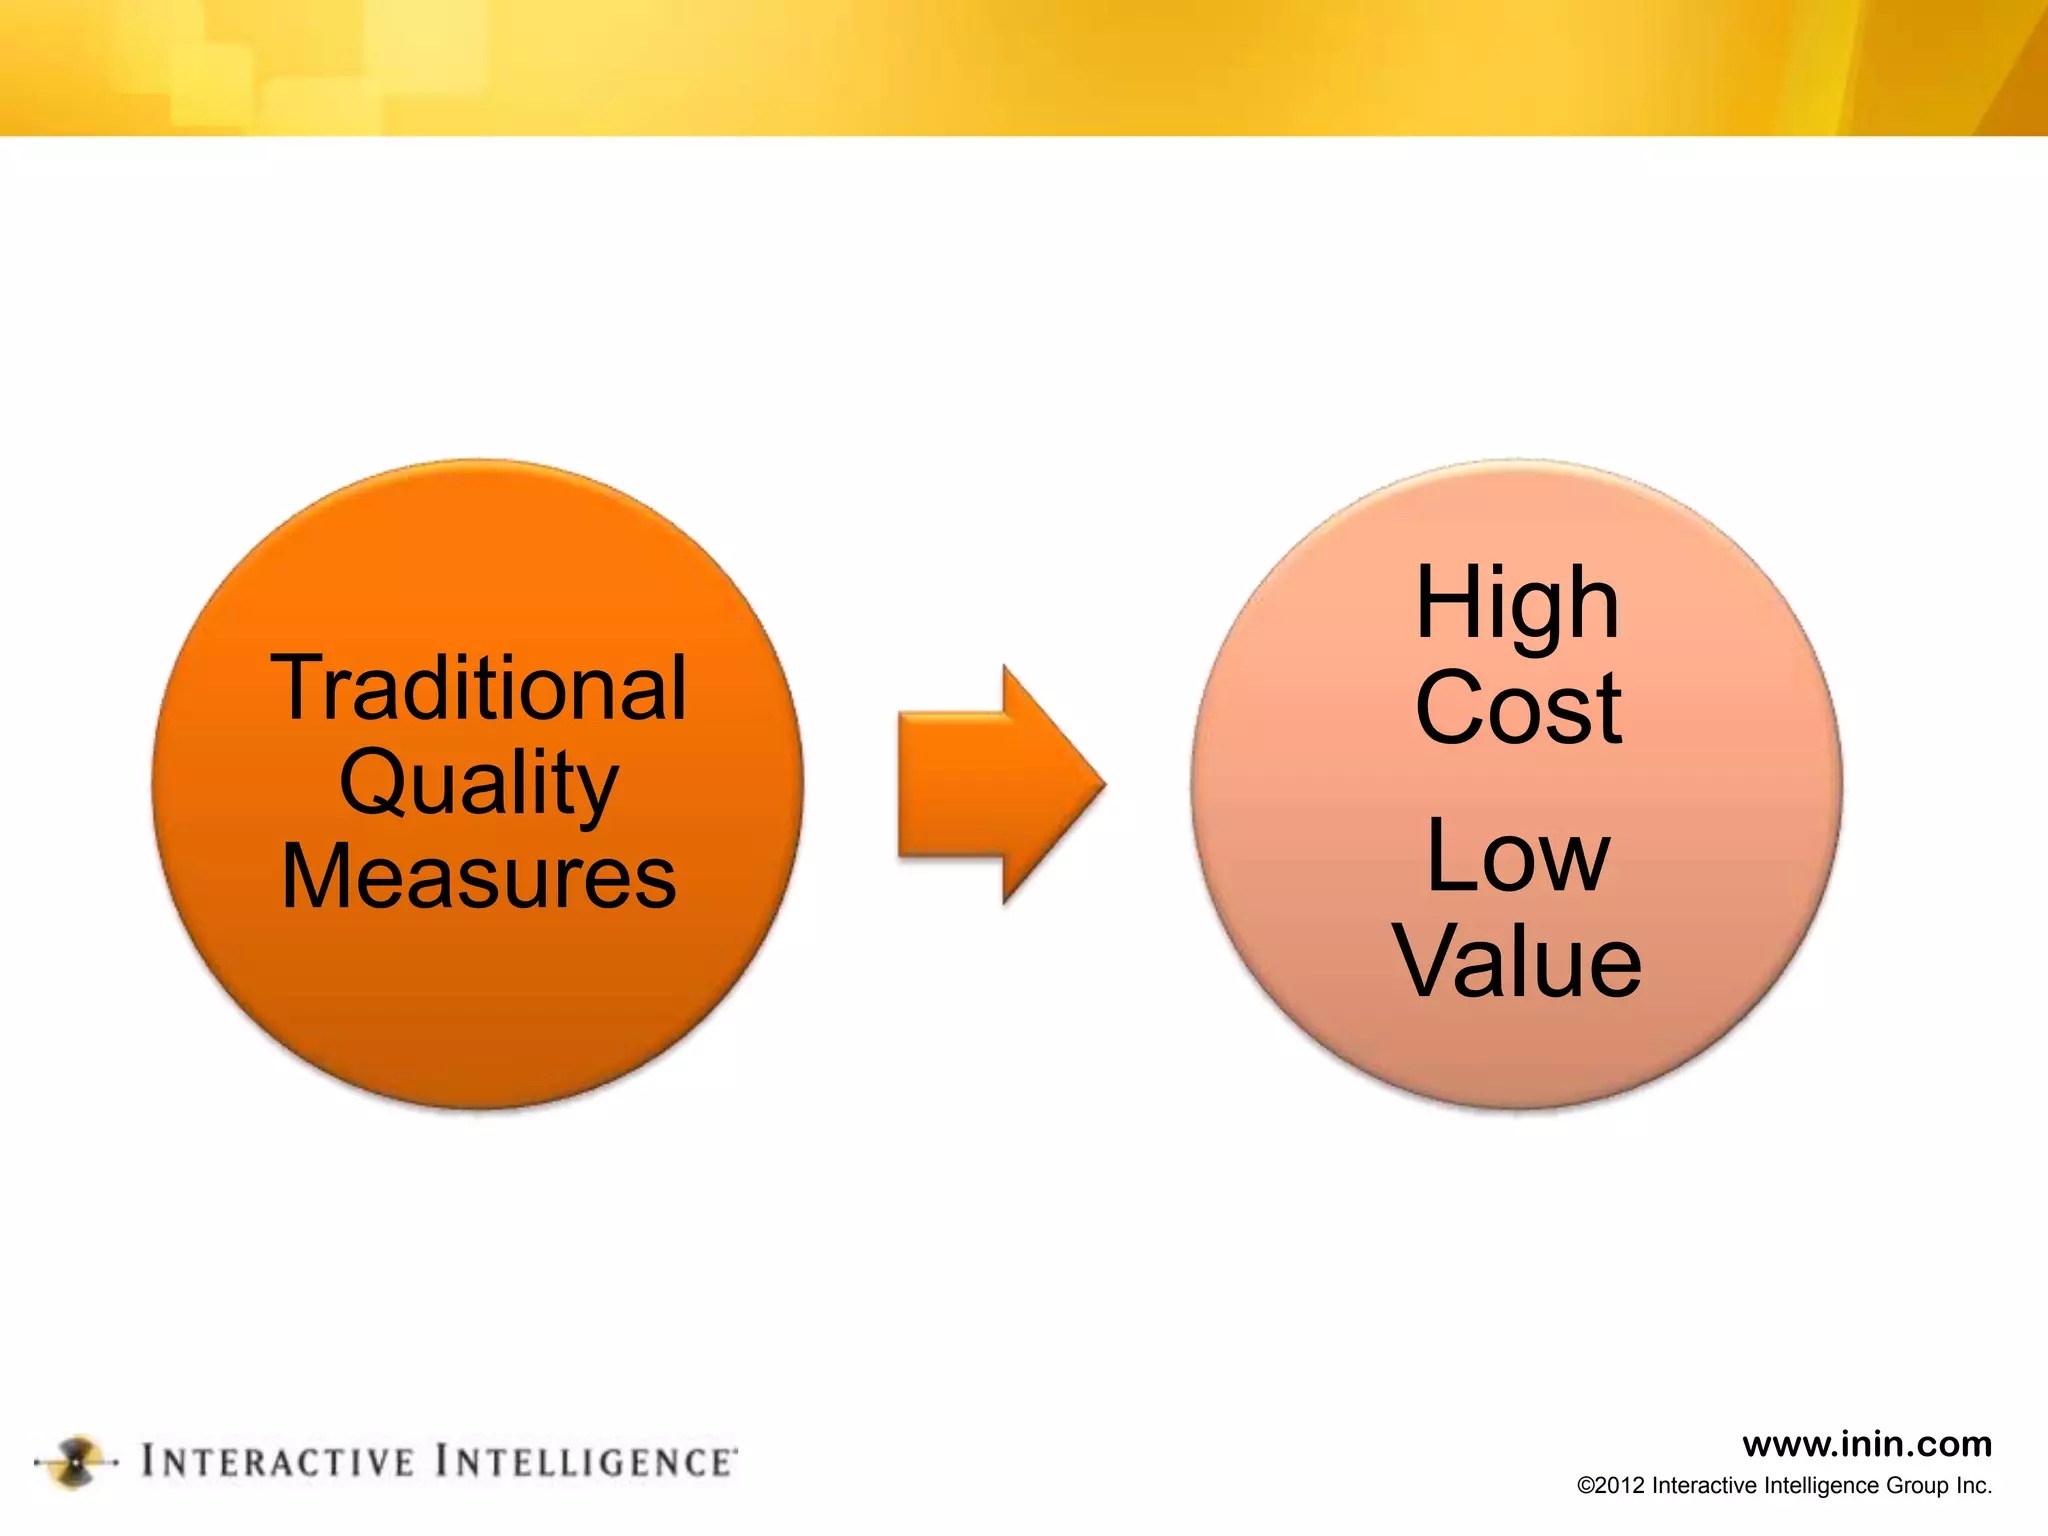
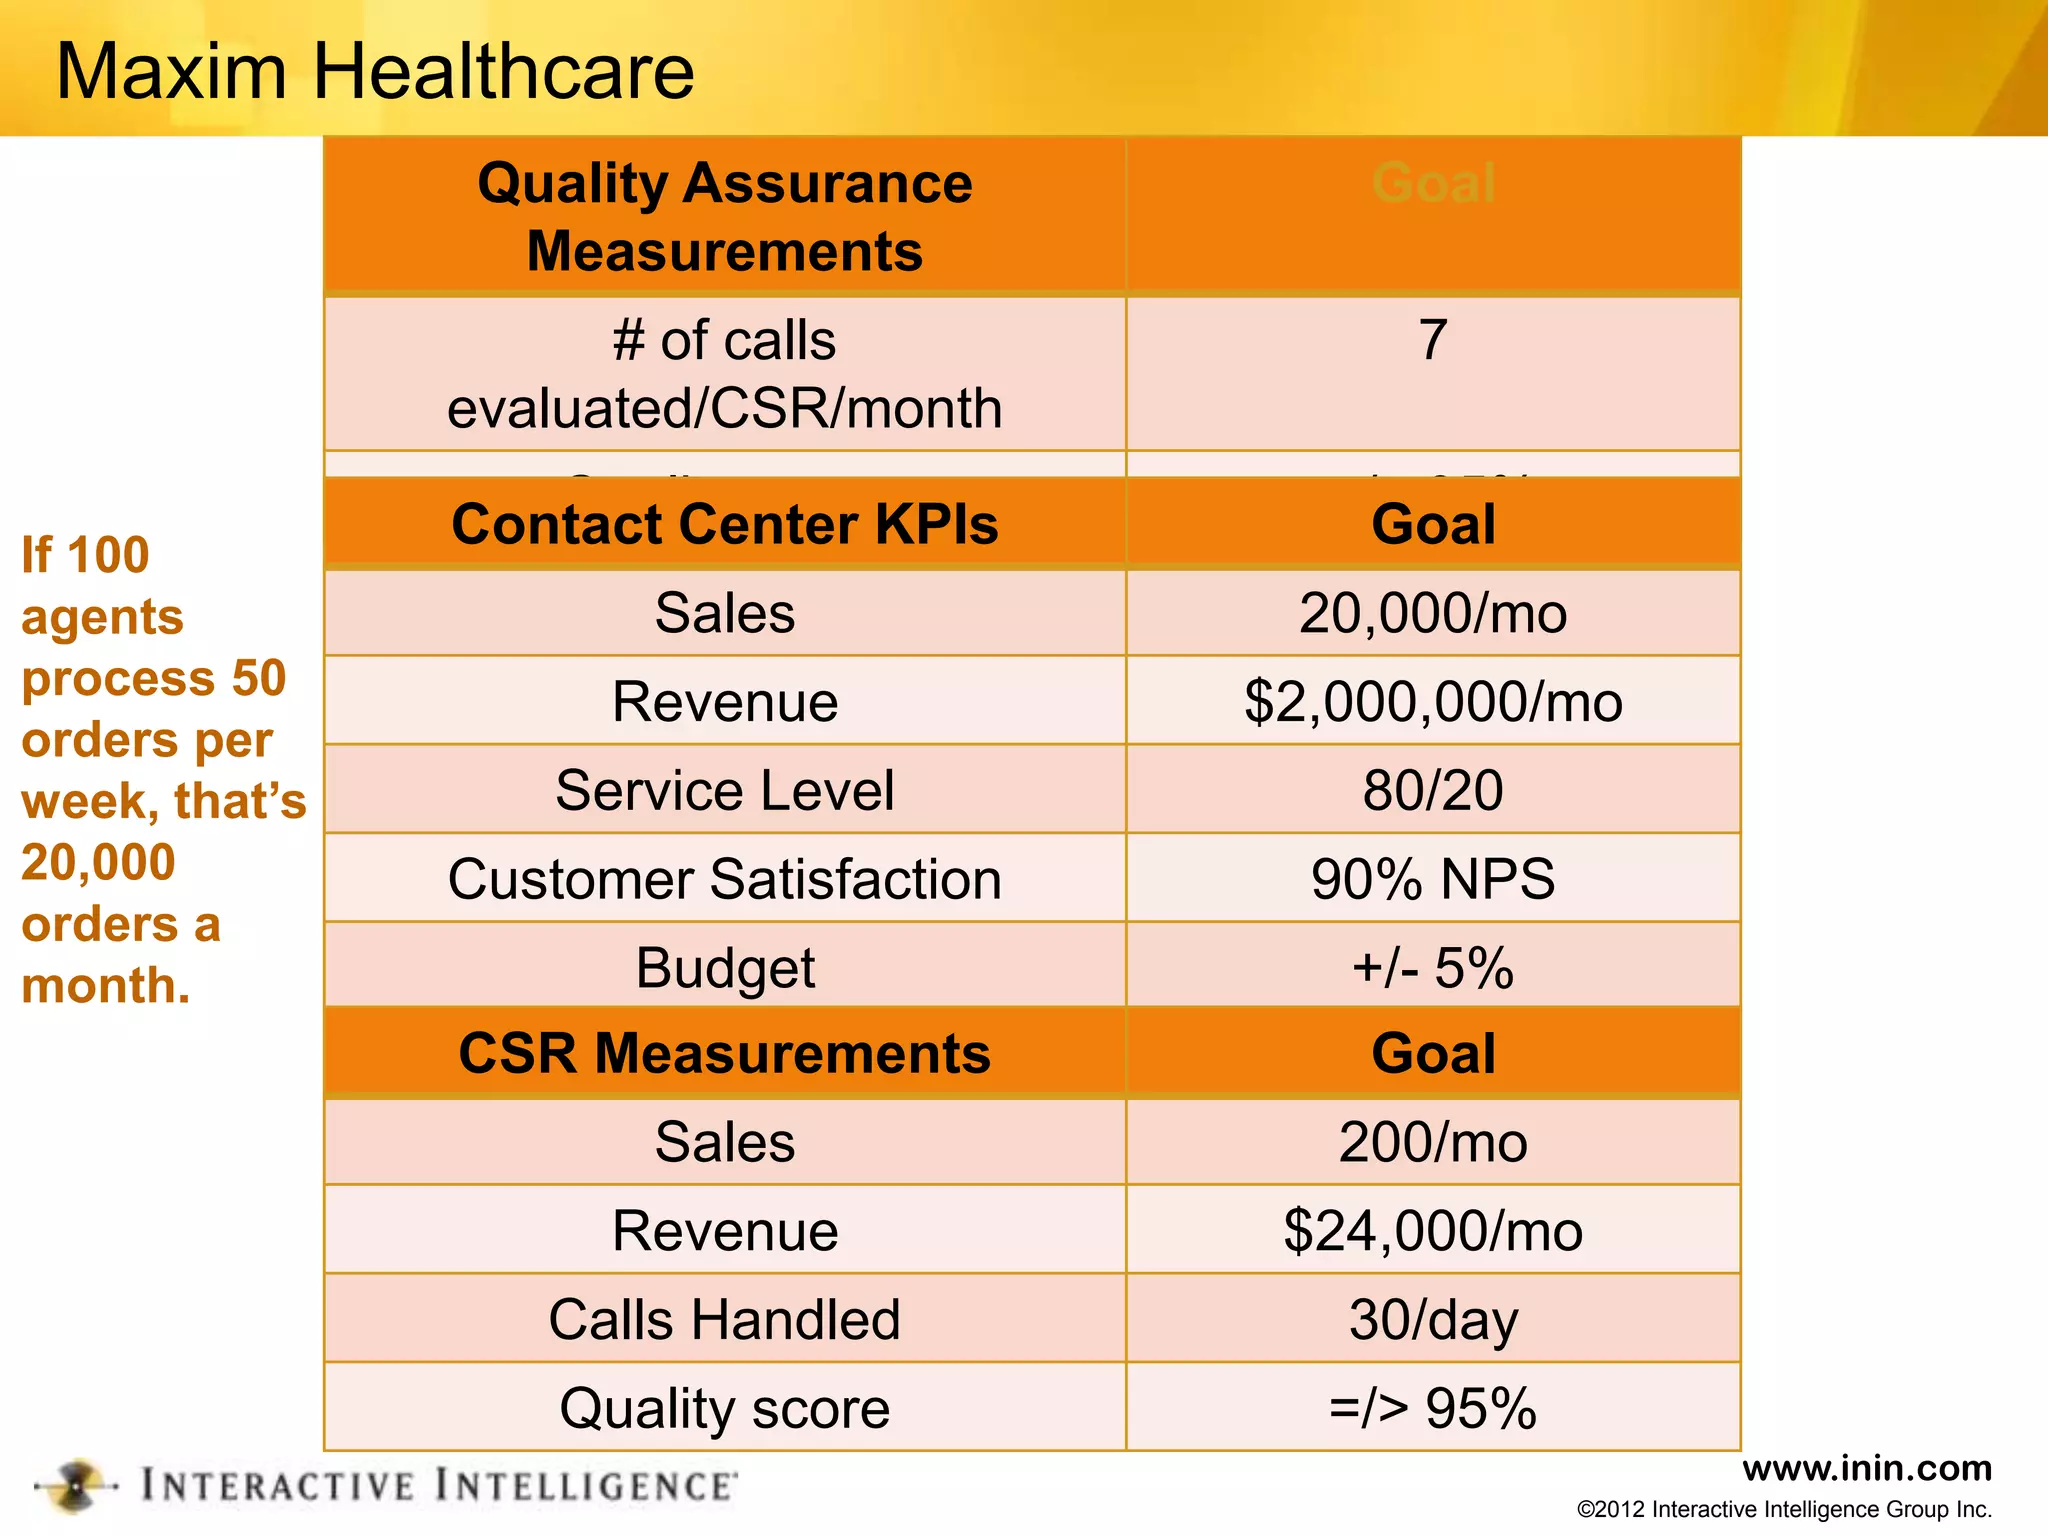
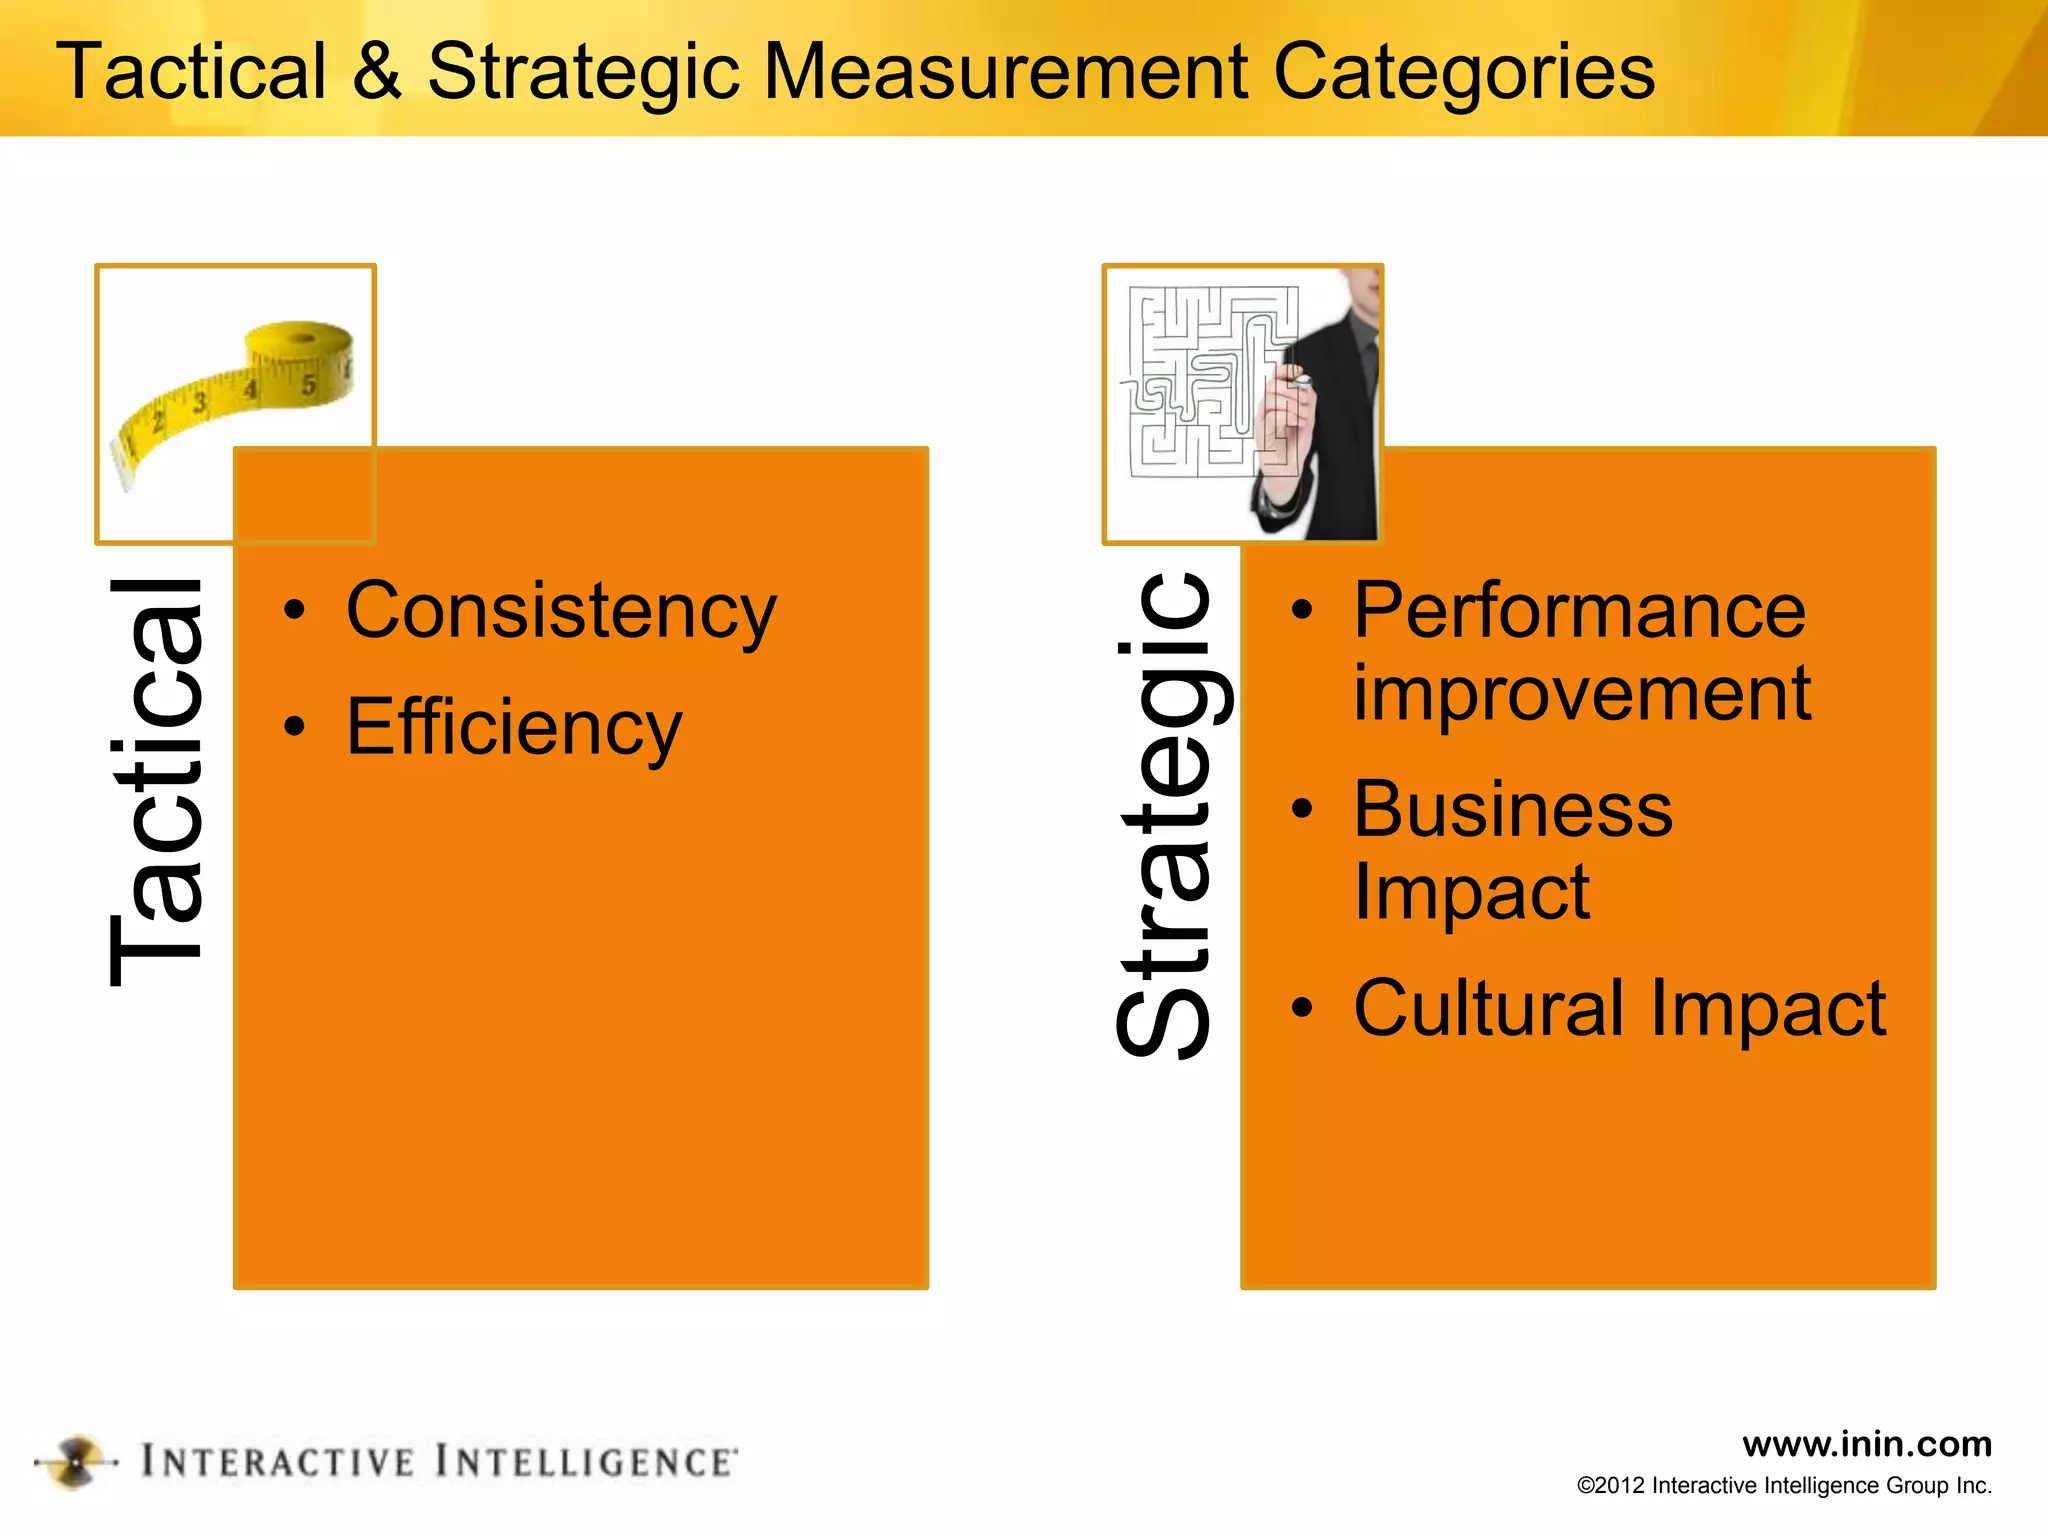
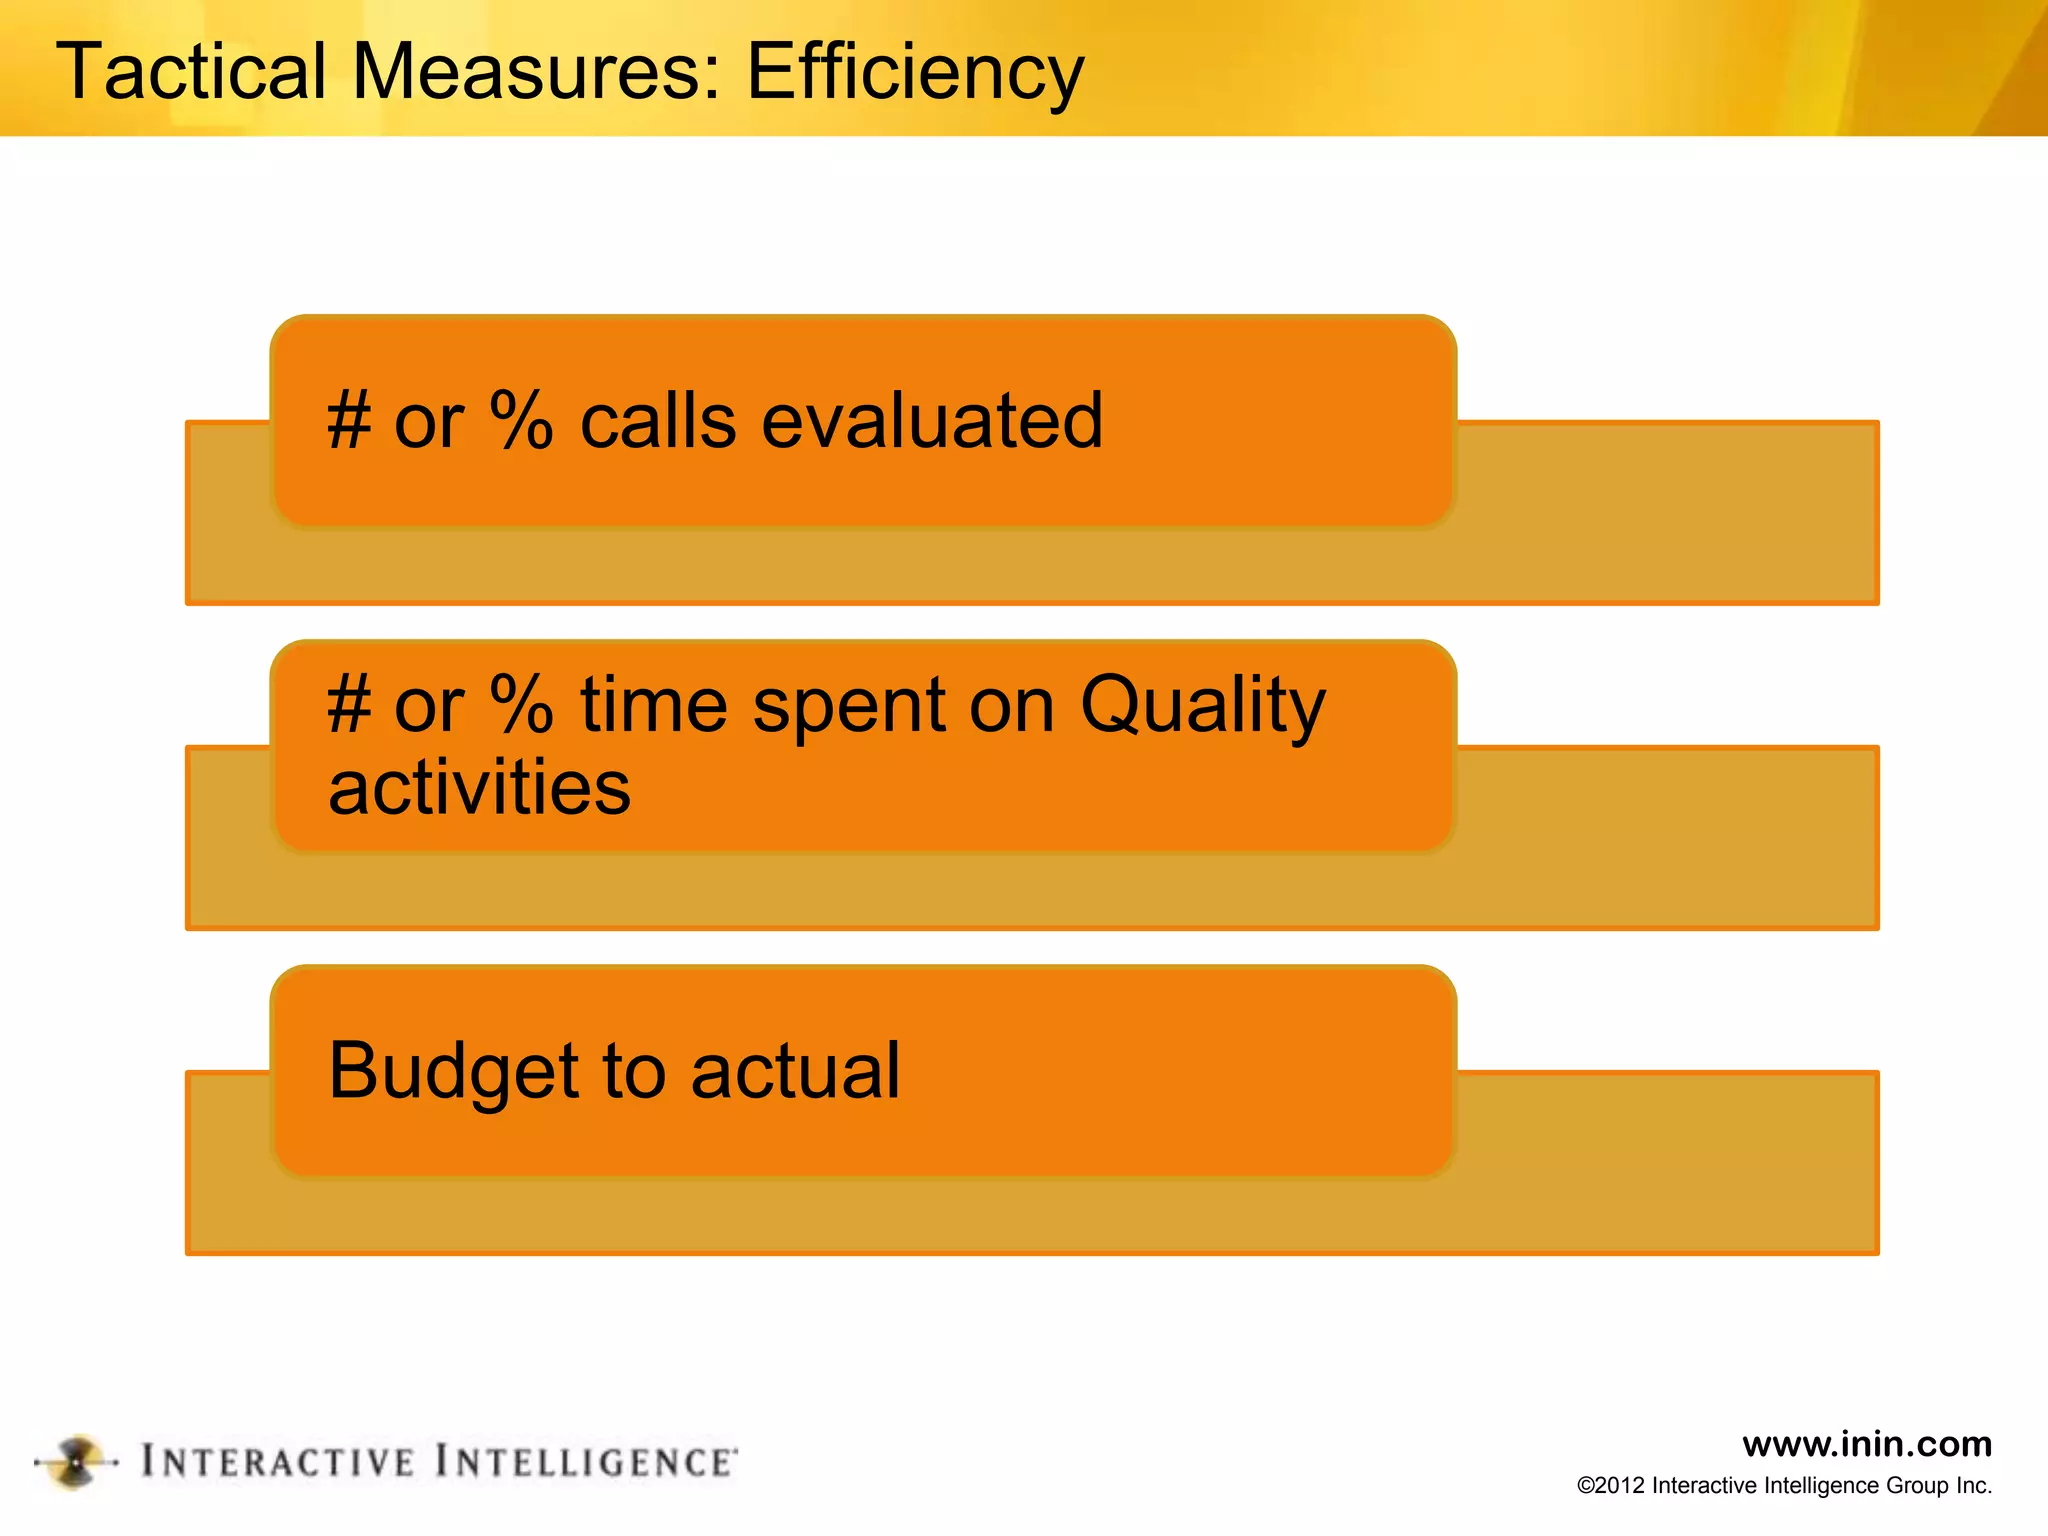
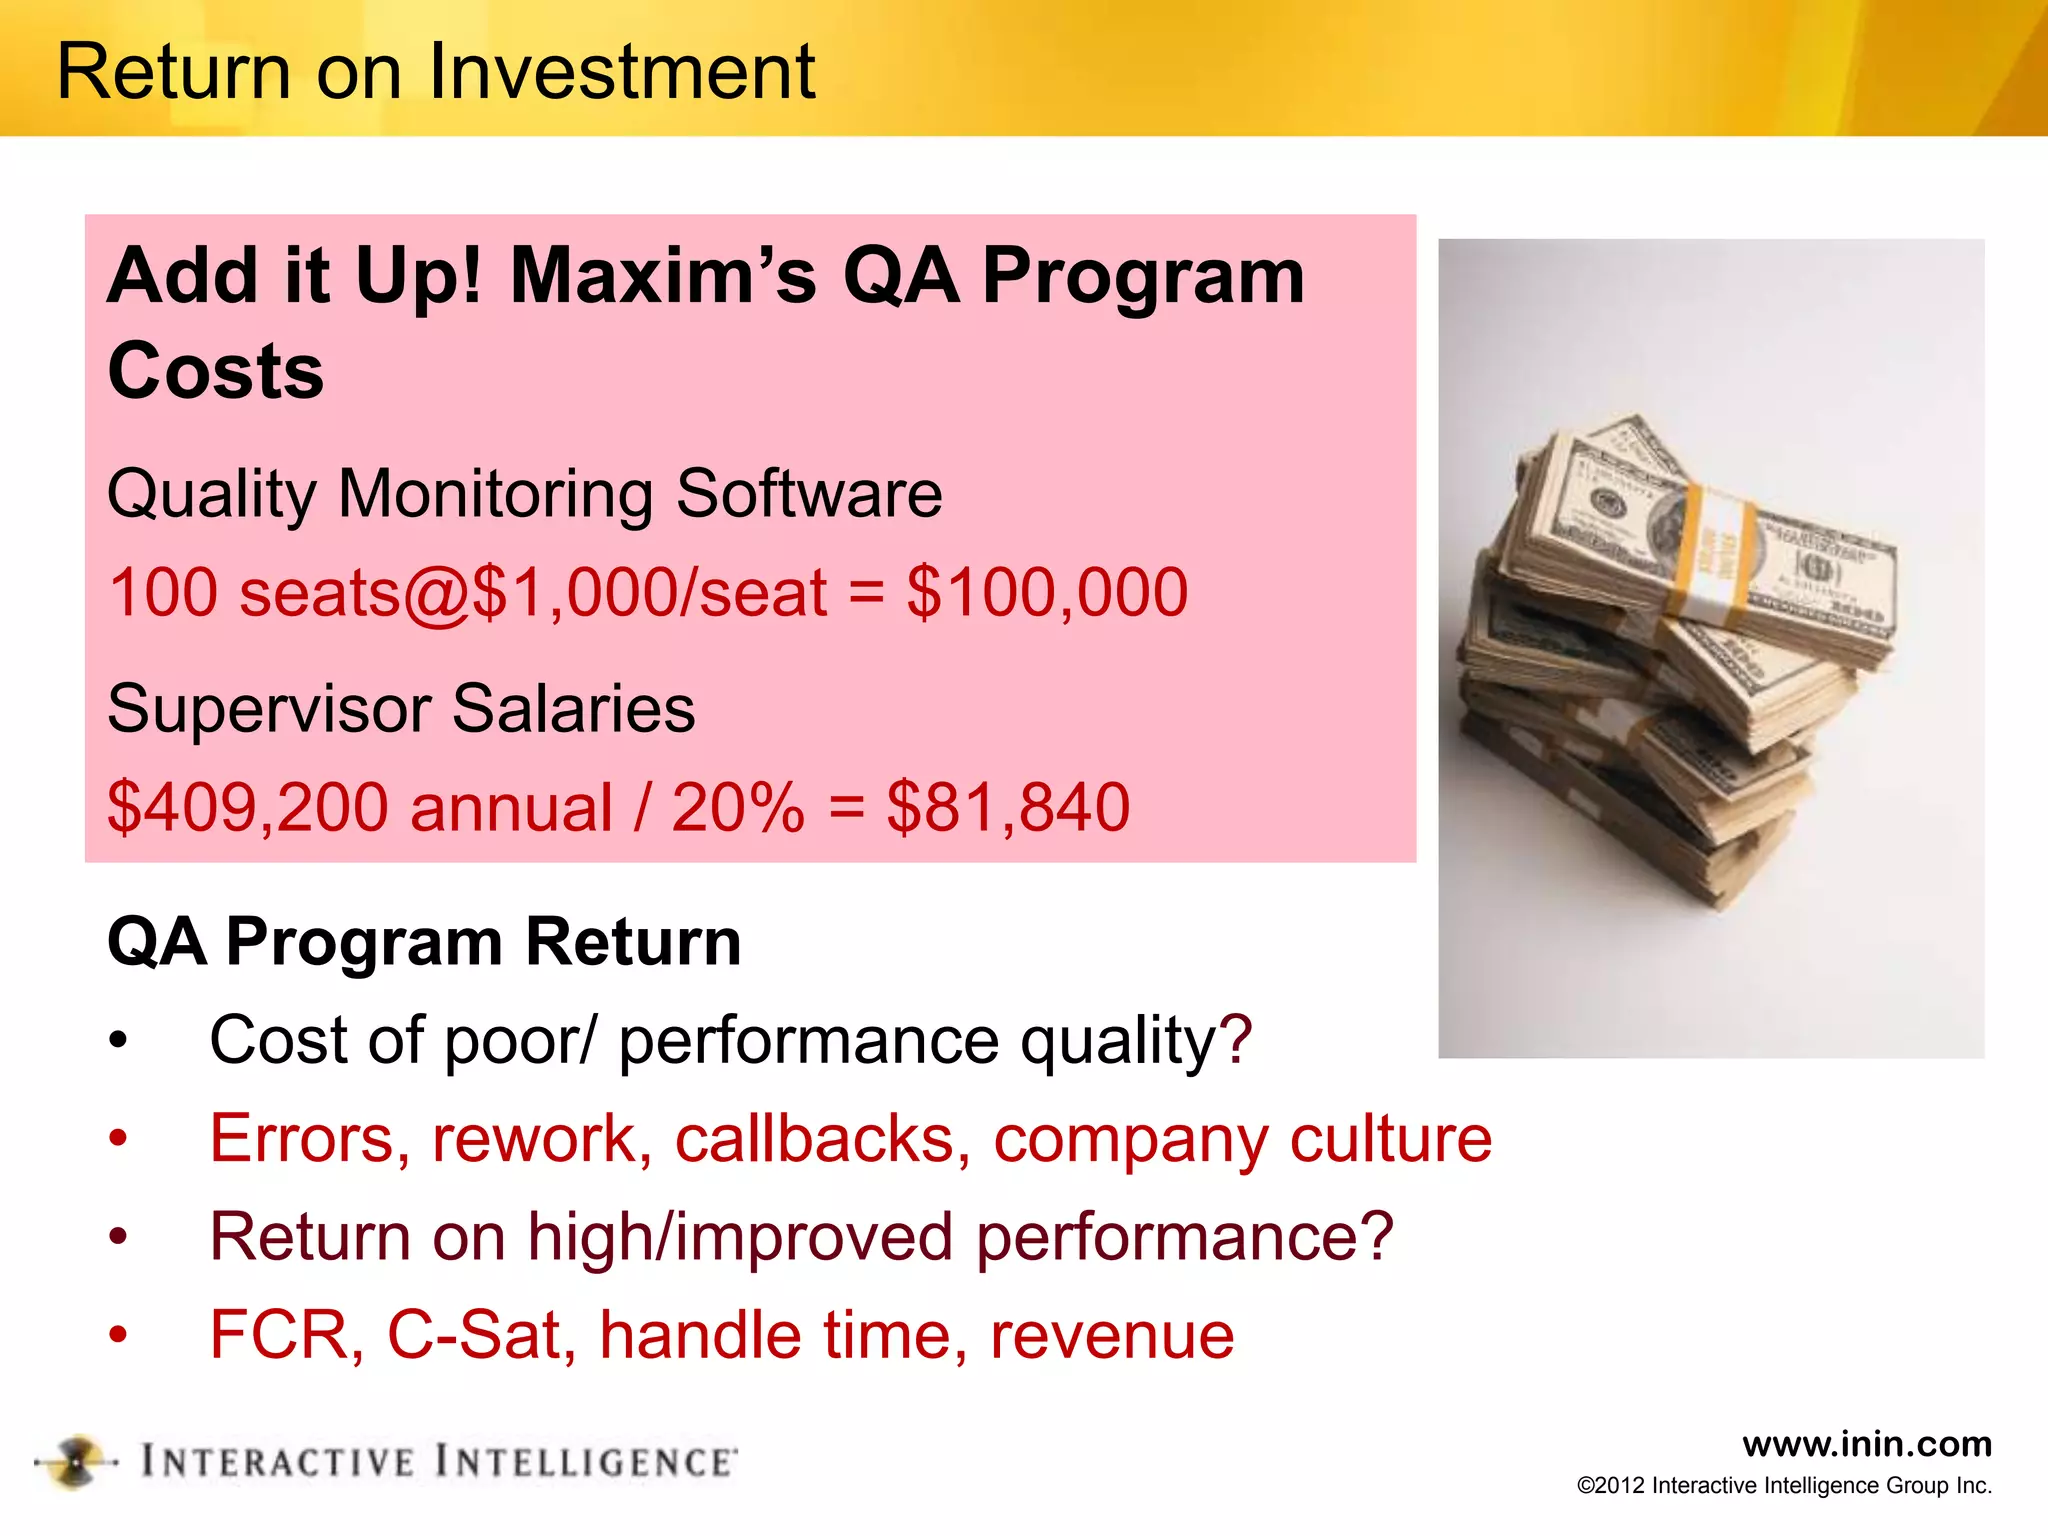
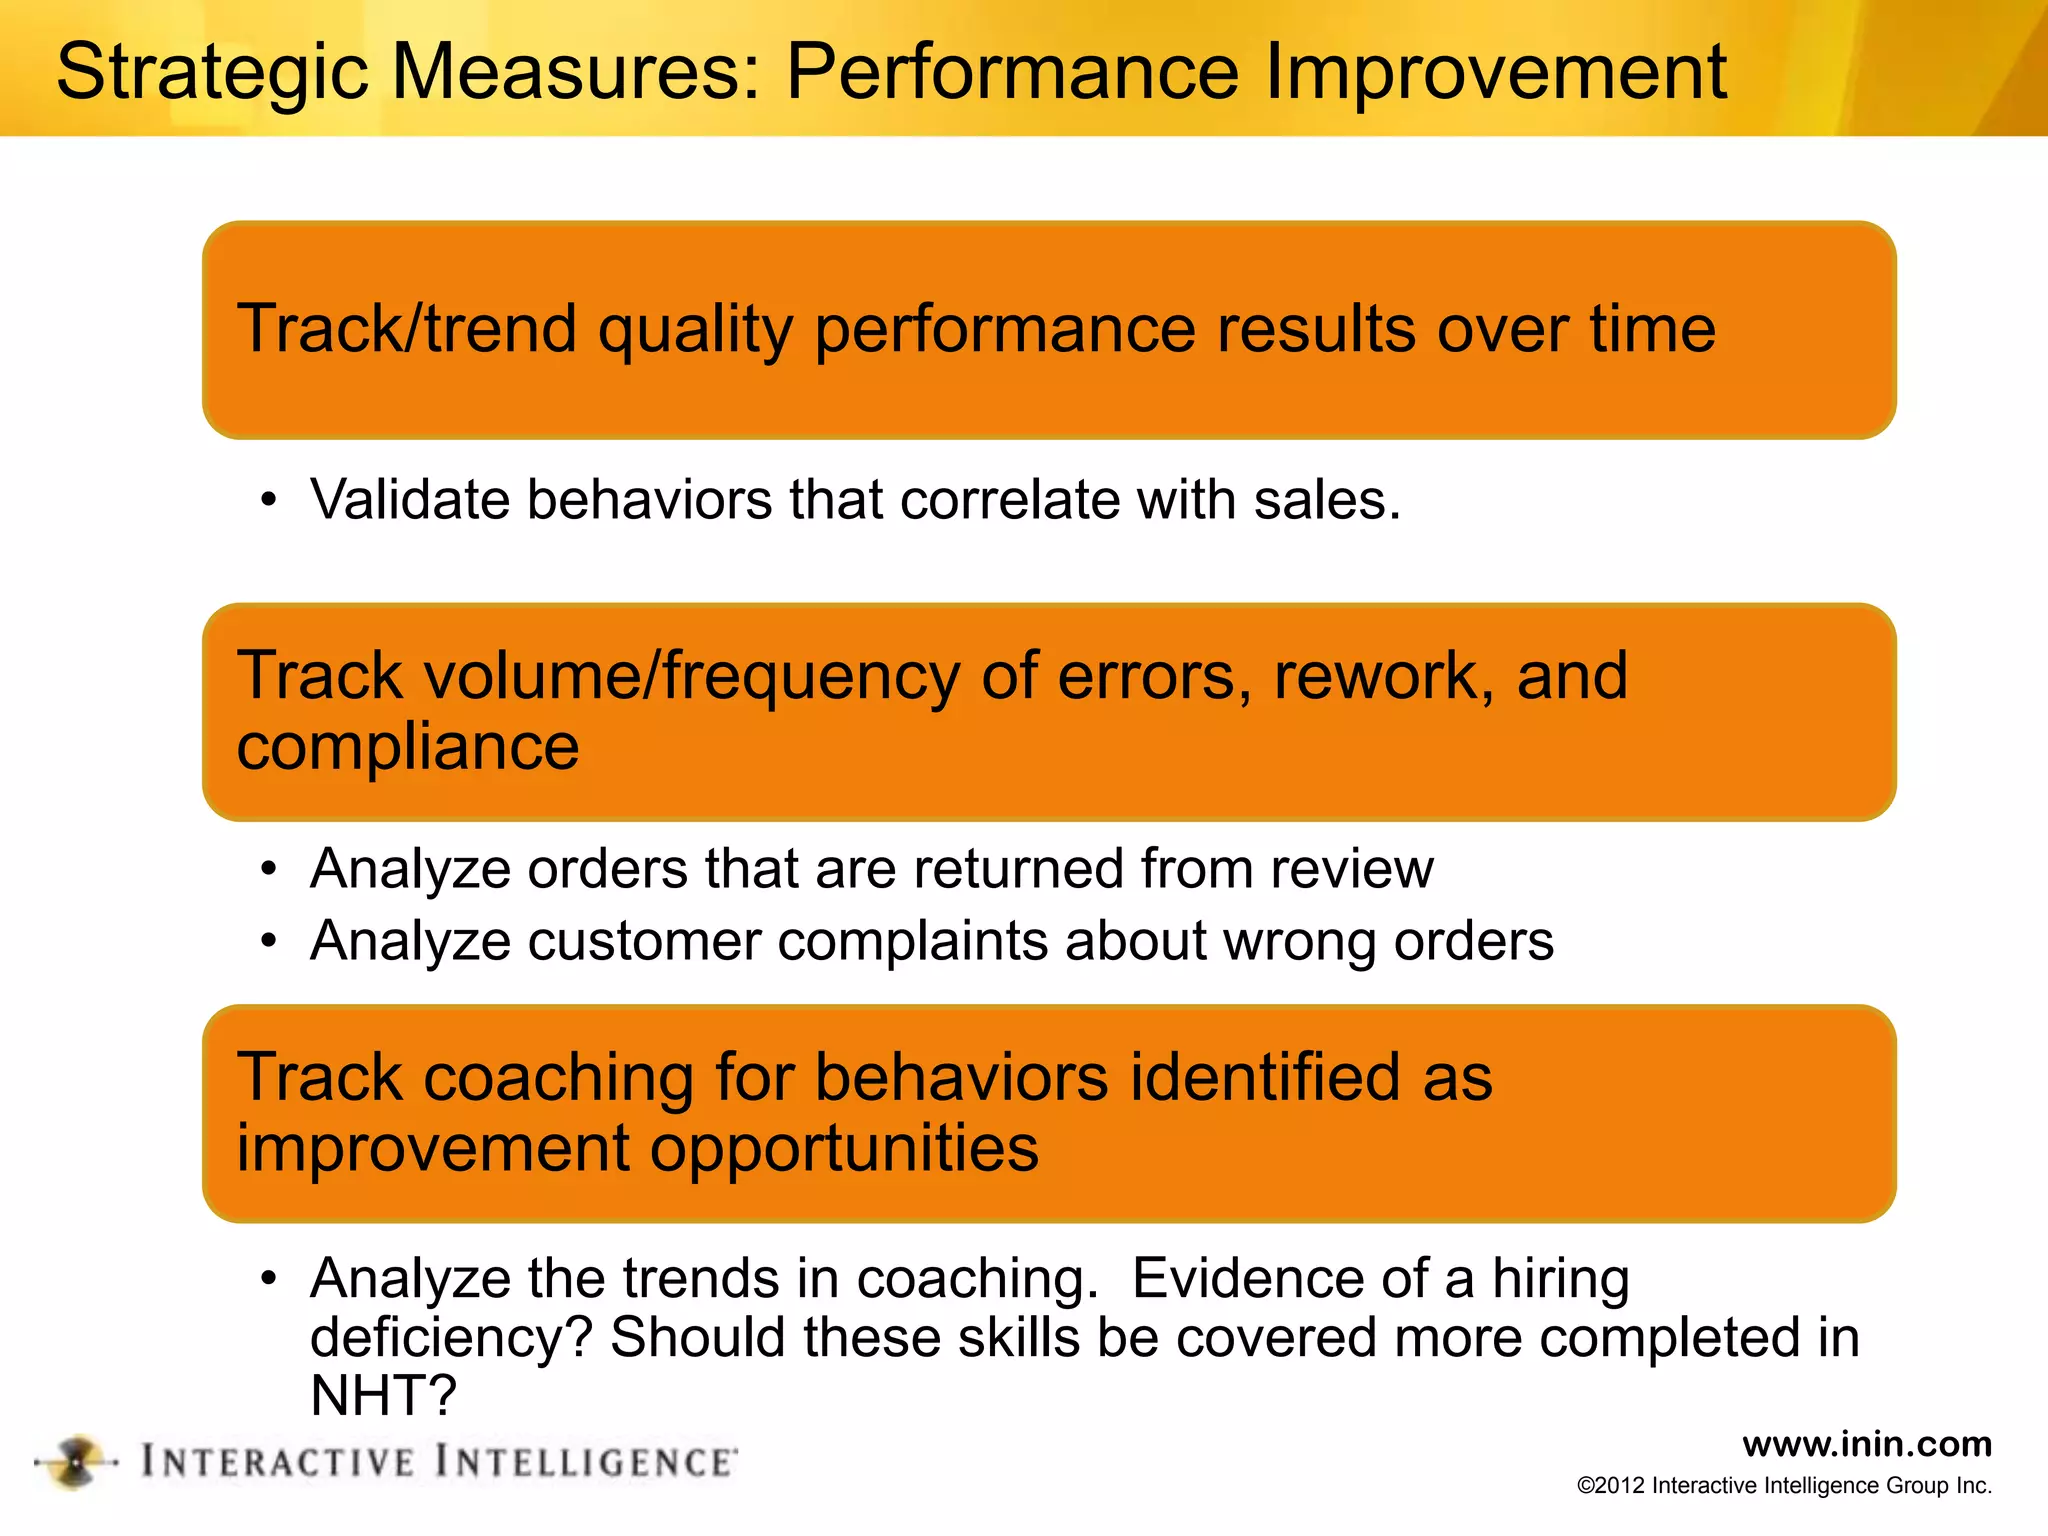
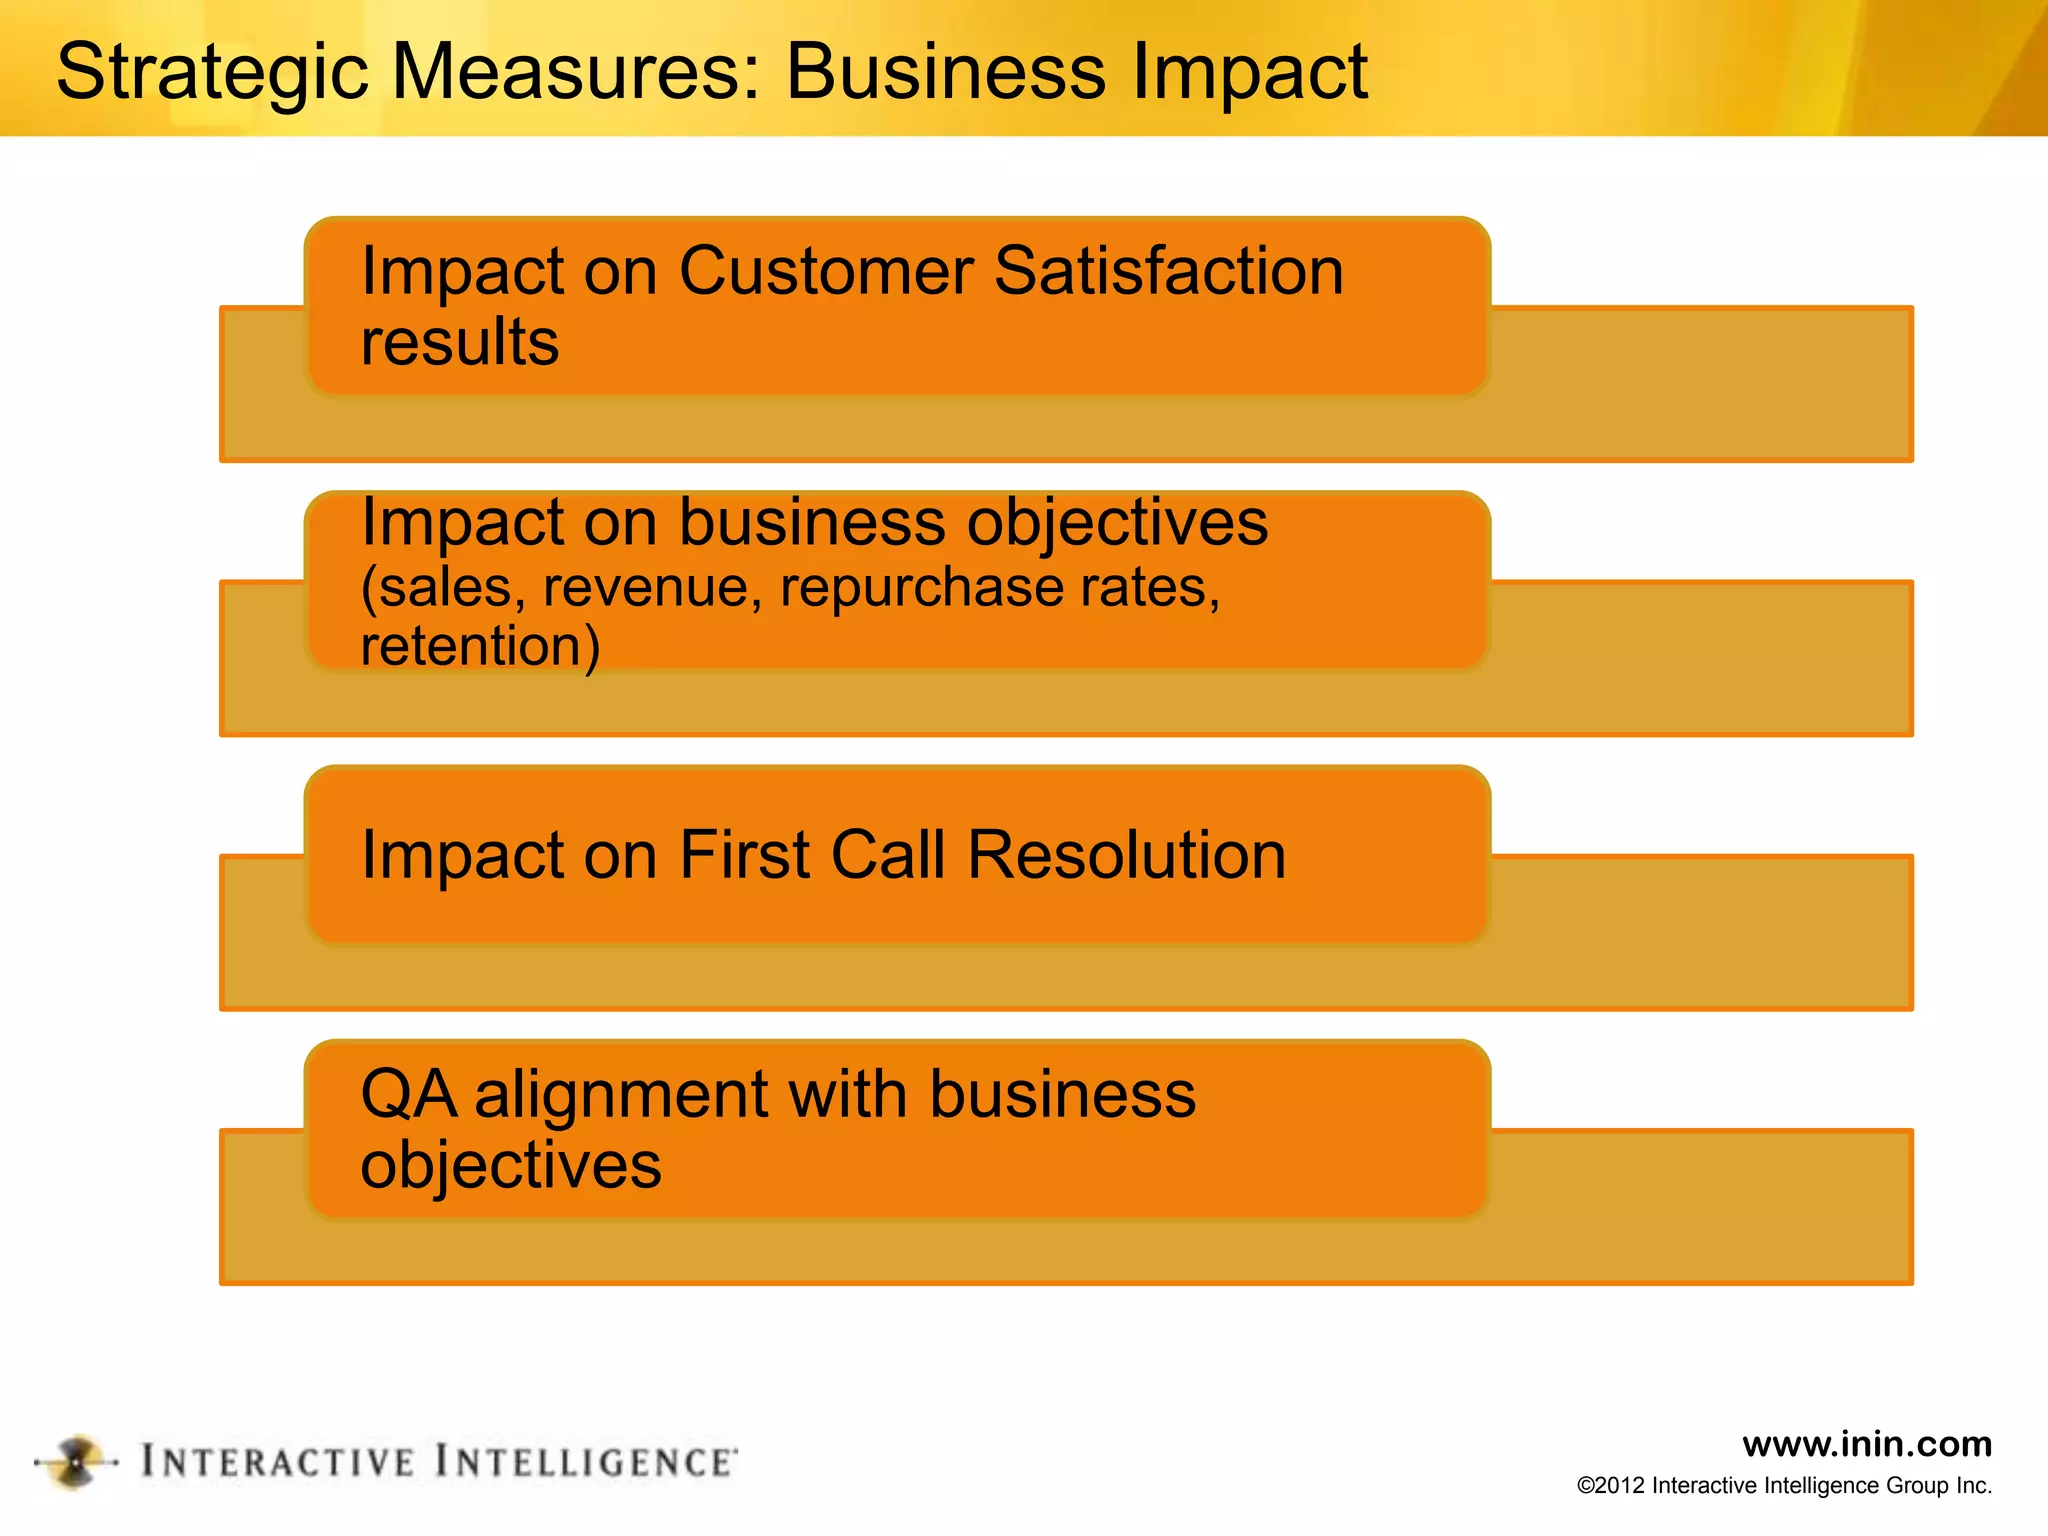
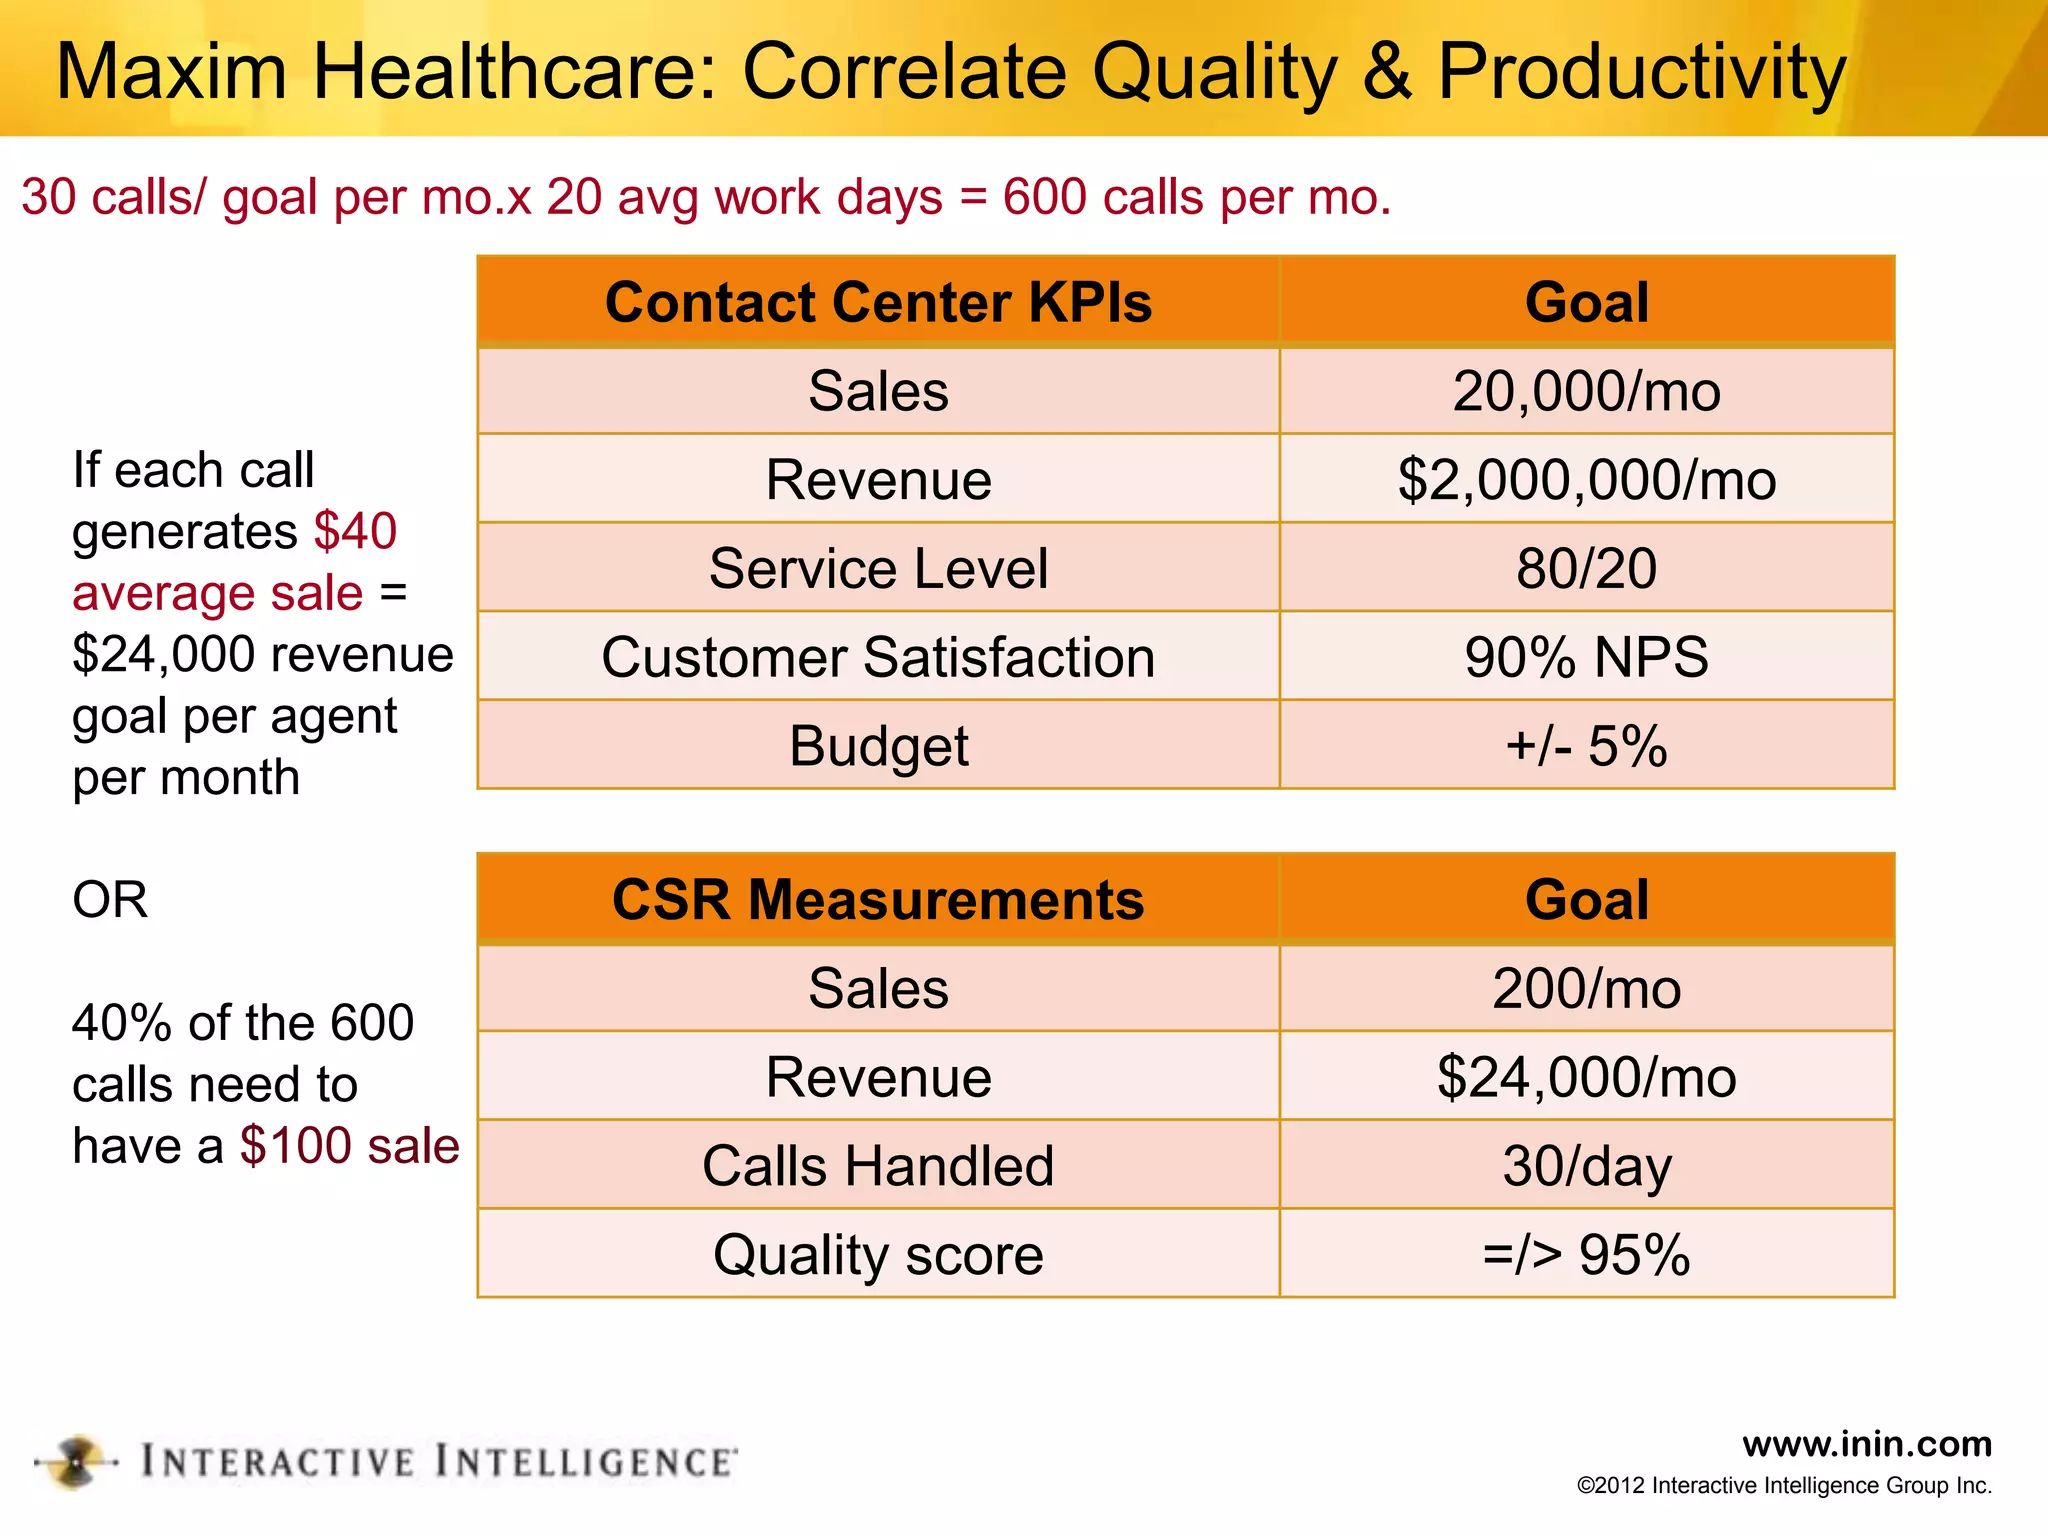
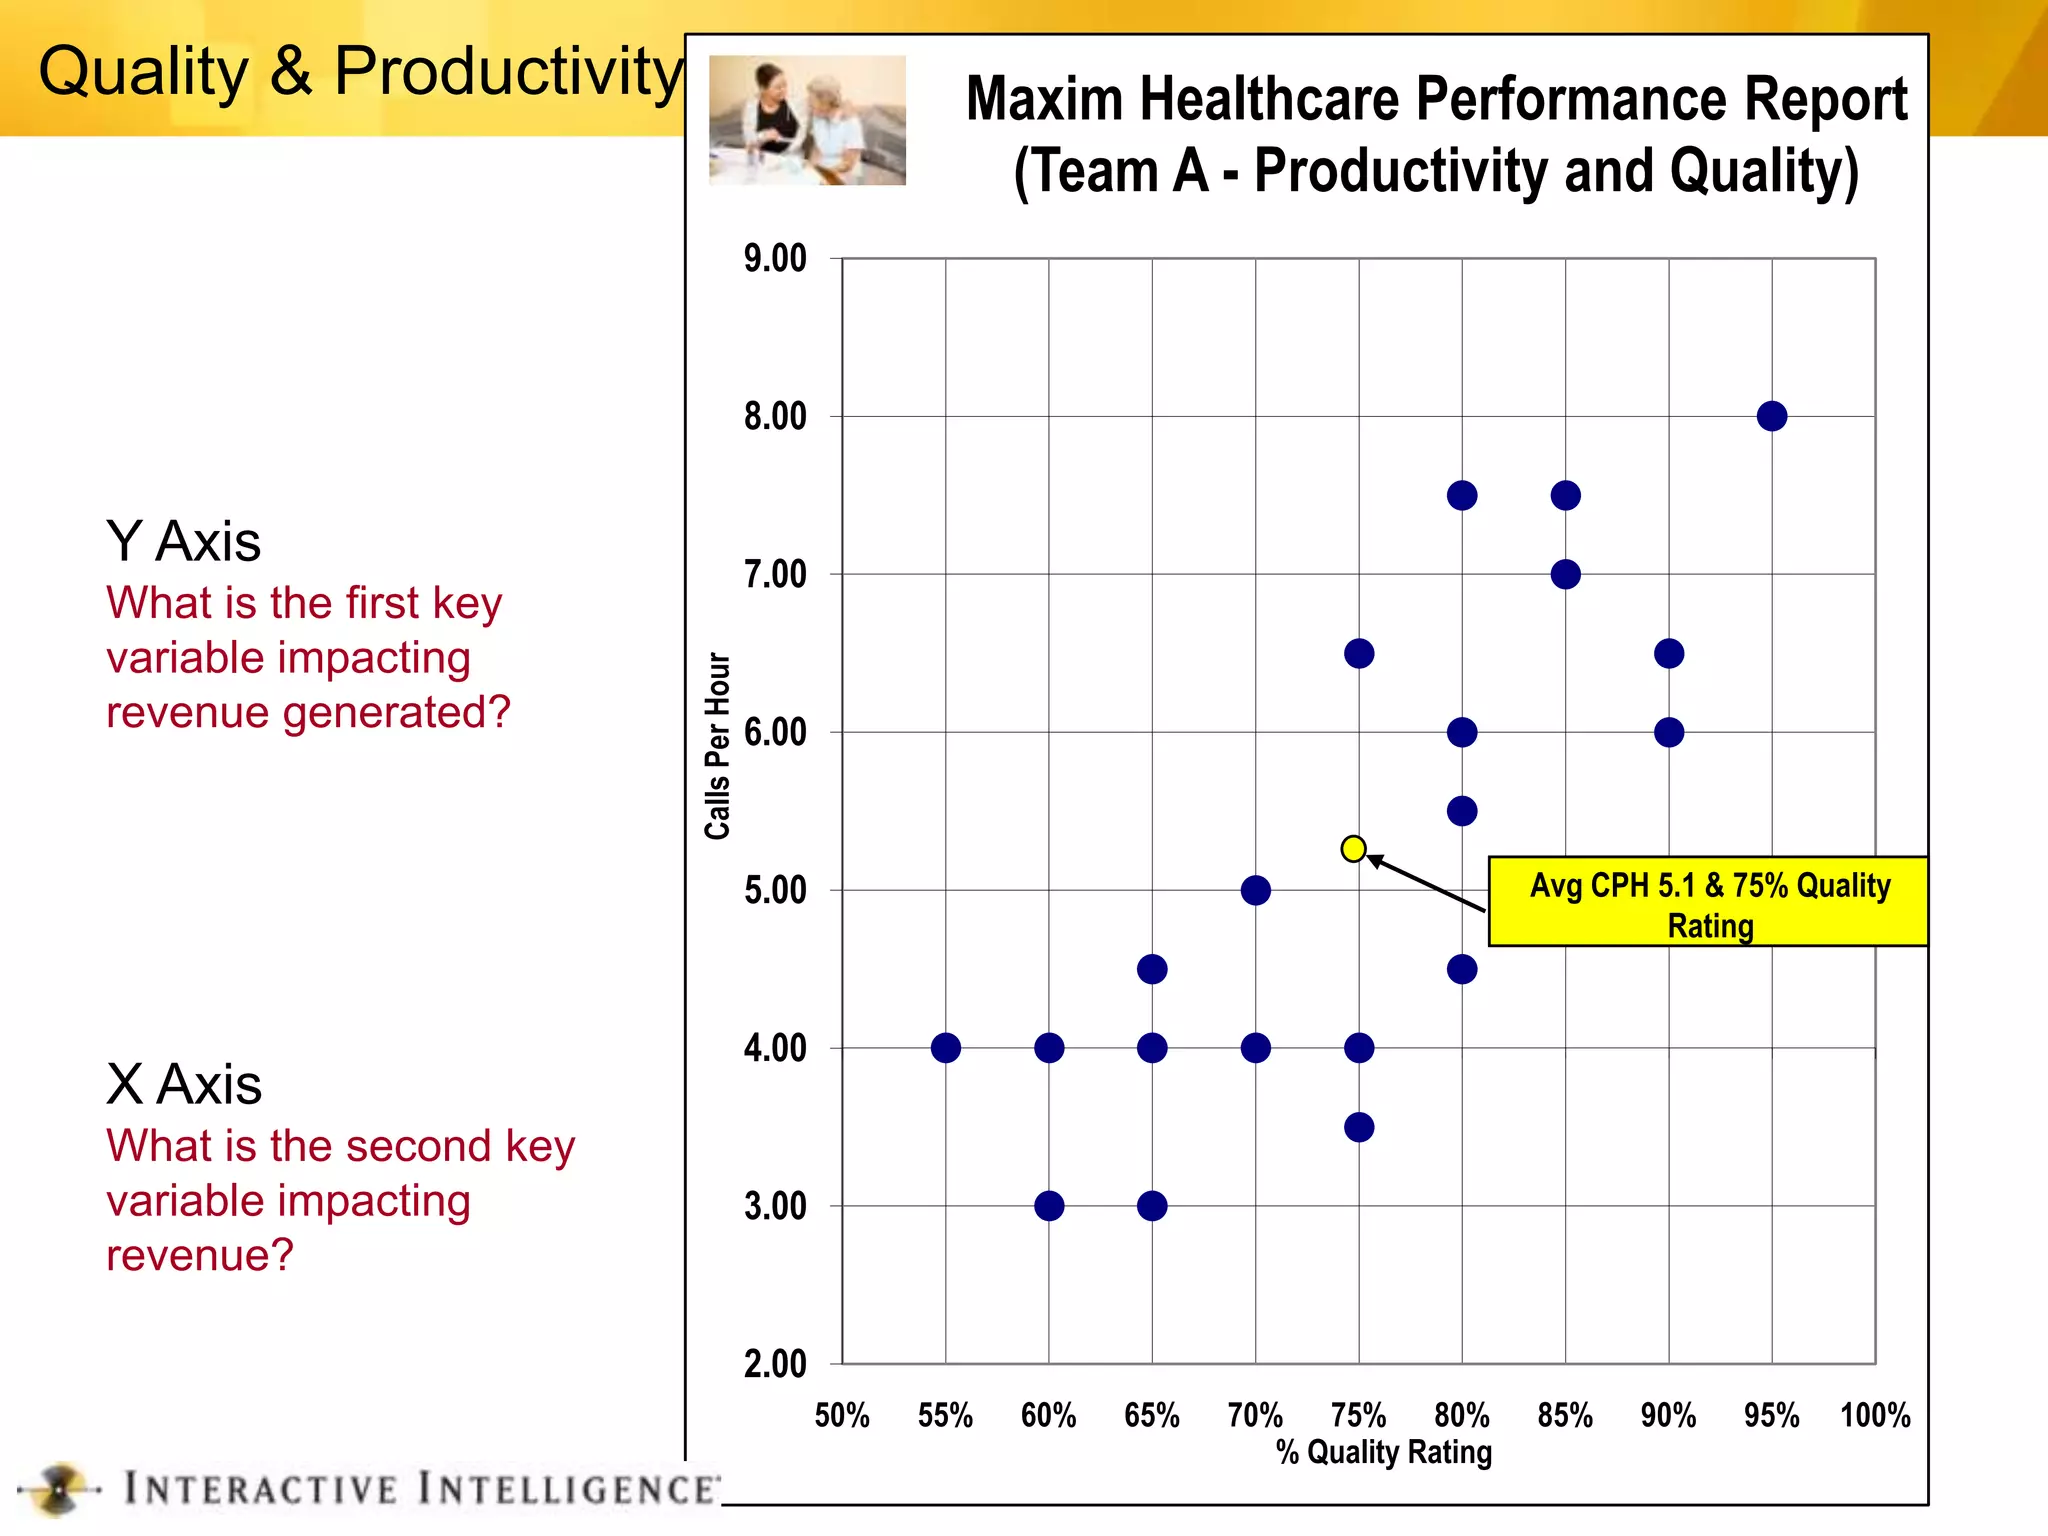
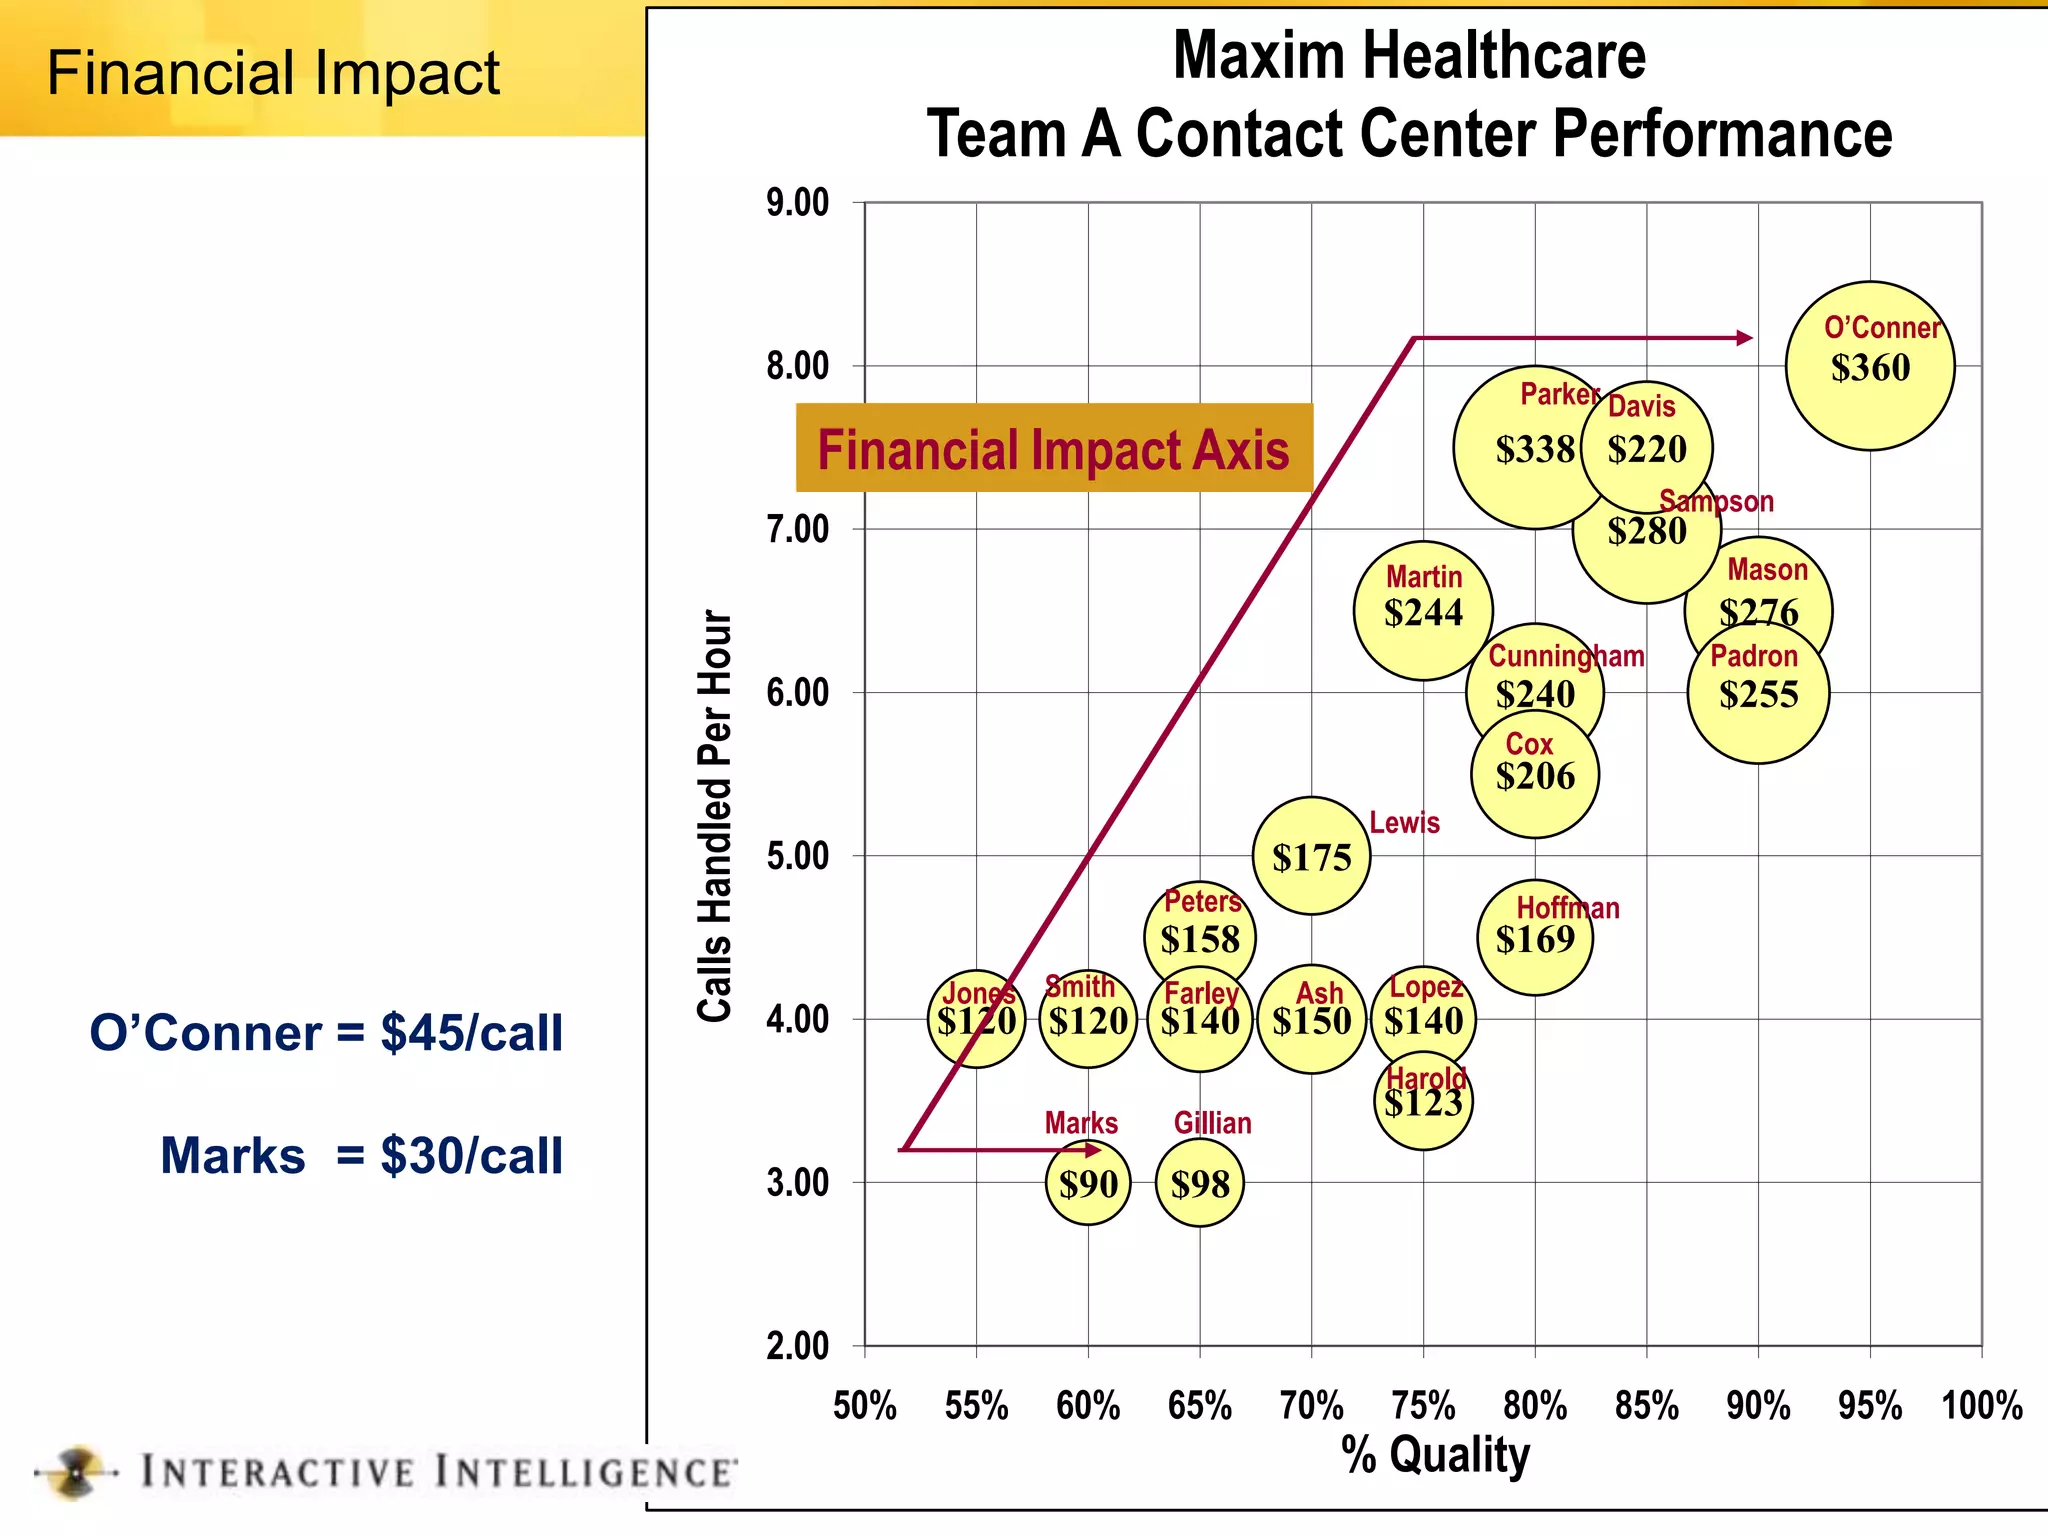
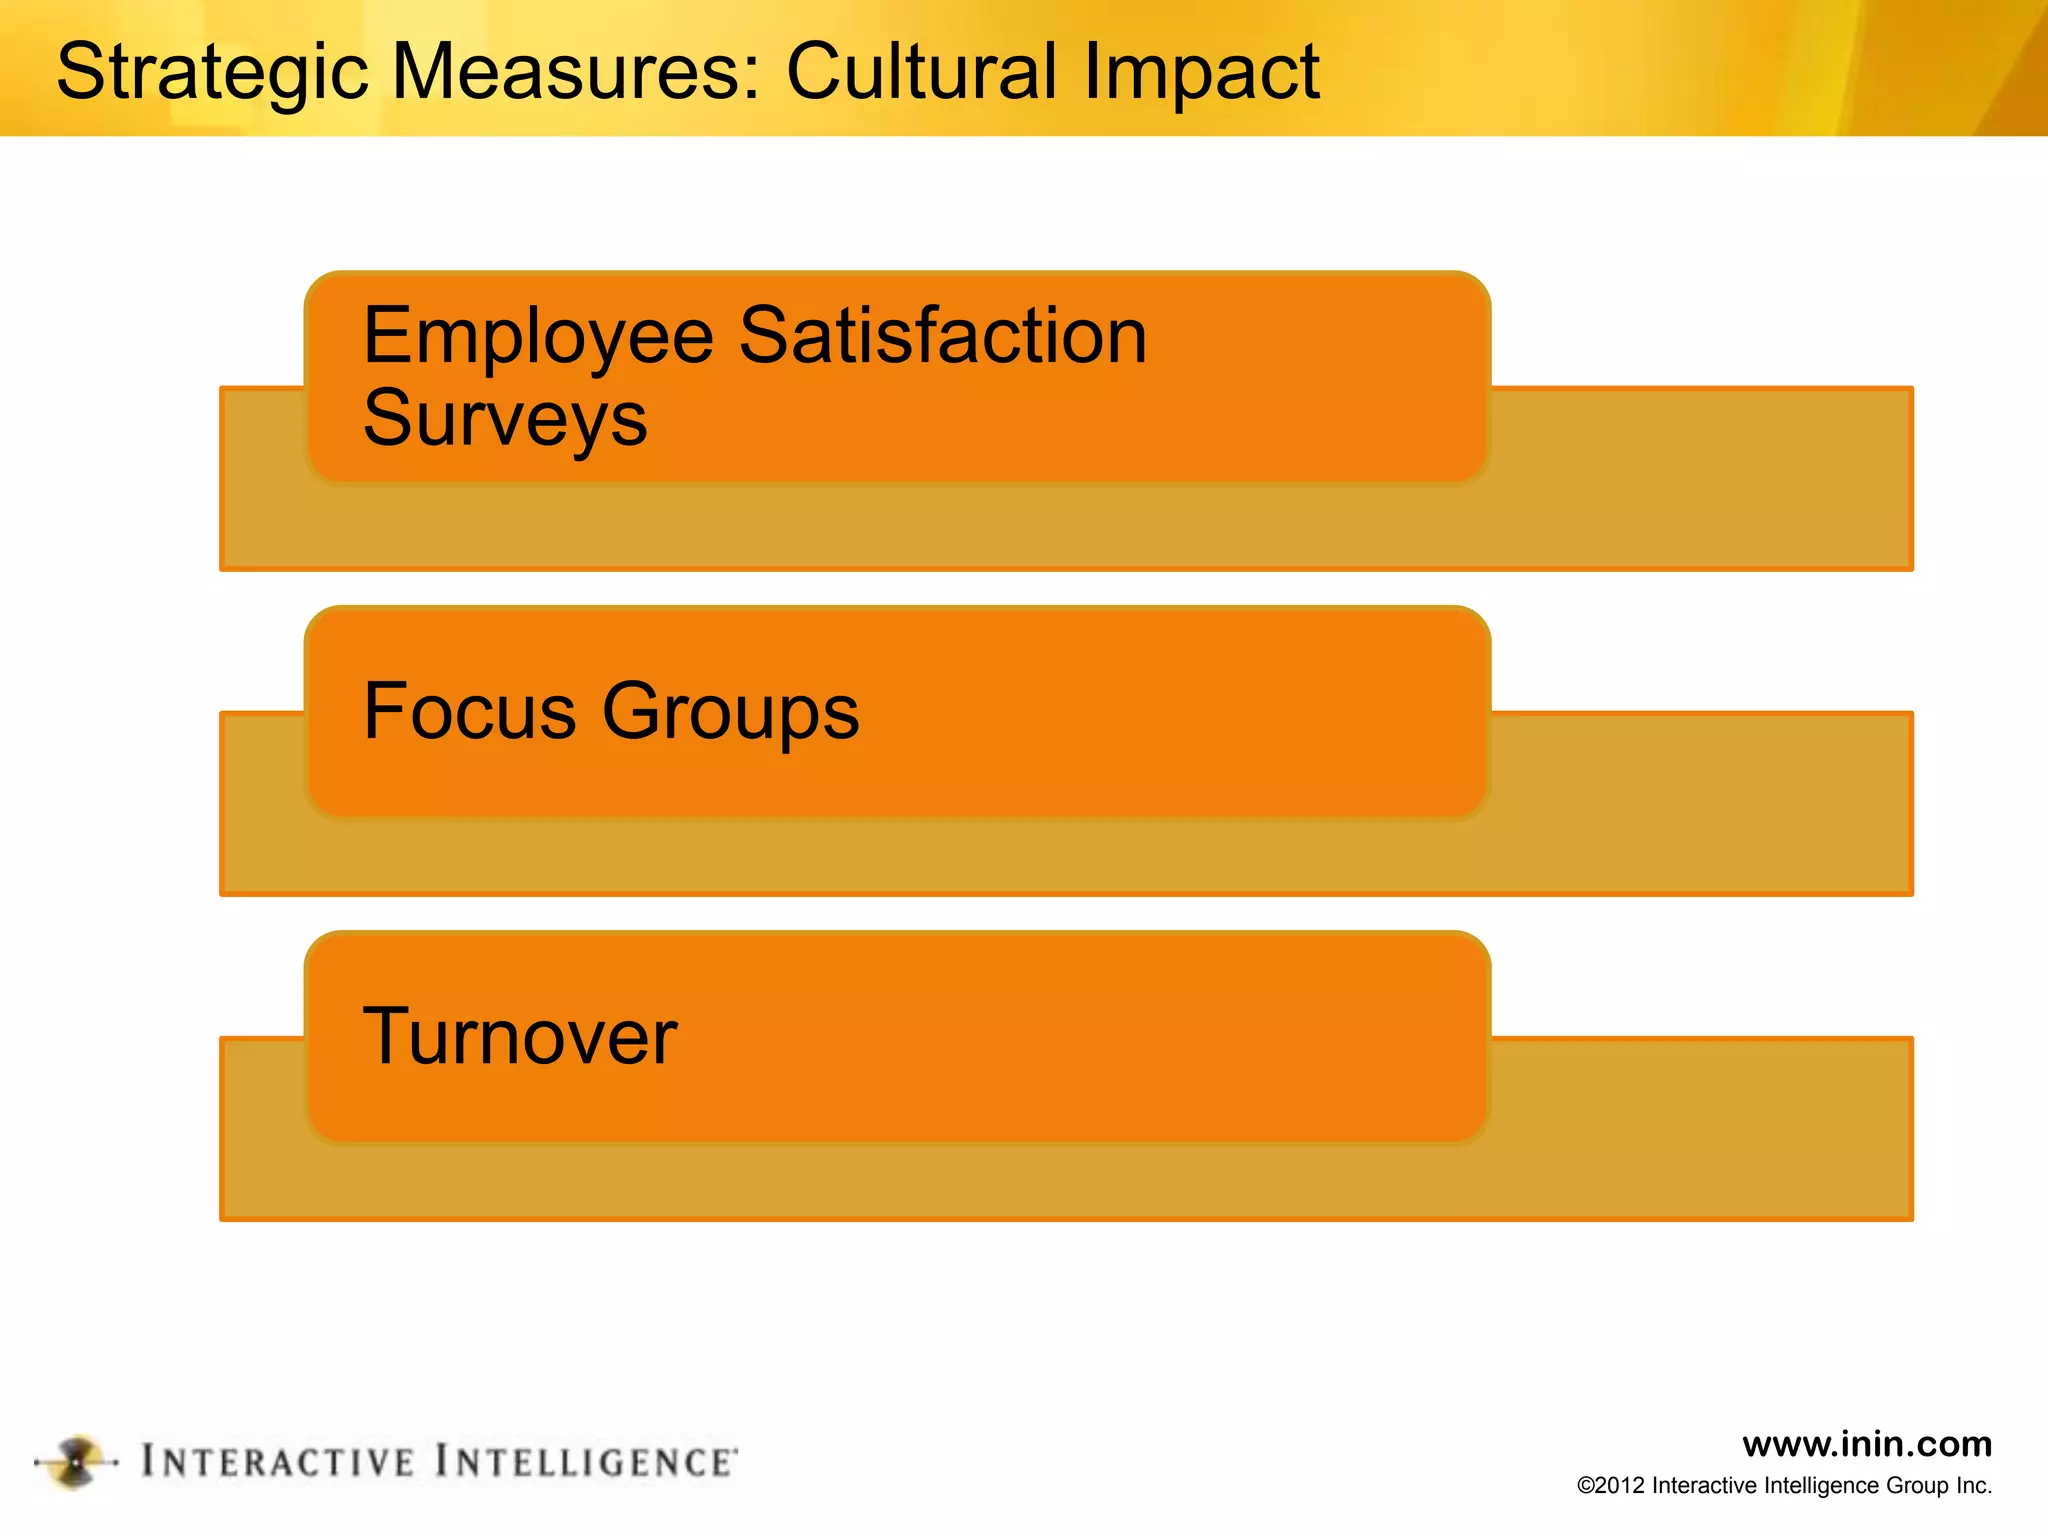
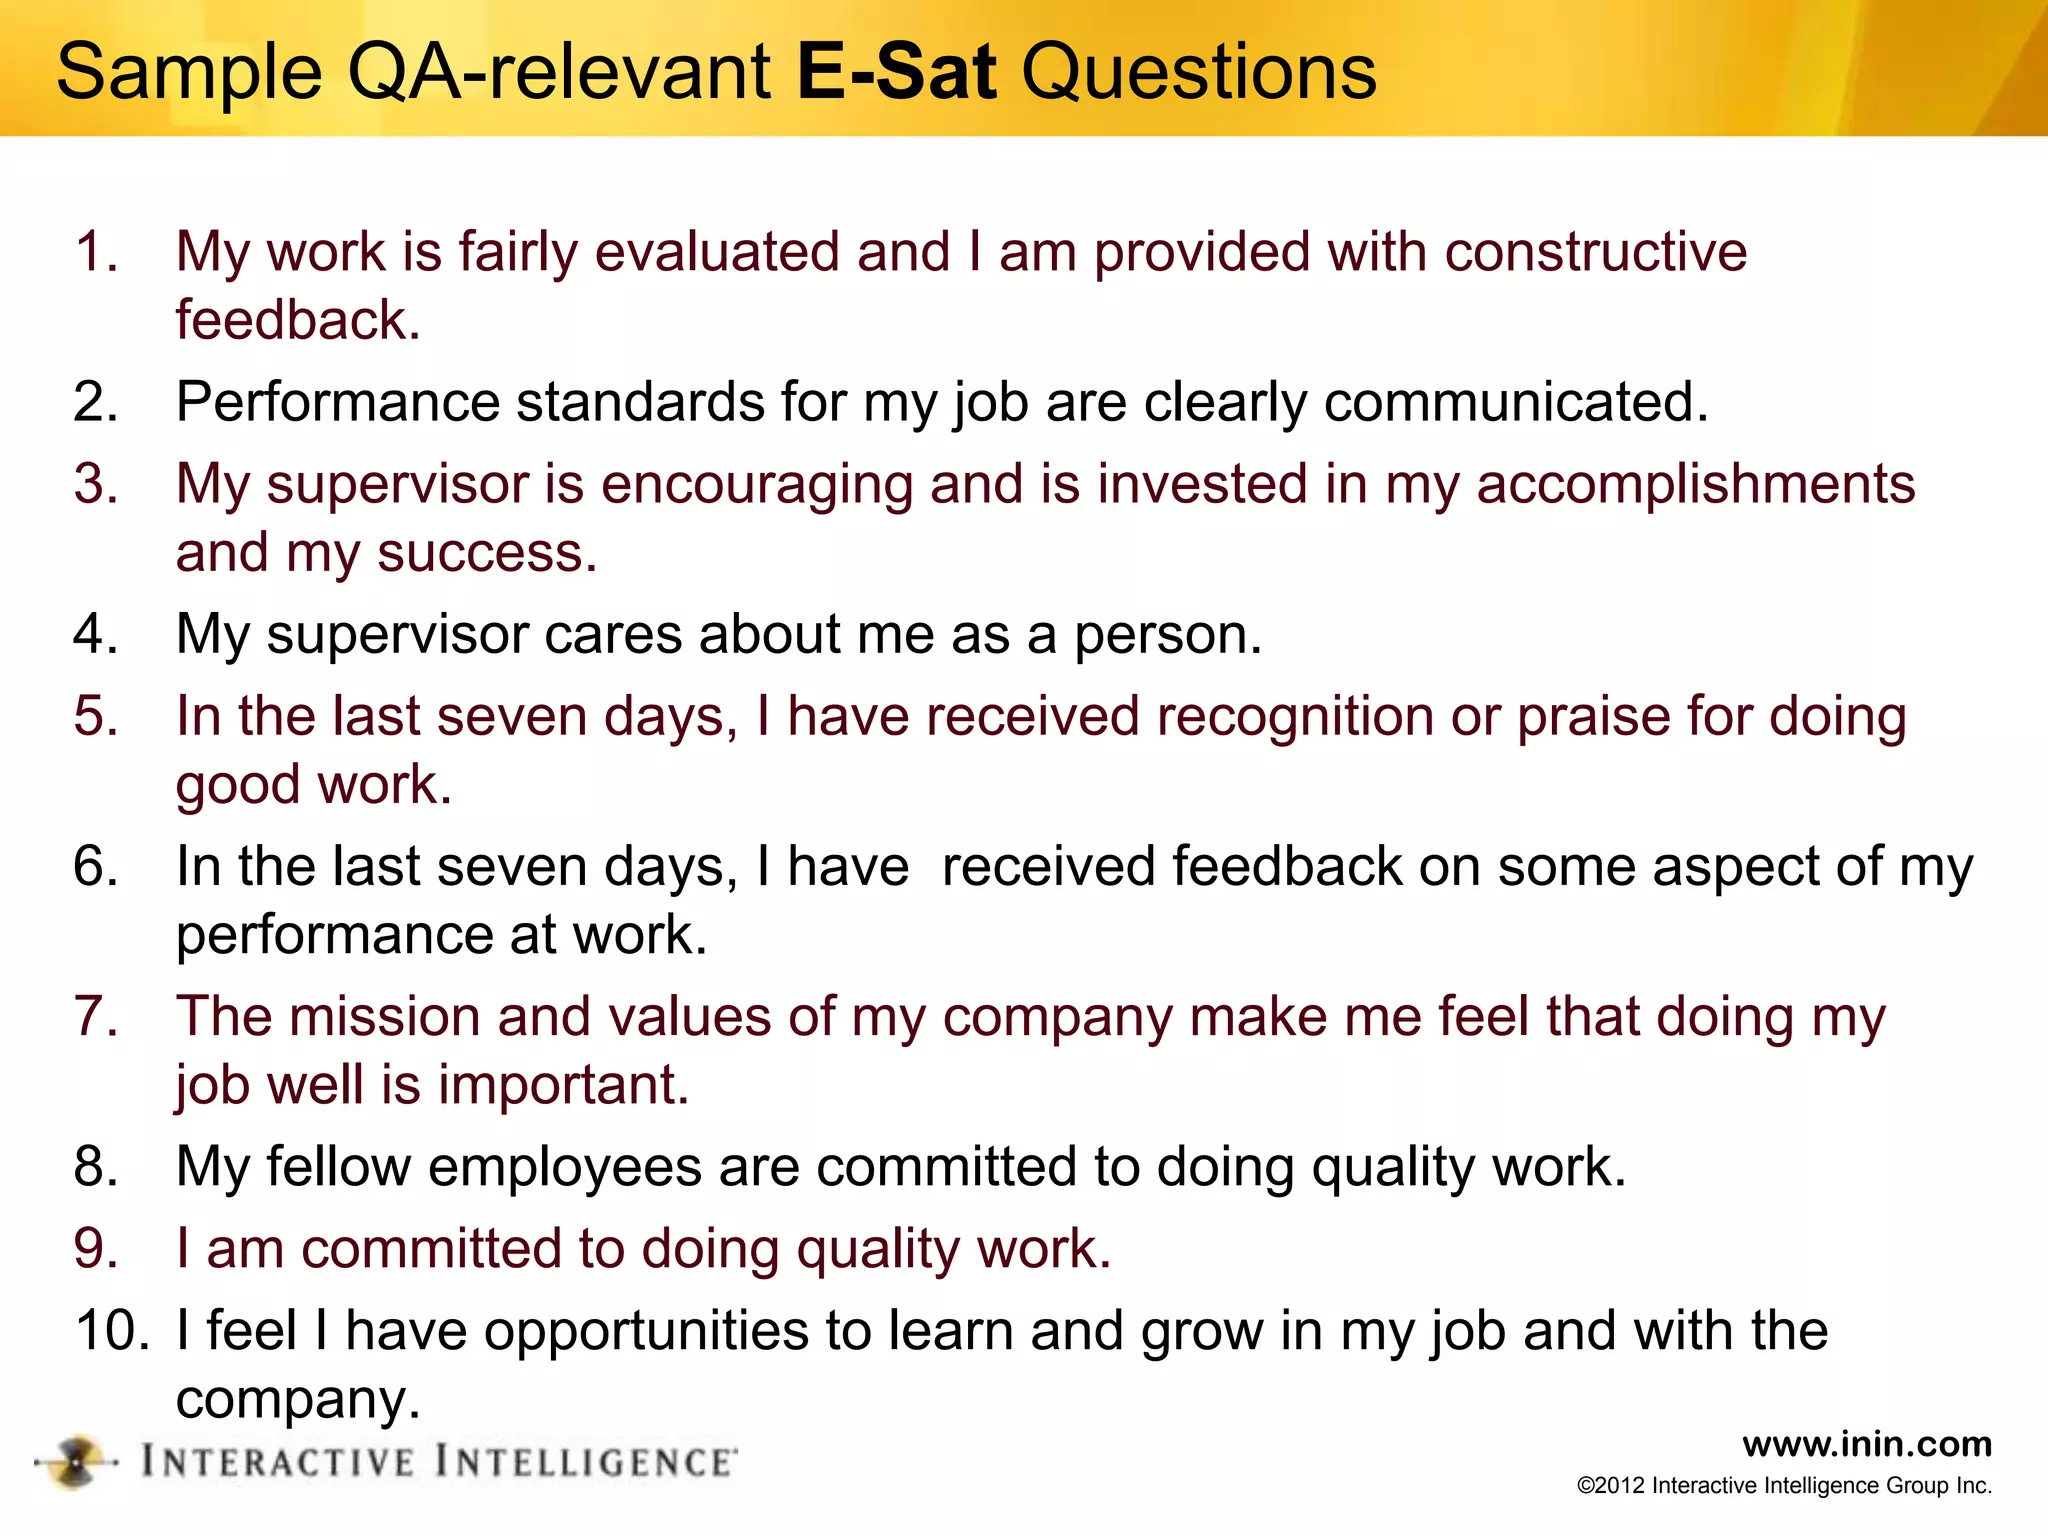
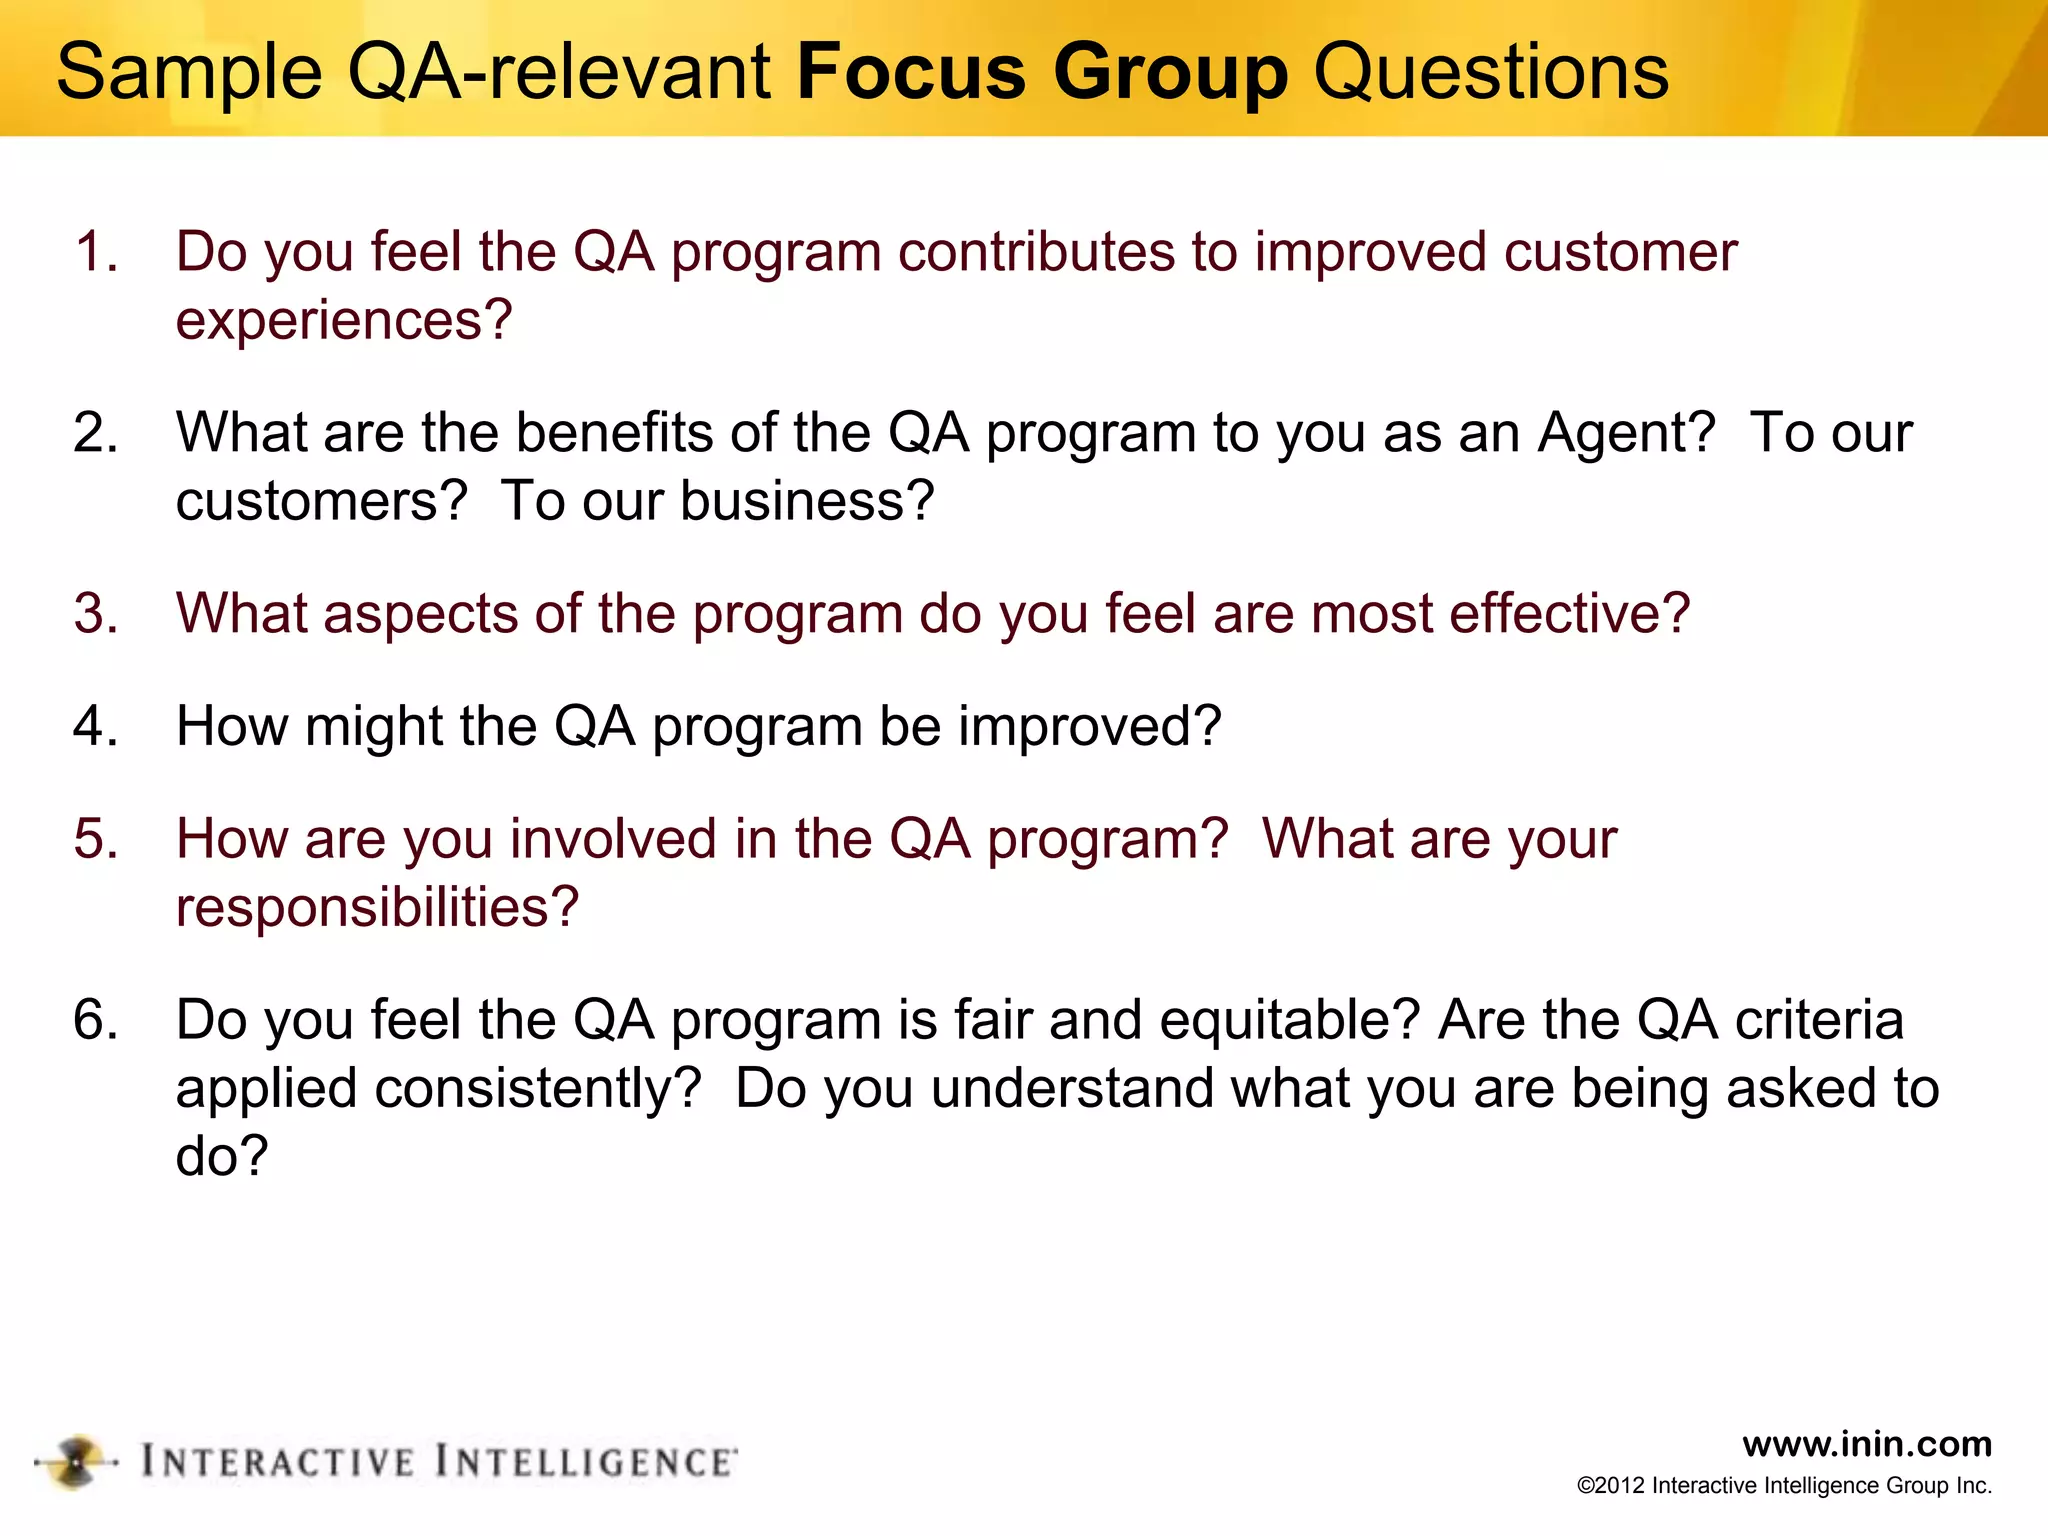
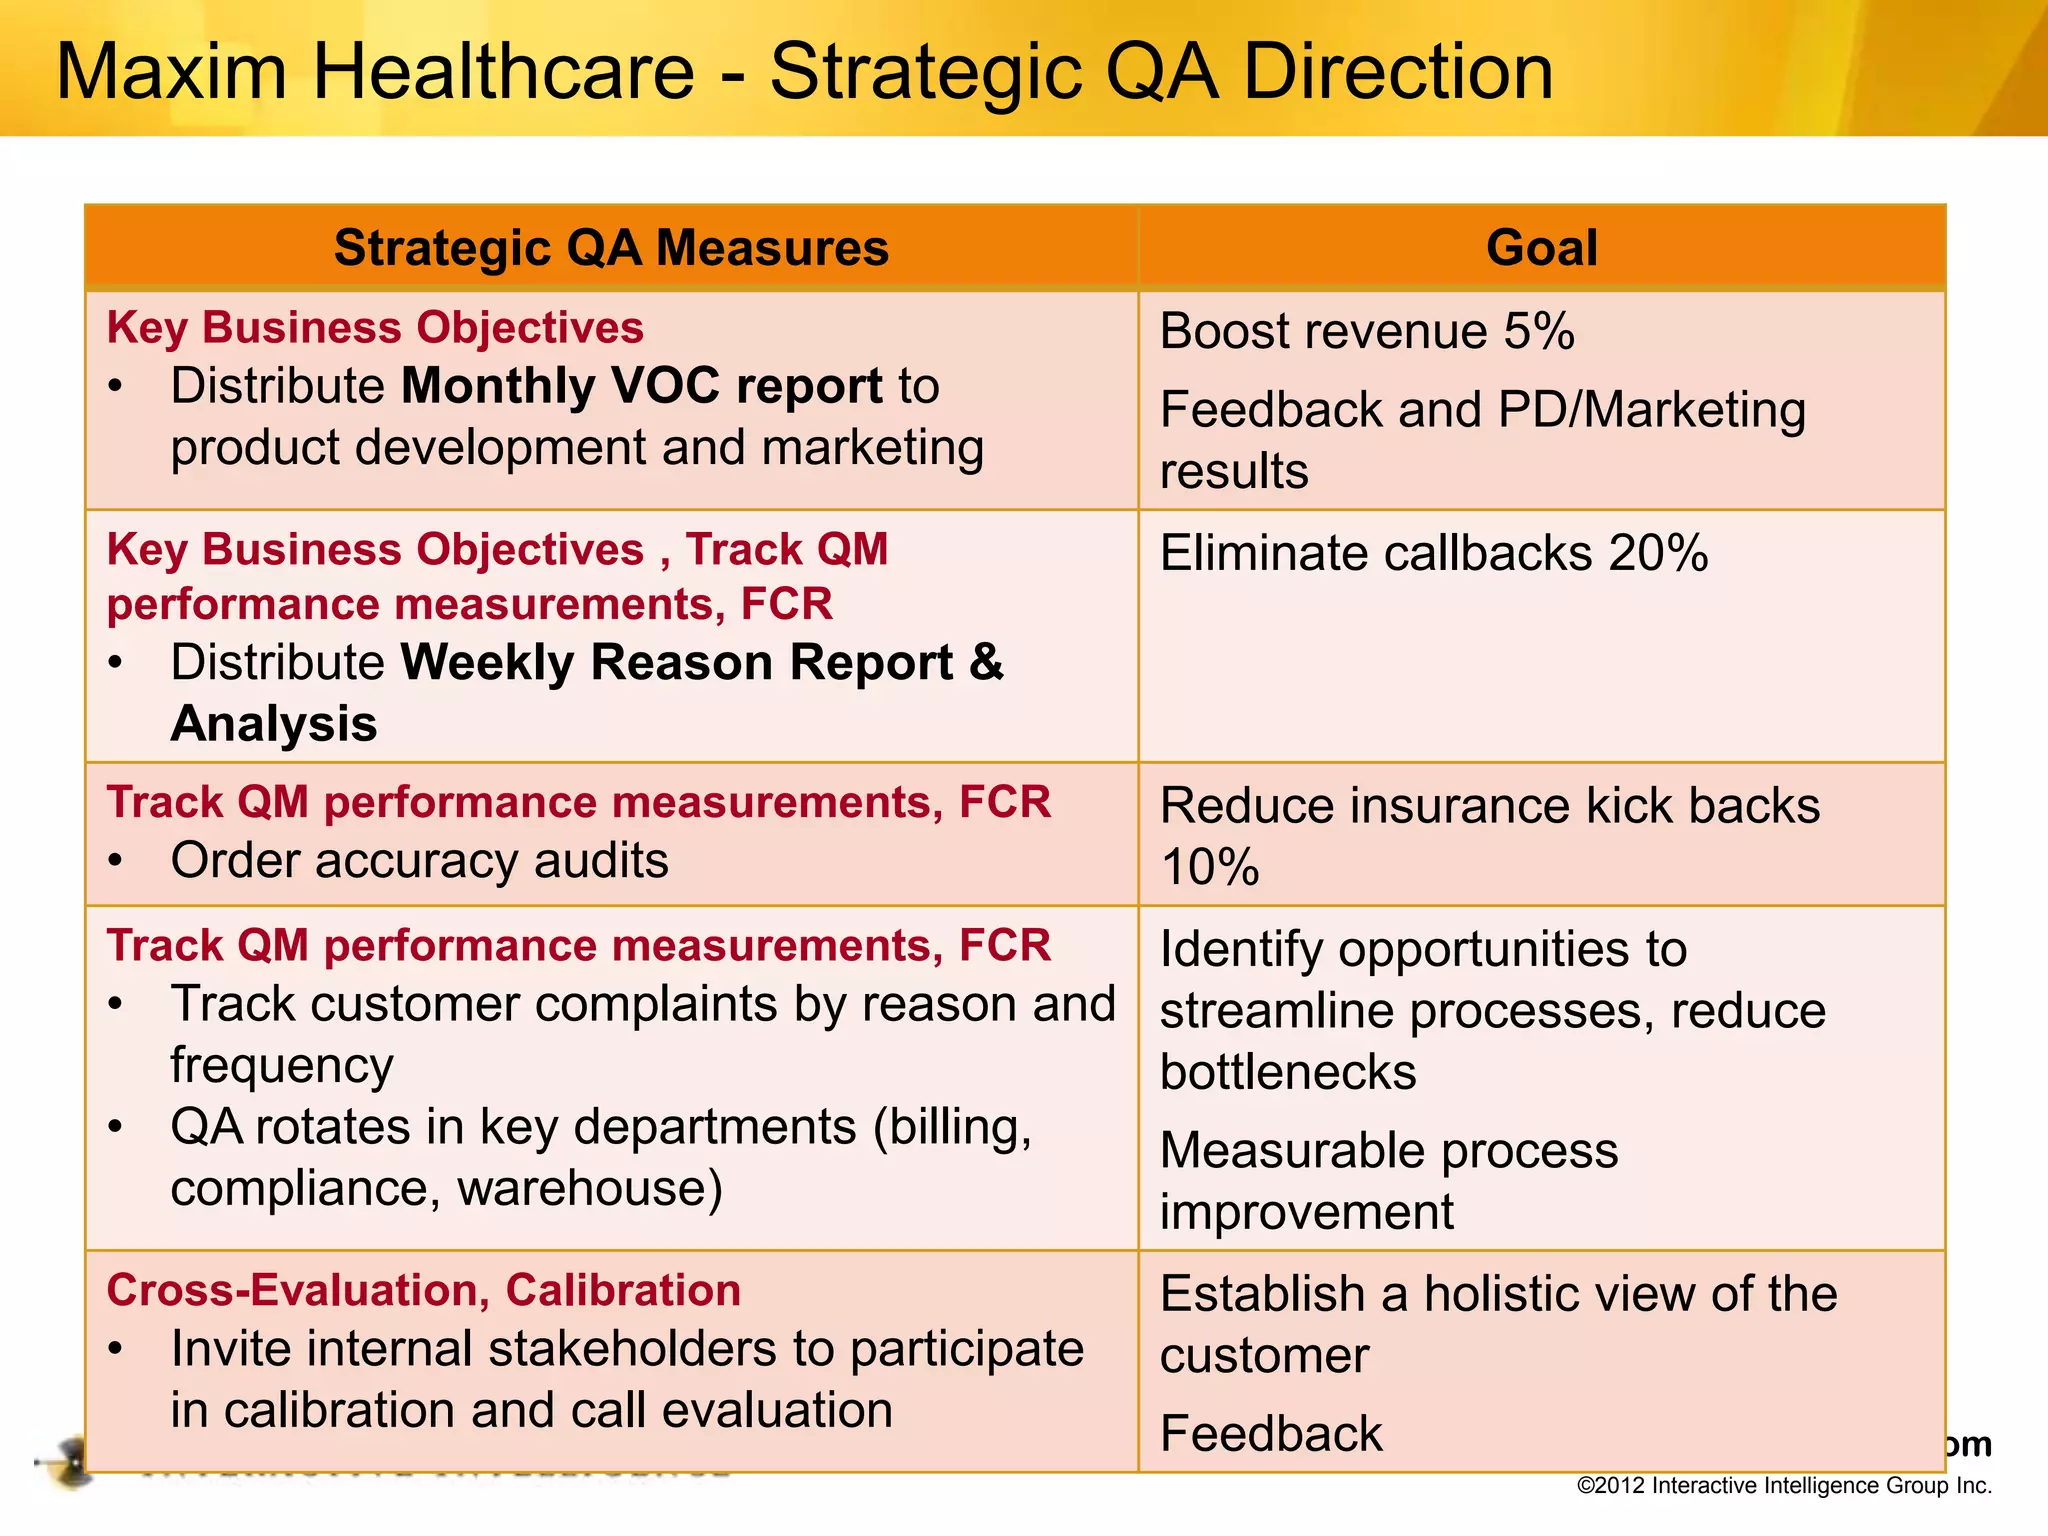
Harnessing the Potential of Quality
Assurance #402
Rebecca Gibson
Contact Center Solutions Consulting
Interactive Intelligence
Session Agenda


  1. Why traditional Quality Assurance
     Measurements don’t work.
  2. The Tactical and Strategic
     Measurements you should be using
     to evaluate the impact - and boost the
     potential – of your program.


                                                      www.inin.com
                                      ©2012 Interactive Intelligence Group Inc.
Traditional QA Measures


  1. How many calls did we evaluate?
  2. What were the QA scores?


  The Quality Team is
  responsible for quality.
  The contact is evaluated
  within the context of the
  agent and the contact
  center.

                                                       www.inin.com
                                       ©2012 Interactive Intelligence Group Inc.
Why Traditional QA Measures don’t work

  Reason #1: they don’t reflect today’s business
  environment
   Proliferating contact types
   Speed of change
   Consolidation
   Increased regulation
   Competition
   Social media
   Tight budgets

                                                          www.inin.com
                                          ©2012 Interactive Intelligence Group Inc.
Reason #2: Quality is more than a score


                                                          www.inin.com
                                          ©2012 Interactive Intelligence Group Inc.
Reason #3: Internal measures aren’t valid

•Self-reported
 internal
 measurements may
 be influenced by
 expectations and fear.
•Internal measures
 leave out our most
 important
 stakeholder: the
 customer.
                                                            www.inin.com
                                            ©2012 Interactive Intelligence Group Inc.
Internal and External View of Quality Service

                                         Agent Performance
              Recording                  • Adherence to policies &
                Calls                      procedures
 Internal      Email &                   • Script adherence
                Chat                     • Agent productivity
                                         • Efficiency
            CSAT                         Customer feedback
                   External
                                         • Correlation of internal & externa
                                           quality
                                         • Product & process improvement
                                 &
 Internal     Real-time                  Agent & Customer
                              External
               Speech                    • Alerts & notifications
              Analytics                  • Agent guidance
                                         • First Contact Resolution
                                         • Compliance
                                                                         www.inin.com
                                                         ©2012 Interactive Intelligence Group Inc.
High
Traditional   Cost
  Quality
Measures       Low
              Value


                                 www.inin.com
                 ©2012 Interactive Intelligence Group Inc.
So, what else is there?


            Traditional
              Quality
            Measures
                            Cost
                          Effective
                            High
                           Value
            Customer
            & Business
             Focused
              Quality
            Measures

                                                  www.inin.com
                                  ©2012 Interactive Intelligence Group Inc.
Maxim Healthcare
                Quality Assurance          Goal
                 Measurements
                     # of calls             7
               evaluated/CSR/month
                  Quality score
               Contact Center KPIs       =/> 95%
                                           Goal
If 100
agents                Sales             20,000/mo
process 50
                     Revenue           $2,000,000/mo
orders per
week, that’s       Service Level           80/20
20,000         Customer Satisfaction     90% NPS
orders a
month.              Budget                +/- 5%
               CSR Measurements            Goal
                      Sales               200/mo
                     Revenue            $24,000/mo
                  Calls Handled           30/day
                   Quality score         =/> 95%
                                                                    www.inin.com
                                                    ©2012 Interactive Intelligence Group Inc.
Tactical & Strategic Measurement Categories


            • Consistency               • Performance
 Tactical


                            Strategic
            • Efficiency                  improvement
                                        • Business
                                          Impact
                                        • Cultural Impact


                                                                www.inin.com
                                                ©2012 Interactive Intelligence Group Inc.
Tactical Measures: Efficiency


       # or % calls evaluated


       # or % time spent on Quality
       activities


       Budget to actual


                                                      www.inin.com
                                      ©2012 Interactive Intelligence Group Inc.
Tactical Measures: Consistency


       Calibration


       Cross-evaluation


       Data analysis


                                                 www.inin.com
                                 ©2012 Interactive Intelligence Group Inc.
Tactical Measures: Consistency                Maxim Healthcare


   Calibration
    • Easier to achieve and maintain consistency with a
      dedicated QA resource

   Cross-evaluation

   Data analysis
    • Analysis of QA results may reveal inconsistencies
      best addressed by a dedicated QA resource


                                                                www.inin.com
                                                ©2012 Interactive Intelligence Group Inc.
Why Are You Monitoring? The Strategic Perspective


 • What is the purpose of our
   Quality program?
 • What is a quality contact?
 • What are critical agent
   behaviors?
• How does high quality impact the bottom
  line?
• What measures will provide a picture of
  quality service and value to the contact
  center and organization?
                                                             www.inin.com
                                             ©2012 Interactive Intelligence Group Inc.
Strategic Measures: Performance Improvement


      Track/trend quality performance results over
      time

      Track volume/frequency of errors, rework,
      and compliance

      Track coaching for behaviors identified as
      improvement opportunities


      Return on investment


                                                                   www.inin.com
                                                   ©2012 Interactive Intelligence Group Inc.
Return on Investment


                       Labor


                                               www.inin.com
                               ©2012 Interactive Intelligence Group Inc.
Return on Investment

 Add it Up! Maxim’s QA Program
 Costs
 Quality Monitoring Software
 100 seats@$1,000/seat = $100,000
 Supervisor Salaries
 $409,200 annual / 20% = $81,840
 QA Program Return
 • Cost of poor/ performance quality?
 • Errors, rework, callbacks, company culture
 • Return on high/improved performance?
 • FCR, C-Sat, handle time, revenue
                                                                www.inin.com
                                                ©2012 Interactive Intelligence Group Inc.
Strategic Measures: Performance Improvement


    Track/trend quality performance results over time

     • Validate behaviors that correlate with sales.


    Track volume/frequency of errors, rework, and
    compliance
     • Analyze orders that are returned from review
     • Analyze customer complaints about wrong orders

    Track coaching for behaviors identified as
    improvement opportunities
     • Analyze the trends in coaching. Evidence of a hiring
       deficiency? Should these skills be covered more completed in
       NHT?
                                                                        www.inin.com
                                                        ©2012 Interactive Intelligence Group Inc.
Strategic Measures: Business Impact

        Impact on Customer Satisfaction
        results

        Impact on business objectives
        (sales, revenue, repurchase rates,
        retention)


        Impact on First Call Resolution


        QA alignment with business
        objectives


                                                             www.inin.com
                                             ©2012 Interactive Intelligence Group Inc.
Maxim Healthcare: Correlate Quality & Productivity
30 calls/ goal per mo.x 20 avg work days = 600 calls per mo.

                         Contact Center KPIs                       Goal
                                  Sales                         20,000/mo
  If each call                  Revenue                        $2,000,000/mo
  generates $40
  average sale =              Service Level                        80/20
  $24,000 revenue        Customer Satisfaction                   90% NPS
  goal per agent
                                 Budget                           +/- 5%
  per month

  OR                     CSR Measurements                          Goal
                                  Sales                           200/mo
  40% of the 600
  calls need to                 Revenue                         $24,000/mo
  have a $100 sale           Calls Handled                        30/day
                              Quality score                      =/> 95%


                                                                                     www.inin.com
                                                                     ©2012 Interactive Intelligence Group Inc.
Quality & Productivity                                 Maxim Healthcare Performance Report
                                                        (Team A - Productivity and Quality)
                                            9.00


                                            8.00


  Y Axis                                    7.00
  What is the first key
  variable impacting
  revenue generated?       Calls Per Hour   6.00


                                            5.00                                             Avg CPH 5.1 & 75% Quality
                                                                                                      Rating


                                            4.00
  X Axis
  What is the second key
  variable impacting                        3.00
  revenue?

                                            2.00
                                            X Axis
                                               50%   55%   60%   65%   70% 75% 80%           85%    90%    95%    100%
                                                                          % Quality Rating
Financial Impact                                                     Maxim Healthcare
                                                             Team A Contact Center Performance
                                                9.00


                                                                                                                                O’Conner
                                                8.00                                                                            $360
                                                                                                        Parker Davis

                                                   Financial Impact Axis                              $338 $220
                                                                                                                   Sampson
                                                7.00                                                          $280
                                                                                             Martin                     Mason
                                                                                             $244                      $276

                       Calls Handled Per Hour
                                                                                                      Cunningham       Padron
                                                6.00                                                  $240             $255
                                                                                                       Cox
                                                                                                      $206
                                                                                            Lewis
                                                5.00                                 $175
                                                                           Peters                      Hoffman
                                                                           $158                       $169
                                                             Jones Smith   Farley     Ash    Lopez
 O’Conner = $45/call                            4.00         $120 $120 $140 $150 $140
                                                                                             Harold
                                                                   Marks   Gillian
                                                                                             $123
    Marks = $30/call                            3.00                $90    $98


                                                2.00
                                                       50%   55%    60%    65%       70%     75%      80%      85%      90%     95% 100%
                                                                                        % Quality
Strategic Measures: Cultural Impact


        Employee Satisfaction
        Surveys


        Focus Groups


        Turnover


                                                      www.inin.com
                                      ©2012 Interactive Intelligence Group Inc.
Sample QA-relevant E-Sat Questions

1. My work is fairly evaluated and I am provided with constructive
    feedback.
2. Performance standards for my job are clearly communicated.
3. My supervisor is encouraging and is invested in my accomplishments
    and my success.
4. My supervisor cares about me as a person.
5. In the last seven days, I have received recognition or praise for doing
    good work.
6. In the last seven days, I have received feedback on some aspect of my
    performance at work.
7. The mission and values of my company make me feel that doing my
    job well is important.
8. My fellow employees are committed to doing quality work.
9. I am committed to doing quality work.
10. I feel I have opportunities to learn and grow in my job and with the
    company.
                                                                          www.inin.com
                                                          ©2012 Interactive Intelligence Group Inc.
Sample QA-relevant Focus Group Questions

1. Do you feel the QA program contributes to improved customer
   experiences?
2. What are the benefits of the QA program to you as an Agent? To our
   customers? To our business?
3. What aspects of the program do you feel are most effective?
4. How might the QA program be improved?
5. How are you involved in the QA program? What are your
   responsibilities?
6. Do you feel the QA program is fair and equitable? Are the QA criteria
   applied consistently? Do you understand what you are being asked to
   do?


                                                                          www.inin.com
                                                          ©2012 Interactive Intelligence Group Inc.
Maxim Healthcare - Strategic QA Direction

           Strategic QA Measures                                Goal
 Key Business Objectives                         Boost revenue 5%
 • Distribute Monthly VOC report to              Feedback and PD/Marketing
   product development and marketing             results
 Key Business Objectives , Track QM              Eliminate callbacks 20%
 performance measurements, FCR
 • Distribute Weekly Reason Report &
   Analysis
 Track QM performance measurements, FCR          Reduce insurance kick backs
 • Order accuracy audits                         10%
 Track QM performance measurements, FCR    Identify opportunities to
 • Track customer complaints by reason and streamline processes, reduce
   frequency                               bottlenecks
 • QA rotates in key departments (billing, Measurable process
   compliance, warehouse)                  improvement
 Cross-Evaluation, Calibration                   Establish a holistic view of the
 • Invite internal stakeholders to participate   customer
   in calibration and call evaluation            Feedback                           www.inin.com
                                                                    ©2012 Interactive Intelligence Group Inc.
Harnessing the Potential of Quality
Assurance #402
Rebecca Gibson
Contact Center Solutions Consulting
Interactive Intelligence
rebecca.gibson@inin.com / 443.254.3750


      Thank you for attending this session.
      Please fill out an evaluation form

CCA 2013 Harness the Potential of QA

  • 1.
    Harnessing the Potentialof Quality Assurance #402 Rebecca Gibson Contact Center Solutions Consulting Interactive Intelligence
  • 2.
    Session Agenda 1. Why traditional Quality Assurance Measurements don’t work. 2. The Tactical and Strategic Measurements you should be using to evaluate the impact - and boost the potential – of your program. www.inin.com ©2012 Interactive Intelligence Group Inc.
  • 3.
    Traditional QA Measures 1. How many calls did we evaluate? 2. What were the QA scores? The Quality Team is responsible for quality. The contact is evaluated within the context of the agent and the contact center. www.inin.com ©2012 Interactive Intelligence Group Inc.
  • 4.
    Why Traditional QAMeasures don’t work Reason #1: they don’t reflect today’s business environment Proliferating contact types Speed of change Consolidation Increased regulation Competition Social media Tight budgets www.inin.com ©2012 Interactive Intelligence Group Inc.
  • 5.
    Reason #2: Qualityis more than a score www.inin.com ©2012 Interactive Intelligence Group Inc.
  • 6.
    Reason #3: Internalmeasures aren’t valid •Self-reported internal measurements may be influenced by expectations and fear. •Internal measures leave out our most important stakeholder: the customer. www.inin.com ©2012 Interactive Intelligence Group Inc.
  • 7.
    Internal and ExternalView of Quality Service Agent Performance Recording • Adherence to policies & Calls procedures Internal Email & • Script adherence Chat • Agent productivity • Efficiency CSAT Customer feedback External • Correlation of internal & externa quality • Product & process improvement & Internal Real-time Agent & Customer External Speech • Alerts & notifications Analytics • Agent guidance • First Contact Resolution • Compliance www.inin.com ©2012 Interactive Intelligence Group Inc.
  • 8.
    High Traditional Cost Quality Measures Low Value www.inin.com ©2012 Interactive Intelligence Group Inc.
  • 9.
    So, what elseis there? Traditional Quality Measures Cost Effective High Value Customer & Business Focused Quality Measures www.inin.com ©2012 Interactive Intelligence Group Inc.
  • 10.
    Maxim Healthcare Quality Assurance Goal Measurements # of calls 7 evaluated/CSR/month Quality score Contact Center KPIs =/> 95% Goal If 100 agents Sales 20,000/mo process 50 Revenue $2,000,000/mo orders per week, that’s Service Level 80/20 20,000 Customer Satisfaction 90% NPS orders a month. Budget +/- 5% CSR Measurements Goal Sales 200/mo Revenue $24,000/mo Calls Handled 30/day Quality score =/> 95% www.inin.com ©2012 Interactive Intelligence Group Inc.
  • 11.
    Tactical & StrategicMeasurement Categories • Consistency • Performance Tactical Strategic • Efficiency improvement • Business Impact • Cultural Impact www.inin.com ©2012 Interactive Intelligence Group Inc.
  • 12.
    Tactical Measures: Efficiency # or % calls evaluated # or % time spent on Quality activities Budget to actual www.inin.com ©2012 Interactive Intelligence Group Inc.
  • 13.
    Tactical Measures: Consistency Calibration Cross-evaluation Data analysis www.inin.com ©2012 Interactive Intelligence Group Inc.
  • 14.
    Tactical Measures: Consistency Maxim Healthcare Calibration • Easier to achieve and maintain consistency with a dedicated QA resource Cross-evaluation Data analysis • Analysis of QA results may reveal inconsistencies best addressed by a dedicated QA resource www.inin.com ©2012 Interactive Intelligence Group Inc.
  • 15.
    Why Are YouMonitoring? The Strategic Perspective • What is the purpose of our Quality program? • What is a quality contact? • What are critical agent behaviors? • How does high quality impact the bottom line? • What measures will provide a picture of quality service and value to the contact center and organization? www.inin.com ©2012 Interactive Intelligence Group Inc.
  • 16.
    Strategic Measures: PerformanceImprovement Track/trend quality performance results over time Track volume/frequency of errors, rework, and compliance Track coaching for behaviors identified as improvement opportunities Return on investment www.inin.com ©2012 Interactive Intelligence Group Inc.
  • 17.
    Return on Investment Labor www.inin.com ©2012 Interactive Intelligence Group Inc.
  • 18.
    Return on Investment Add it Up! Maxim’s QA Program Costs Quality Monitoring Software 100 seats@$1,000/seat = $100,000 Supervisor Salaries $409,200 annual / 20% = $81,840 QA Program Return • Cost of poor/ performance quality? • Errors, rework, callbacks, company culture • Return on high/improved performance? • FCR, C-Sat, handle time, revenue www.inin.com ©2012 Interactive Intelligence Group Inc.
  • 19.
    Strategic Measures: PerformanceImprovement Track/trend quality performance results over time • Validate behaviors that correlate with sales. Track volume/frequency of errors, rework, and compliance • Analyze orders that are returned from review • Analyze customer complaints about wrong orders Track coaching for behaviors identified as improvement opportunities • Analyze the trends in coaching. Evidence of a hiring deficiency? Should these skills be covered more completed in NHT? www.inin.com ©2012 Interactive Intelligence Group Inc.
  • 20.
    Strategic Measures: BusinessImpact Impact on Customer Satisfaction results Impact on business objectives (sales, revenue, repurchase rates, retention) Impact on First Call Resolution QA alignment with business objectives www.inin.com ©2012 Interactive Intelligence Group Inc.
  • 21.
    Maxim Healthcare: CorrelateQuality & Productivity 30 calls/ goal per mo.x 20 avg work days = 600 calls per mo. Contact Center KPIs Goal Sales 20,000/mo If each call Revenue $2,000,000/mo generates $40 average sale = Service Level 80/20 $24,000 revenue Customer Satisfaction 90% NPS goal per agent Budget +/- 5% per month OR CSR Measurements Goal Sales 200/mo 40% of the 600 calls need to Revenue $24,000/mo have a $100 sale Calls Handled 30/day Quality score =/> 95% www.inin.com ©2012 Interactive Intelligence Group Inc.
  • 22.
    Quality & Productivity Maxim Healthcare Performance Report (Team A - Productivity and Quality) 9.00 8.00 Y Axis 7.00 What is the first key variable impacting revenue generated? Calls Per Hour 6.00 5.00 Avg CPH 5.1 & 75% Quality Rating 4.00 X Axis What is the second key variable impacting 3.00 revenue? 2.00 X Axis 50% 55% 60% 65% 70% 75% 80% 85% 90% 95% 100% % Quality Rating
  • 23.
    Financial Impact Maxim Healthcare Team A Contact Center Performance 9.00 O’Conner 8.00 $360 Parker Davis Financial Impact Axis $338 $220 Sampson 7.00 $280 Martin Mason $244 $276 Calls Handled Per Hour Cunningham Padron 6.00 $240 $255 Cox $206 Lewis 5.00 $175 Peters Hoffman $158 $169 Jones Smith Farley Ash Lopez O’Conner = $45/call 4.00 $120 $120 $140 $150 $140 Harold Marks Gillian $123 Marks = $30/call 3.00 $90 $98 2.00 50% 55% 60% 65% 70% 75% 80% 85% 90% 95% 100% % Quality
  • 24.
    Strategic Measures: CulturalImpact Employee Satisfaction Surveys Focus Groups Turnover www.inin.com ©2012 Interactive Intelligence Group Inc.
  • 25.
    Sample QA-relevant E-SatQuestions 1. My work is fairly evaluated and I am provided with constructive feedback. 2. Performance standards for my job are clearly communicated. 3. My supervisor is encouraging and is invested in my accomplishments and my success. 4. My supervisor cares about me as a person. 5. In the last seven days, I have received recognition or praise for doing good work. 6. In the last seven days, I have received feedback on some aspect of my performance at work. 7. The mission and values of my company make me feel that doing my job well is important. 8. My fellow employees are committed to doing quality work. 9. I am committed to doing quality work. 10. I feel I have opportunities to learn and grow in my job and with the company. www.inin.com ©2012 Interactive Intelligence Group Inc.
  • 26.
    Sample QA-relevant FocusGroup Questions 1. Do you feel the QA program contributes to improved customer experiences? 2. What are the benefits of the QA program to you as an Agent? To our customers? To our business? 3. What aspects of the program do you feel are most effective? 4. How might the QA program be improved? 5. How are you involved in the QA program? What are your responsibilities? 6. Do you feel the QA program is fair and equitable? Are the QA criteria applied consistently? Do you understand what you are being asked to do? www.inin.com ©2012 Interactive Intelligence Group Inc.
  • 27.
    Maxim Healthcare -Strategic QA Direction Strategic QA Measures Goal Key Business Objectives Boost revenue 5% • Distribute Monthly VOC report to Feedback and PD/Marketing product development and marketing results Key Business Objectives , Track QM Eliminate callbacks 20% performance measurements, FCR • Distribute Weekly Reason Report & Analysis Track QM performance measurements, FCR Reduce insurance kick backs • Order accuracy audits 10% Track QM performance measurements, FCR Identify opportunities to • Track customer complaints by reason and streamline processes, reduce frequency bottlenecks • QA rotates in key departments (billing, Measurable process compliance, warehouse) improvement Cross-Evaluation, Calibration Establish a holistic view of the • Invite internal stakeholders to participate customer in calibration and call evaluation Feedback www.inin.com ©2012 Interactive Intelligence Group Inc.
  • 28.
    Harnessing the Potentialof Quality Assurance #402 Rebecca Gibson Contact Center Solutions Consulting Interactive Intelligence rebecca.gibson@inin.com / 443.254.3750 Thank you for attending this session. Please fill out an evaluation form

Editor's Notes

  • #8 AN EFFECTIVE QM PROGRAM – THAT MAKES THE MOST OF EFFORTS AND PROVIDES VALUE – INCLUDES OUR INTERNAL (TRADITIONAL VIEW OF QUALITY- WHERE WE EVAL AGENT PERFORMANCE – ID OPPORTUNITIES TO IMP INTERNAL PROCESS AND IMPROV OPPS BECOMES MORE VALUABLE WHEN WE INTEGRATE THE CUSTOMER PERCEPTION – BETTER TO ID FCR – CALL DRIVERSBOTH TRADITIONAL AND CSAT ARE AFTER THE FACT:MOST CENTERS COMBINE REAL-TIME QM WITH EVAL OF RECORDED INTERACTIONS….WE CAN GAIN EVEN MORE POTENTIAL VALUE FROM QM EFFORTS WITH AID OF TECHOLOGY SUCH AS SPEECH ANALYTICS - THAT COMBINES ANALYIS OF EXPECTATIONS FOR AGENT BEHAVIORS (CONVERTED INTO KEYWORDS AND PHRASES WE EXPECT AGENTS TO SAY) ALONG WITH WHAT KEY WORDS/PHRASES THAT CUSTOMERS SAY THAT GIVE US INSIGHT. REAL TIME SPEECH ANALYTICS PROVIDE THE ABILTIY TO ID THOSE CALLS, CHATS – THAT REQUIRE IMMEDIATE INTERVENTION… AND THE OPP TO SAVE A POTENTIALLY BAD CUSTOMER EXPERIENCE OR AGENT LACK OF COMPLIANCE.RT SA PRODUCTS THEN TAKE THE KW /PHRASES IDENTIFIED ON THE CALL – AND STORE THEM WITH THE RECORDING – ADDING EVEN MORE ABILITY TO GAIN MORE VALUE AND ACTIONABLE INSIGHTS FROM YOUR QM EFFORTS