Download to read offline

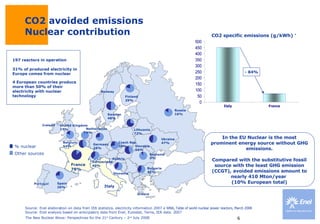
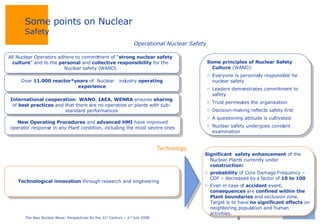
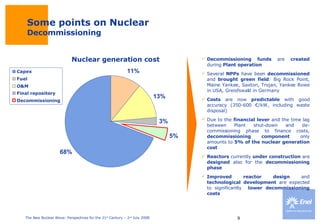
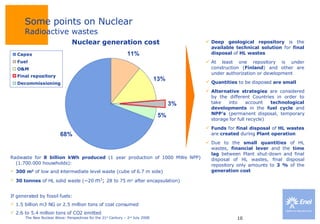

The document discusses several topics related to nuclear energy including: 1) Nuclear energy is a prominent energy source in Europe, accounting for 31% of produced electricity, and has very low greenhouse gas emissions compared to fossil fuels. 2) Safety procedures and international cooperation have improved nuclear safety significantly, with the probability of core damage decreased by a factor of 10 to 100. 3) Funds set aside during plant operation can cover decommissioning costs, which amount to only 5% of the total generation costs due to technological and financial factors.