SlideShare a Scribd company logo
1 of 6
Download to read offline
Comparative study of porosity variations-AGeostatistical approach
Name: Vanecha Chirag Nareshbhai
Roll no.: 16BPE137
Course: Geostatistics (PEU501)
Mentor: Dr. Jwngsar Brahma
%Depth %Well 1 %Well2 %Well3
0.00 24.80 45.01 3.50
0.50 22.40 48.69 0.96
1.00 19.80 49.93 1.28
1.50 27.80 45.17 0.89
2.00 25.80 43.77 0.49
2.50 23.00 48.59 0.52
3.00 34.40 39.38 0.80
3.50 29.60 42.26 1.33
4.00 30.80 32.40 1.19
4.50 35.80 33.53 1.18
5.00 40.40 31.74 1.77
5.50 40.00 32.68 1.32
6.00 15.20 32.56 1.69
6.50 17.60 49.98 2.18
7.00 24.20 45.83 2.90
7.50 19.40 4.69 3.30
8.00 35.30 33.95 2.11
8.50 31.40 39.92 2.00
9.00 28.21 32.52 1.99
9.50 34.00 39.02 2.11
10.00 34.40 39.02 1.87
10.50 22.80 43.45 2.29
11.00 26.60 42.58 3.91
11.50 32.40 38.72 3.34
12.00 27.40 42.92 4.34
12.50 25.80 43.89 3.20
13.00 31.40 38.13 3.74
13.50 26.80 42.92 3.04
14.00 24.40 46.13 1.68
14.50 25.60 44.85 2.42
15.00 23.80 44.85 3.33
15.50 21.60 47.41 2.17
16.00 27.60 44.53 3.22
16.50 19.80 48.05 2.70
17.00 27.80 44.21 2.76
17.50 21.20 48.70 2.11
18.00 19.00 49.34 2.34
18.50 28.60 44.21 1.23
19.00 24.80 45.49 2.14
19.50 23.40 46.99 1.59
20.00 17.80 49.66 2.72
20.50 24.60 45.49 1.86
21.00 21.40 48.03 2.32
21.50 24.00 45.49 2.30
22.00 26.00 44.05 2.34
22.50 19.00 49.02 2.95
23.00 24.00 32.34 2.75
23.50 15.60 41.90 2.04
24.00 19.20 47.11 4.63
24.50 17.80 48.70 3.07
25.00 21.20 46.77 3.07
25.50 30.00 49.39 4.10
26.00 23.60 45.01 4.17
26.50 25.20 42.62 5.21
27.00 17.20 50.20 3.25
27.50 20.60 48.03 4.73
28.00 25.00 43.23 5.34
28.50 18.00 56.80 4.55
29.00 25.00 44.20 3.54
29.50 21.40 46.70 3.99
Well-1 Well-2 Well-3
Mean 27.3560 29.8269 2.8296
Standard deviation 7.7662 16.0594 1.4947
Increment (l) 1.7366 3.5910 0.3342
N=length 60 60 60
Range=max-min 25.2 52.11 4.85
Figure 1: comparison of p.d.f., c.d.f. and normalized distribution for Well (1), (2) & (3)
Figures show correlations between the porosity data of three wells. There is negative correlation between
well (1) & (2) with correlation coefficient rxy -0.4050. When porosity in well (1) increases, at the same time
it reduces in well (2). It indicates if well 1 has porous rock layers, then at the same point well 2 will have
less porous formation. Correlation between well (2) & (3) is positive and correlation coefficient ryz 0.1401.
Porosity in well (3) increases with increase in well (2). But well 3 has comparative less porosity <5% than of
well 2 and low coefficient shows positively poorly correlation more scattered data. Well (3) & (1) has weak
negative correlation with correlation coefficient rzx -0.2530.
Figure 2: Positive/negative correlation for porosity data of Well (1), (2) & (3)
Mean Median Max Skewness
Well 1 -0.4582 -0.4415 0.0305 Negatively
Skewed
Well 2 0.1647 0.1437 0.5421 Positively
Skewed
Well 3 -0.2522 -0.2488 0.0991 Negatively
Skewed
Outliers are the reasons for low correlation coefficient. Removing outliers improves correlation coefficient.
Bootstrap resamples the data and finds the value of correlation coefficient every time. Mean of those
correlation coefficients is taken as rfinal and compared with the initial one. And that shows how much
scattered our data are. Final-Initial/initial gives % of scattered data
Well 1: 13.13%
Well 2: 17.55%
Well 3: 0.316%
Figure 3: Histograms for Bootstrap correlations between Well (1), (2) & (3)
Table 1: Comparison of expected porosity probability between well (1), (2) & (3)
Porosity range p(well 1) p(well 2) p(well 3)
<5% 0.0012 0.0292 0.8971
5-25% 0.3801 0.3215 0.0735
25-40% 0.5663 0.3536 0
40-60% 0.0516 0.2342 0
Porosity range p(0-10 meters) p(10-20 meters) p(20-30 meters)
<5% 0.0022 0 0
5-25% 0.3679 0.5438 0.7257
25-40% 0.5612 0.4557 0.2703
40-60% 0.0681 0 0
Porosity range p(0-10 meters) p(10-20 meters) p(20-30 meters)
<5% 0.0339 0 0
5-25% 0.3736 0 0.0066
25-40% 0.3647 0.4602 0.3019
40-60% 0.1817 0.5398 0.6757
Porosity range p(0-10 meters) p(10-20 meters) p(20-30 meters)
<5% 0.9772 0.9907 0.9207
5-25% 0.0011 0.0068 0.0793
25-40% 0 0 0
40-60% 0 0 0
Table 2(a): Comparison of expected porosity probability for Well 1 with depth
Table 2(b): Comparison of expected porosity probability for Well 2 with depth
Table 2(c): Comparison of expected porosity probability for Well 3 with depth
Table 2(a) shows variations in porosities with depth for well 1. It is clearly seen that there is 56% probability
for porosity range 25-40% which indicates the presence of porous formation may be of sandstone, limestone
with loosely consolidated grains. With increase in depth, there is a trend towards decrease in porosity. For 10-
20 meters, there is 54% probability for the range 5-25% whereas it is 72% probability for 20-30 meters.
Increase in depth increases overburden weight causes reduction in porosity which can be inferred from the
table. This porosity reduction may be due to poorly sorted grains.
Table 2(b) shows variations in porosities with depth for well 2. It seems that porosity is equally distributed for
depth 0-10 meters because there is almost same probability for porosity range 5-25% and 25-40% with 18%
probability for range 40-60%. Rocks with less porosity can act as cap rocks for reservoir rocks of 25-60%
porosity. With depth increases, there is tend towards increase in porosity. It indicates carbonate formation
with channels or with high vuggy porosity due to interaction with acidic solution.
Table 2(c) shows variations in porosities with depth for well 3. Rocks are having very low porosity throughout
the whole depth. Absence of highly porous rocks since there is 0% probability of high porosity. Formation
may comprise thick Igneous formation or metamorphic rocks with fractures or Extremely poorly sorted
sandstone which deposited under turbidity depositional environment.
A petroleum reservoir or oil and gas reservoir is a subsurface pool of hydrocarbons contained in porous or
fractured rock formations. Porosity varies with different rocks. For carbonate it is 5%-25%, 10%-40% for
sandstone & shale, around 2% for Igneous and metamorphic fractured rocks. It is always desirable to have
high porosity for commercially viable hydrocarbons accumulations. Table 1 compares probability of
different porosity ranges for three wells. Porosity reduces with depth in well 1, increases in well 2, and very
low porosity in well 3 which concludes reservoir heterogeneity or the given well data may be of different
reservoir.

More Related Content

Recently uploaded

FULL ENJOY Call Girls In Mahipalpur Delhi Contact Us 8377877756
FULL ENJOY Call Girls In Mahipalpur Delhi Contact Us 8377877756FULL ENJOY Call Girls In Mahipalpur Delhi Contact Us 8377877756
FULL ENJOY Call Girls In Mahipalpur Delhi Contact Us 8377877756
dollysharma2066
 
VIP Call Girls Palanpur 7001035870 Whatsapp Number, 24/07 Booking
VIP Call Girls Palanpur 7001035870 Whatsapp Number, 24/07 BookingVIP Call Girls Palanpur 7001035870 Whatsapp Number, 24/07 Booking
VIP Call Girls Palanpur 7001035870 Whatsapp Number, 24/07 Booking
dharasingh5698
 
Call Girls in Ramesh Nagar Delhi 💯 Call Us 🔝9953056974 🔝 Escort Service
Call Girls in Ramesh Nagar Delhi 💯 Call Us 🔝9953056974 🔝 Escort ServiceCall Girls in Ramesh Nagar Delhi 💯 Call Us 🔝9953056974 🔝 Escort Service
Call Girls in Ramesh Nagar Delhi 💯 Call Us 🔝9953056974 🔝 Escort Service
9953056974 Low Rate Call Girls In Saket, Delhi NCR
 
Call Girls In Bangalore ☎ 7737669865 🥵 Book Your One night Stand
Call Girls In Bangalore ☎ 7737669865 🥵 Book Your One night StandCall Girls In Bangalore ☎ 7737669865 🥵 Book Your One night Stand
Call Girls In Bangalore ☎ 7737669865 🥵 Book Your One night Stand
amitlee9823
 

Recently uploaded (20)

(INDIRA) Call Girl Aurangabad Call Now 8617697112 Aurangabad Escorts 24x7
(INDIRA) Call Girl Aurangabad Call Now 8617697112 Aurangabad Escorts 24x7(INDIRA) Call Girl Aurangabad Call Now 8617697112 Aurangabad Escorts 24x7
(INDIRA) Call Girl Aurangabad Call Now 8617697112 Aurangabad Escorts 24x7
 
DC MACHINE-Motoring and generation, Armature circuit equation
DC MACHINE-Motoring and generation, Armature circuit equationDC MACHINE-Motoring and generation, Armature circuit equation
DC MACHINE-Motoring and generation, Armature circuit equation
 
FULL ENJOY Call Girls In Mahipalpur Delhi Contact Us 8377877756
FULL ENJOY Call Girls In Mahipalpur Delhi Contact Us 8377877756FULL ENJOY Call Girls In Mahipalpur Delhi Contact Us 8377877756
FULL ENJOY Call Girls In Mahipalpur Delhi Contact Us 8377877756
 
UNIT - IV - Air Compressors and its Performance
UNIT - IV - Air Compressors and its PerformanceUNIT - IV - Air Compressors and its Performance
UNIT - IV - Air Compressors and its Performance
 
Unleashing the Power of the SORA AI lastest leap
Unleashing the Power of the SORA AI lastest leapUnleashing the Power of the SORA AI lastest leap
Unleashing the Power of the SORA AI lastest leap
 
Block diagram reduction techniques in control systems.ppt
Block diagram reduction techniques in control systems.pptBlock diagram reduction techniques in control systems.ppt
Block diagram reduction techniques in control systems.ppt
 
Introduction to Serverless with AWS Lambda
Introduction to Serverless with AWS LambdaIntroduction to Serverless with AWS Lambda
Introduction to Serverless with AWS Lambda
 
Hazard Identification (HAZID) vs. Hazard and Operability (HAZOP): A Comparati...
Hazard Identification (HAZID) vs. Hazard and Operability (HAZOP): A Comparati...Hazard Identification (HAZID) vs. Hazard and Operability (HAZOP): A Comparati...
Hazard Identification (HAZID) vs. Hazard and Operability (HAZOP): A Comparati...
 
Unit 2- Effective stress & Permeability.pdf
Unit 2- Effective stress & Permeability.pdfUnit 2- Effective stress & Permeability.pdf
Unit 2- Effective stress & Permeability.pdf
 
VIP Call Girls Palanpur 7001035870 Whatsapp Number, 24/07 Booking
VIP Call Girls Palanpur 7001035870 Whatsapp Number, 24/07 BookingVIP Call Girls Palanpur 7001035870 Whatsapp Number, 24/07 Booking
VIP Call Girls Palanpur 7001035870 Whatsapp Number, 24/07 Booking
 
Design For Accessibility: Getting it right from the start
Design For Accessibility: Getting it right from the startDesign For Accessibility: Getting it right from the start
Design For Accessibility: Getting it right from the start
 
Call Girls in Ramesh Nagar Delhi 💯 Call Us 🔝9953056974 🔝 Escort Service
Call Girls in Ramesh Nagar Delhi 💯 Call Us 🔝9953056974 🔝 Escort ServiceCall Girls in Ramesh Nagar Delhi 💯 Call Us 🔝9953056974 🔝 Escort Service
Call Girls in Ramesh Nagar Delhi 💯 Call Us 🔝9953056974 🔝 Escort Service
 
A Study of Urban Area Plan for Pabna Municipality
A Study of Urban Area Plan for Pabna MunicipalityA Study of Urban Area Plan for Pabna Municipality
A Study of Urban Area Plan for Pabna Municipality
 
Navigating Complexity: The Role of Trusted Partners and VIAS3D in Dassault Sy...
Navigating Complexity: The Role of Trusted Partners and VIAS3D in Dassault Sy...Navigating Complexity: The Role of Trusted Partners and VIAS3D in Dassault Sy...
Navigating Complexity: The Role of Trusted Partners and VIAS3D in Dassault Sy...
 
Water Industry Process Automation & Control Monthly - April 2024
Water Industry Process Automation & Control Monthly - April 2024Water Industry Process Automation & Control Monthly - April 2024
Water Industry Process Automation & Control Monthly - April 2024
 
Generative AI or GenAI technology based PPT
Generative AI or GenAI technology based PPTGenerative AI or GenAI technology based PPT
Generative AI or GenAI technology based PPT
 
Unit 1 - Soil Classification and Compaction.pdf
Unit 1 - Soil Classification and Compaction.pdfUnit 1 - Soil Classification and Compaction.pdf
Unit 1 - Soil Classification and Compaction.pdf
 
FEA Based Level 3 Assessment of Deformed Tanks with Fluid Induced Loads
FEA Based Level 3 Assessment of Deformed Tanks with Fluid Induced LoadsFEA Based Level 3 Assessment of Deformed Tanks with Fluid Induced Loads
FEA Based Level 3 Assessment of Deformed Tanks with Fluid Induced Loads
 
Thermal Engineering Unit - I & II . ppt
Thermal Engineering  Unit - I & II . pptThermal Engineering  Unit - I & II . ppt
Thermal Engineering Unit - I & II . ppt
 
Call Girls In Bangalore ☎ 7737669865 🥵 Book Your One night Stand
Call Girls In Bangalore ☎ 7737669865 🥵 Book Your One night StandCall Girls In Bangalore ☎ 7737669865 🥵 Book Your One night Stand
Call Girls In Bangalore ☎ 7737669865 🥵 Book Your One night Stand
 

Featured

How Race, Age and Gender Shape Attitudes Towards Mental Health
How Race, Age and Gender Shape Attitudes Towards Mental HealthHow Race, Age and Gender Shape Attitudes Towards Mental Health
How Race, Age and Gender Shape Attitudes Towards Mental Health
ThinkNow
 
Social Media Marketing Trends 2024 // The Global Indie Insights
Social Media Marketing Trends 2024 // The Global Indie InsightsSocial Media Marketing Trends 2024 // The Global Indie Insights
Social Media Marketing Trends 2024 // The Global Indie Insights
Kurio // The Social Media Age(ncy)
 

Featured (20)

How Race, Age and Gender Shape Attitudes Towards Mental Health
How Race, Age and Gender Shape Attitudes Towards Mental HealthHow Race, Age and Gender Shape Attitudes Towards Mental Health
How Race, Age and Gender Shape Attitudes Towards Mental Health
 
AI Trends in Creative Operations 2024 by Artwork Flow.pdf
AI Trends in Creative Operations 2024 by Artwork Flow.pdfAI Trends in Creative Operations 2024 by Artwork Flow.pdf
AI Trends in Creative Operations 2024 by Artwork Flow.pdf
 
Skeleton Culture Code
Skeleton Culture CodeSkeleton Culture Code
Skeleton Culture Code
 
PEPSICO Presentation to CAGNY Conference Feb 2024
PEPSICO Presentation to CAGNY Conference Feb 2024PEPSICO Presentation to CAGNY Conference Feb 2024
PEPSICO Presentation to CAGNY Conference Feb 2024
 
Content Methodology: A Best Practices Report (Webinar)
Content Methodology: A Best Practices Report (Webinar)Content Methodology: A Best Practices Report (Webinar)
Content Methodology: A Best Practices Report (Webinar)
 
How to Prepare For a Successful Job Search for 2024
How to Prepare For a Successful Job Search for 2024How to Prepare For a Successful Job Search for 2024
How to Prepare For a Successful Job Search for 2024
 
Social Media Marketing Trends 2024 // The Global Indie Insights
Social Media Marketing Trends 2024 // The Global Indie InsightsSocial Media Marketing Trends 2024 // The Global Indie Insights
Social Media Marketing Trends 2024 // The Global Indie Insights
 
Trends In Paid Search: Navigating The Digital Landscape In 2024
Trends In Paid Search: Navigating The Digital Landscape In 2024Trends In Paid Search: Navigating The Digital Landscape In 2024
Trends In Paid Search: Navigating The Digital Landscape In 2024
 
5 Public speaking tips from TED - Visualized summary
5 Public speaking tips from TED - Visualized summary5 Public speaking tips from TED - Visualized summary
5 Public speaking tips from TED - Visualized summary
 
ChatGPT and the Future of Work - Clark Boyd
ChatGPT and the Future of Work - Clark Boyd ChatGPT and the Future of Work - Clark Boyd
ChatGPT and the Future of Work - Clark Boyd
 
Getting into the tech field. what next
Getting into the tech field. what next Getting into the tech field. what next
Getting into the tech field. what next
 
Google's Just Not That Into You: Understanding Core Updates & Search Intent
Google's Just Not That Into You: Understanding Core Updates & Search IntentGoogle's Just Not That Into You: Understanding Core Updates & Search Intent
Google's Just Not That Into You: Understanding Core Updates & Search Intent
 
How to have difficult conversations
How to have difficult conversations How to have difficult conversations
How to have difficult conversations
 
Introduction to Data Science
Introduction to Data ScienceIntroduction to Data Science
Introduction to Data Science
 
Time Management & Productivity - Best Practices
Time Management & Productivity -  Best PracticesTime Management & Productivity -  Best Practices
Time Management & Productivity - Best Practices
 
The six step guide to practical project management
The six step guide to practical project managementThe six step guide to practical project management
The six step guide to practical project management
 
Beginners Guide to TikTok for Search - Rachel Pearson - We are Tilt __ Bright...
Beginners Guide to TikTok for Search - Rachel Pearson - We are Tilt __ Bright...Beginners Guide to TikTok for Search - Rachel Pearson - We are Tilt __ Bright...
Beginners Guide to TikTok for Search - Rachel Pearson - We are Tilt __ Bright...
 
Unlocking the Power of ChatGPT and AI in Testing - A Real-World Look, present...
Unlocking the Power of ChatGPT and AI in Testing - A Real-World Look, present...Unlocking the Power of ChatGPT and AI in Testing - A Real-World Look, present...
Unlocking the Power of ChatGPT and AI in Testing - A Real-World Look, present...
 
12 Ways to Increase Your Influence at Work
12 Ways to Increase Your Influence at Work12 Ways to Increase Your Influence at Work
12 Ways to Increase Your Influence at Work
 
ChatGPT webinar slides
ChatGPT webinar slidesChatGPT webinar slides
ChatGPT webinar slides
 

Geostatistics Data interpretation from Graphs

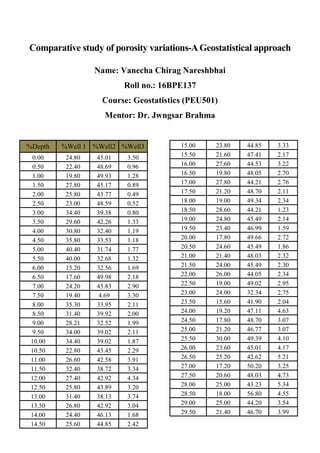
  • 1. Comparative study of porosity variations-AGeostatistical approach Name: Vanecha Chirag Nareshbhai Roll no.: 16BPE137 Course: Geostatistics (PEU501) Mentor: Dr. Jwngsar Brahma %Depth %Well 1 %Well2 %Well3 0.00 24.80 45.01 3.50 0.50 22.40 48.69 0.96 1.00 19.80 49.93 1.28 1.50 27.80 45.17 0.89 2.00 25.80 43.77 0.49 2.50 23.00 48.59 0.52 3.00 34.40 39.38 0.80 3.50 29.60 42.26 1.33 4.00 30.80 32.40 1.19 4.50 35.80 33.53 1.18 5.00 40.40 31.74 1.77 5.50 40.00 32.68 1.32 6.00 15.20 32.56 1.69 6.50 17.60 49.98 2.18 7.00 24.20 45.83 2.90 7.50 19.40 4.69 3.30 8.00 35.30 33.95 2.11 8.50 31.40 39.92 2.00 9.00 28.21 32.52 1.99 9.50 34.00 39.02 2.11 10.00 34.40 39.02 1.87 10.50 22.80 43.45 2.29 11.00 26.60 42.58 3.91 11.50 32.40 38.72 3.34 12.00 27.40 42.92 4.34 12.50 25.80 43.89 3.20 13.00 31.40 38.13 3.74 13.50 26.80 42.92 3.04 14.00 24.40 46.13 1.68 14.50 25.60 44.85 2.42 15.00 23.80 44.85 3.33 15.50 21.60 47.41 2.17 16.00 27.60 44.53 3.22 16.50 19.80 48.05 2.70 17.00 27.80 44.21 2.76 17.50 21.20 48.70 2.11 18.00 19.00 49.34 2.34 18.50 28.60 44.21 1.23 19.00 24.80 45.49 2.14 19.50 23.40 46.99 1.59 20.00 17.80 49.66 2.72 20.50 24.60 45.49 1.86 21.00 21.40 48.03 2.32 21.50 24.00 45.49 2.30 22.00 26.00 44.05 2.34 22.50 19.00 49.02 2.95 23.00 24.00 32.34 2.75 23.50 15.60 41.90 2.04 24.00 19.20 47.11 4.63 24.50 17.80 48.70 3.07 25.00 21.20 46.77 3.07 25.50 30.00 49.39 4.10 26.00 23.60 45.01 4.17 26.50 25.20 42.62 5.21 27.00 17.20 50.20 3.25 27.50 20.60 48.03 4.73 28.00 25.00 43.23 5.34 28.50 18.00 56.80 4.55 29.00 25.00 44.20 3.54 29.50 21.40 46.70 3.99
  • 2. Well-1 Well-2 Well-3 Mean 27.3560 29.8269 2.8296 Standard deviation 7.7662 16.0594 1.4947 Increment (l) 1.7366 3.5910 0.3342 N=length 60 60 60 Range=max-min 25.2 52.11 4.85 Figure 1: comparison of p.d.f., c.d.f. and normalized distribution for Well (1), (2) & (3)
  • 3. Figures show correlations between the porosity data of three wells. There is negative correlation between well (1) & (2) with correlation coefficient rxy -0.4050. When porosity in well (1) increases, at the same time it reduces in well (2). It indicates if well 1 has porous rock layers, then at the same point well 2 will have less porous formation. Correlation between well (2) & (3) is positive and correlation coefficient ryz 0.1401. Porosity in well (3) increases with increase in well (2). But well 3 has comparative less porosity <5% than of well 2 and low coefficient shows positively poorly correlation more scattered data. Well (3) & (1) has weak negative correlation with correlation coefficient rzx -0.2530. Figure 2: Positive/negative correlation for porosity data of Well (1), (2) & (3)
  • 4. Mean Median Max Skewness Well 1 -0.4582 -0.4415 0.0305 Negatively Skewed Well 2 0.1647 0.1437 0.5421 Positively Skewed Well 3 -0.2522 -0.2488 0.0991 Negatively Skewed Outliers are the reasons for low correlation coefficient. Removing outliers improves correlation coefficient. Bootstrap resamples the data and finds the value of correlation coefficient every time. Mean of those correlation coefficients is taken as rfinal and compared with the initial one. And that shows how much scattered our data are. Final-Initial/initial gives % of scattered data Well 1: 13.13% Well 2: 17.55% Well 3: 0.316% Figure 3: Histograms for Bootstrap correlations between Well (1), (2) & (3)
  • 5. Table 1: Comparison of expected porosity probability between well (1), (2) & (3) Porosity range p(well 1) p(well 2) p(well 3) <5% 0.0012 0.0292 0.8971 5-25% 0.3801 0.3215 0.0735 25-40% 0.5663 0.3536 0 40-60% 0.0516 0.2342 0 Porosity range p(0-10 meters) p(10-20 meters) p(20-30 meters) <5% 0.0022 0 0 5-25% 0.3679 0.5438 0.7257 25-40% 0.5612 0.4557 0.2703 40-60% 0.0681 0 0 Porosity range p(0-10 meters) p(10-20 meters) p(20-30 meters) <5% 0.0339 0 0 5-25% 0.3736 0 0.0066 25-40% 0.3647 0.4602 0.3019 40-60% 0.1817 0.5398 0.6757 Porosity range p(0-10 meters) p(10-20 meters) p(20-30 meters) <5% 0.9772 0.9907 0.9207 5-25% 0.0011 0.0068 0.0793 25-40% 0 0 0 40-60% 0 0 0 Table 2(a): Comparison of expected porosity probability for Well 1 with depth Table 2(b): Comparison of expected porosity probability for Well 2 with depth Table 2(c): Comparison of expected porosity probability for Well 3 with depth
  • 6. Table 2(a) shows variations in porosities with depth for well 1. It is clearly seen that there is 56% probability for porosity range 25-40% which indicates the presence of porous formation may be of sandstone, limestone with loosely consolidated grains. With increase in depth, there is a trend towards decrease in porosity. For 10- 20 meters, there is 54% probability for the range 5-25% whereas it is 72% probability for 20-30 meters. Increase in depth increases overburden weight causes reduction in porosity which can be inferred from the table. This porosity reduction may be due to poorly sorted grains. Table 2(b) shows variations in porosities with depth for well 2. It seems that porosity is equally distributed for depth 0-10 meters because there is almost same probability for porosity range 5-25% and 25-40% with 18% probability for range 40-60%. Rocks with less porosity can act as cap rocks for reservoir rocks of 25-60% porosity. With depth increases, there is tend towards increase in porosity. It indicates carbonate formation with channels or with high vuggy porosity due to interaction with acidic solution. Table 2(c) shows variations in porosities with depth for well 3. Rocks are having very low porosity throughout the whole depth. Absence of highly porous rocks since there is 0% probability of high porosity. Formation may comprise thick Igneous formation or metamorphic rocks with fractures or Extremely poorly sorted sandstone which deposited under turbidity depositional environment. A petroleum reservoir or oil and gas reservoir is a subsurface pool of hydrocarbons contained in porous or fractured rock formations. Porosity varies with different rocks. For carbonate it is 5%-25%, 10%-40% for sandstone & shale, around 2% for Igneous and metamorphic fractured rocks. It is always desirable to have high porosity for commercially viable hydrocarbons accumulations. Table 1 compares probability of different porosity ranges for three wells. Porosity reduces with depth in well 1, increases in well 2, and very low porosity in well 3 which concludes reservoir heterogeneity or the given well data may be of different reservoir.