Download to read offline
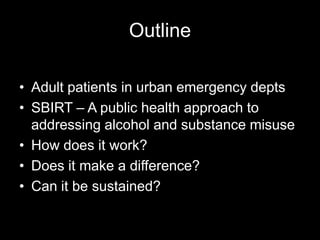
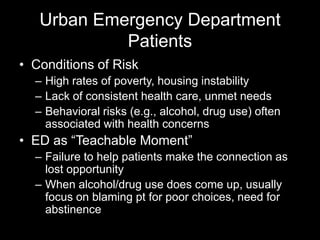
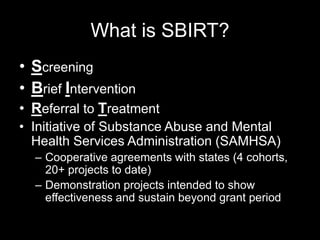

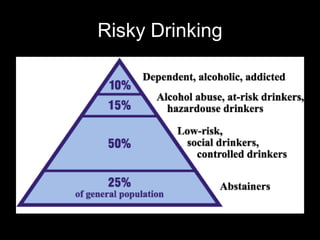

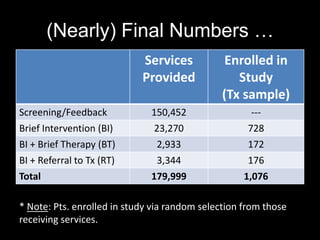
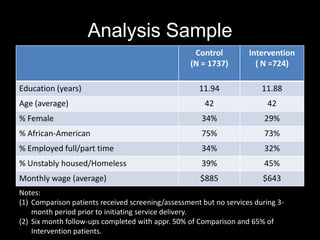
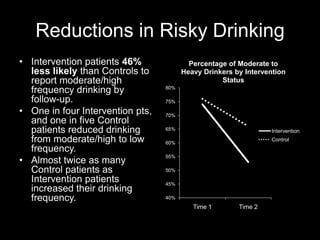
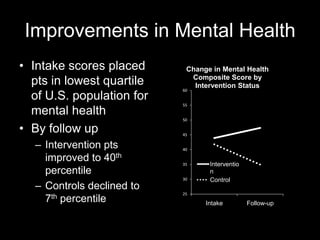
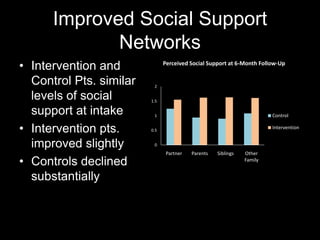
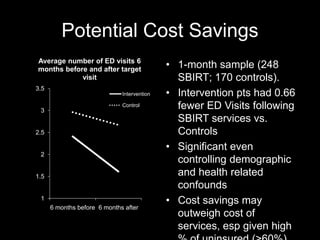


The document evaluates five years of intervention focusing on risky drinking and substance use among patients in urban emergency departments using the SBIRT model, which includes screening, brief intervention, and referral to treatment. Results indicate that intervention patients had a significant reduction in risky drinking behaviors and improvements in mental health and social support compared to control patients. SBIRT services show promise in linking patients to necessary care while potentially reducing emergency department visits and healthcare costs.


