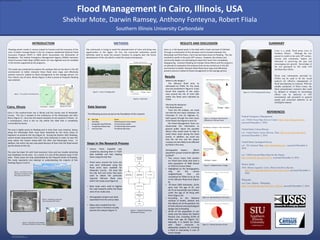
Flooding is a serious issue for Cairo, Illinois due to its low elevation at the confluence of the Mississippi and Ohio Rivers. This study uses GIS to analyze flood risk for Cairo based on FEMA flood zone data. Most of the urban area around Cairo falls within the 100-year flood zone. Key transportation infrastructure like roads and railways pass through flood-prone areas, requiring evacuation planning. The analysis found over 2,900 people live in high-risk census tracts, including many elderly residents and families with children who are vulnerable. A third of residents live below the poverty line, limiting ability to prepare for floods. The GIS maps and data can help authorities better manage flood risks and plan emergency responses.
Combating Land Grabbing and Empowering Local Communities through Participator...Dr. Juscar Ndjounguep
Participatory mapping is the bottom-top approach that enables communities to create maps for all that will benefit the local population either directly or indirectly (Haklay, 2013).
Combating Land Grabbing and Empowering Local Communities through Participator...Dr. Juscar Ndjounguep
Participatory mapping is the bottom-top approach that enables communities to create maps for all that will benefit the local population either directly or indirectly (Haklay, 2013).
Role of Geologists in Natural Hazard Mapping and Application_Dr Kyi Khin_MGSS...KYI KHIN
Every year, natural hazard events threaten lives and livelihoods, resulting in deaths and billions of dollars in damage. Many geoscientists and various institutions are working with many partners to monitor, assess, and conduct targeted research on a wide range of natural hazards so that policymakers and the public have the understanding to enhance preparedness, response and resilience. For planning and risk assessment to tackle the Natural Hazards for public awareness, alarming and evacuation, Hazard Maps are essentially needed for institutions and governmental working committees of Natural Disaster Prevention, in future.
The use of satellite imagery for improvement of disaster risk management, focusing on tsunami and earthquake. Major cases of Indian Ocean Tsunami, Central Java Earthquake and Japan Tsunami are selected as practical example for remote sensing analysis.
The International Journal of Engineering & Science is aimed at providing a platform for researchers, engineers, scientists, or educators to publish their original research results, to exchange new ideas, to disseminate information in innovative designs, engineering experiences and technological skills. It is also the Journal's objective to promote engineering and technology education. All papers submitted to the Journal will be blind peer-reviewed. Only original articles will be published.
The papers for publication in The International Journal of Engineering& Science are selected through rigorous peer reviews to ensure originality, timeliness, relevance, and readability.
APPLICATIONS OF REMOTE SENSING AND GIS TECHNOLOGIES IN FLOOD RISK MANAGEMENTrsmahabir
Flooding is the most common of all major disasters that regularly affect populations and results in extensive damage to property, infrastructure, natural resources, and even to loss of life. To ensure better outcomes, planning and execution of flood management projects must utilize knowledge on a wide range of factors, most of which are of a spatial nature. Advances in geospatial technologies, specifically remote sensing and Geographic Information Systems (GIS), have enabled the acquisition and analysis of data about the Earth's surface for flood mitigation projects in a faster, more efficient and more accurate manner.
Remote sensing and GIS have emerged as powerful tools to deal with various aspects of flood management in prevention, preparedness and relief management of flood disaster. GIS facilitates integration of spatial and non-spatial data such as rainfall and stream flows, river cross sections and profiles, and river basin characteristics, as well as other information such as historical flood maps, infrastructures, land use, and social and economic data. Such data sets are critical for the in-depth analysis and management of floods.
Remote sensing technologies have great potential in overcoming the information void in the Caribbean region. The observation, mapping, and representation of Earth’s surface have provided effective and timely information for monitoring floods and their effect. The potential of new air- and space-borne imaging technologies for improving hazard evaluation and risk reduction is continually being explored. They are relatively inexpensive and have the ability to provide information on several parameters that are crucial to flood mapping and monitoring.
GIS is an essential technology for all phases of emergency management preparation, mitigation, response, and recovery. Find out how GIS provides a foundation for comprehensive emergency management .
To prepare for and mitigate emergencies, GIS can map and model potential disasters to help visualize critical vulnerabilities and damage consequences. As rebuilding begins, GIS aids local, state, and federal agencies with technology that supports collaboration between multiple agencies.
Field data captured with mobile GIS provides the ability to add updates from remote locations for more efficient incident management. It also supplies rapid damage assessment and more accurate recovery operations.
Natural capital accounting presentation at the xbrl euro filing 2017 presente...Workiva
The green gross domestic product (green GDP or GGDP) is an index of economic growth with the environmental consequences of that growth factored into a country's conventional GDP. Green GDP monetizes the loss of biodiversity, and accounts for costs caused by climate change.
Lesson 4. Community Based Hazard and Evacuation Mappinggicait ait
Community-based hazard and evacuation maps are created by analysing field observation data taken during town watching.
These maps are created by the community with the assistance of DRM specialists
The maps help communities better understand their disaster risks, allow them to make targeted actions to reduce their risk and inform the community of safe spaces and evacuation routes to be used during a specific disaster.
A visual analytics approach to understanding poverty assessment through disas...UN Global Pulse
Executive summary of the United Nations Office for Outer Space Affairs research: “A Visual Approach to Understanding Poverty Assessment through Disaster Impacts in Latin America and Africa,” conducted as part of UN Global Pulse’s Rapid Impact and Vulnerability Assessment Fund (RIVAF). For more information: http://www.unglobalpulse.org/projects/rapid-impact-and-vulnerability-analysis-fund-rivaf
From drones to old-fashioned phone calls, data come from many unlikely sources. In a disaster, such as a flood or earthquake, responders will take whatever information they can get to visualise the crisis and best direct their resources. Increasingly, cities prone to natural disasters are learning to better aid their citizens by empowering their local agencies and responders with sophisticated tools to cut through the large volume and velocity of disaster-related data and synthesise actionable information.
261
Megaregion Planning
and High-Speed Rail
Petra Todorovich
c h a p t e r 2 4
?
On April 16, 2009, President Obama stood before an audience at the Eisenhower
Executive Office Building and made an announcement that signaled a new era of
passenger rail in the United States. Months before, the American Recovery and
Reinvestment Act (ARRA) had provided $8 billion for a new program at the
Federal Railroad Administration (FRA) to issue competitive grants to states to
make capital investments in high-speed and conventional passenger rail. Little did
the president know that providing the single largest boost for intercity rail plan-
ning in this country in a generation had also motivated a sudden and giant leap for-
ward in planning and governing megaregions. Luckily, regional planners had been
studying emerging megaregions for the previous five years, in affiliation with the
New York–based Regional Plan Association’s (RPA) America 2050 program. Again
and again, the planners had identified high-speed rail as the key transportation
investment to serve megaregion economies. But high-speed rail was a distant
dream. That all changed with the passage of ARRA at the nadir of the Great
Recession. Now a federal program exists to support high-speed rail planning
and implementation. Making that program a success will largely depend on the
ability of multiple actors at the local, regional, state, and binational levels to come
together as megaregions to coordinate and leverage federal rail investments.
Revisiting Megalopolis: RPA Resurrects
the Megaregion Idea
As if planning for the Tri-State New York metropolitan region was not sufficiently
complicated, in 2005 the Regional Plan Association launched a national program
called America 2050 that focused on the emergence of a new urban scale: the
megaregion. This was not actually a new concept for RPA. In 1967 a volume of the
Second Regional Plan documented the emergence of “The Atlantic Urban Region,”
an urban chain stretching 460 miles from Maine to Virginia (Regional Plan
C
o
p
y
r
i
g
h
t
2
0
1
1
.
R
u
t
g
e
r
s
U
n
i
v
e
r
s
i
t
y
P
r
e
s
s
.
A
l
l
r
i
g
h
t
s
r
e
s
e
r
v
e
d
.
M
a
y
n
o
t
b
e
r
e
p
r
o
d
u
c
e
d
i
n
a
n
y
f
o
r
m
w
i
t
h
o
u
t
p
e
r
m
i
s
s
i
o
n
f
r
o
m
t
h
e
p
u
b
l
i
s
h
e
r
,
e
x
c
e
p
t
f
a
i
r
u
s
e
s
p
e
r
m
i
t
t
e
d
u
n
d
e
r
U
.
S
.
o
r
a
p
p
l
i
c
a
b
l
e
c
o
p
y
r
i
g
h
t
l
a
w
.
EBSCO Publishing : eBook Academic Collection (EBSCOhost) - printed on 5/8/2020 3:56 AM via SAN JOSE STATE UNIV
AN: 435124 ; Montgomery, Carleton.; Regional Planning for a Sustainable America : How Creative Programs Are Promoting Prosperity and Saving the Environment
Account: s7380033.main.cmmc
Association 1967). Earlier that decade, French geographer Jean Gottmann had
coined the term “Megalopolis” to describe the same region in his 1961 book,
Megalopolis: The Urbanized Northeastern Seaboard of the United States (Gottmann
1961). The .
ADAM PARRISHowHurricane SandyTamed tneBureaucracy.docxcoubroughcosta
ADAM PARRIS
How
Hurricane Sandy
Tamed tne
Bureaucracy
A practical story of
making science useful for society,
with lessons destined to
grow in importance.
R
emember Hurricane Irene? It pushed across New
England in August 2011, leaving a trail of at least
45 deaths and $7 million in damages. But just
over a year later, even before the last rural bridge
had been rebuilt. Hurricane Sandy plowed into
the New Jersey-New York coast, grabbing the
national spotlight with its even greater toll of
death and destruction. And once again, the region—and
the nation—swung into rebuild mode.
Certainly, some rebuilding after such storms will always
be necessary. However, this one-two punch underscored a
pervasive and corrosive aspect of our society: We have rarely
taken the time to reflect on how best to rebuild developed
areas before the next crisis occurs, instead committing to a
disaster-by-disaster approach to rebuilding.
Yet Sandy seems to have been enough of a shock to stim-
ulate some creative thinking at both the federal and regional
levels about how to break the cycle of response and recov-
ery that developed communities have adopted as their de-
fault survival strategy. I have witnessed this firsthand as part
of a team that designed a decision tool called the Sea Level
Rise Tool for Sandy Recovery, to support not just recovery
from Sandy but preparedness for future events. The story
that has emerged from this experience may contain some
useful lessons about how science and research can best sup-
port important social decisions about our built environ-
ment. Such lessons are likely to be of increasing importance
as predicted climate change brings the inevitability of ex-
treme weather events.
A story of cooperation
In the wake of Sandy, pressure mounted at all levels, from lo-
cal to federal, to address one question: How would we re-
build? This question obviously has many dimensions, but
one policy context cuts across them all. The National Flood
Insurance Program provides information on flood risk that
developers, property owners, and city and state governments
are required to use in determining how to build and rebuild.
SUMMER 2014 83
Run by the Federal Emergency Management Agency
(FEMA), the program provides information on the height of
floodwaters, known as flood elevations, that can be used to
delineate on a map where it is more or less risky to build.
Flood elevations are calculated based on analysis of how
water moves over land during storms of varying intensity, es-
sentially comparing the expected elevation of the water sur-
face to that of dry land. FEMA then uses this information to
create flood insurance rate maps, and insurers use the maps
to determine the cost of insurance in flood-prone areas. The
cost of insurance and the risk of flooding are major factors
for individuals and communities in determining how high
to build structures and where to locate them to avoid seri-
ous damage during floods.
But here's the challeng.
Living behind the Launceston levee: insights from a community surveyNeil Dufty
Levees are used in Australia and across the world as a structural means to reduce flood risks. However, people protected by levees can develop a false sense of security believing that the levee is fail-proof or might only fail in extreme flood events. This optimism can lower flood preparedness levels and lead to increased urban development in flood-prone areas. This can magnify flood risk behind the levee—a phenomenon known as the ‘levee paradox’ or ‘levee effect’. This article analyses the results of a community survey conducted with residents and businesses located behind the levees in Launceston, Tasmania. The survey revealed a widespread low level of flood-risk awareness and elevated optimism about the protection afforded by the levee system. However, there were no significant and direct relationships between the possible levee paradox causal factors and the low levels of preparedness identified. This does not rule out the levee paradox, as more complex psychological interrelationships could be involved. Emergency management planning should consider the high proportion of people (over one-third) who stated they would require assistance during a flood in the Launceston levee-protected areas.
Endemic Hydro climatic Flood Hazards in Some Cameroonian Coastal Cities: The ...CrimsonpublishersMCDA
Rapid urbanisation of the three Cameroon’s coastal cities of Douala, Kumba and Limbe has provoked and sustained intense competition for the limited space by burgeoning urbanites and broadening scope of lucrative economic activities within the cities. The unfortunate aspect has been that the urban poor are being bided off from suitable land spaces and coerced to source a living on fragile urban zones as river valleys, poorly reclaimed marshes on urban flood plains, which are high risk zones for flooding. Empirical and statistical analyses complemented by field investigations, and mapping techniques have been used to establish and exposed some hitherto latent dimensions of this perennial demise of these urban centres.
Contrary to earlier explanations that saw man as the principal architect of his own doom, present findings reveal but the imposing role of hydroclimatic excesses reinforced by the urban geomorpoholigcal dispositions of these urban landscapes as the primal triggers of this seasonal urban crisis. This makes the hazard of seasonal urban flooding in these cities more of the work of nature than the hand of man. Based on this, it is recommended that current flood management strategies should be restructured to top target the root causes rather than cosmetically targeting the consequences, if these cities must integrate the main path to urban sustainability come 2030 as targeted set in the Sustainable Development Goals (SDGs).
https://crimsonpublishers.com/mcda/fulltext/MCDA.000538.php
For more open access journals in Crimson Publishers please click on link: https://crimsonpublishers.com
For more articles on journal of Agronomy please click on below link: https://crimsonpublishers.com/mcda/
2012 Emergency Track, Emergency Preparedness: Using Local and Federal Data an...GIS in the Rockies
This presentation focuses on a case study of river flooding in Reno, Nevada. However, the "how-to" information covered is applicable to any community that experiences disasters. Floods have negative impacts on people and businesses located in flood-prone areas, as well as on the finances of local governments. It's important for emergency management staff to have knowledge of current demographics of citizens who are at risk from flooding. Residents who are elderly, lack transportation, and have fewer financial savings and resources may require special emergency response measures. Decision-makers benefit from advance knowledge about the number of and current values of commercial and residential buildings located in flood-prone areas, because their losses could impact local governments' tax revenue.
This session discusses how GIS professionals can 1) perform overlay analyses of spatial and demographic data from federal and local sources to identify potential human and economic impacts of flooding and 2) create visualization products that show results in a format that emergency responders and decision-makers can easily understand. It covers using data from the 2010 Census and the American Community Survey. Users who are familiar with the 2000 Census data but not the 2010 data will benefit from learning about changes that have occurred. This presentation includes examples of 2-D and 3-D maps created using ArcGIS 10.
HOW TO COPE WITH EXTREME WEATHER EVENTS IN BRAZILIAN CITIES.pdfFaga1939
This article aims to demonstrate that there are solutions that can be adopted by Brazilian governments at all levels (federal, state and municipal) to protect Brazilian cities affected by extreme weather events as a result of global warming and the consequent global climate change that tends to be catastrophic. Floods have been recurring in Brazilian cities. These events reveal that public authorities do not plan Brazilian cities rationally with the appropriate use of Engineering, among other essential measures. Prevention and correction measures to minimize damage caused by floods are classified, according to their nature, into structural measures that correspond to the works that can be implemented with the execution of engineering works aimed at correcting and/or preventing problems arising of floods and non-structural measures are those that seek the introduction of standards, regulations and programs that aim, for example, to discipline the use and occupation of land in cities, implementation of warning systems and public awareness. It is essential that Brazilian governments at all levels (federal, state and municipal) prepare contingency plans to evacuate populations that may be affected as a result of floods, floods and floods. The municipal government plays a fundamental role in preventing floods in cities. To this end, a municipal development master plan must be drawn up that includes, among other measures, the adoption of solutions to minimize or eliminate the risks faced by the population and the systematic identification of risk areas in order to establish population settlement rules.