Downloaded 391 times

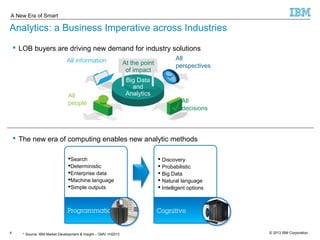
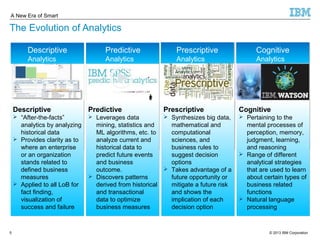
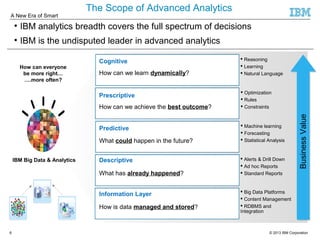
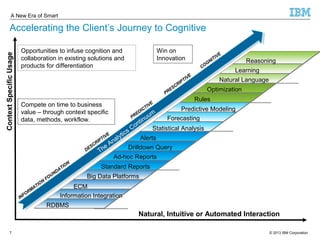
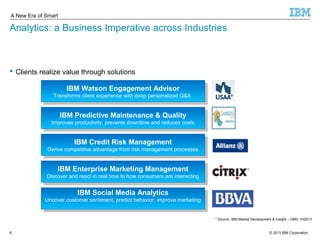
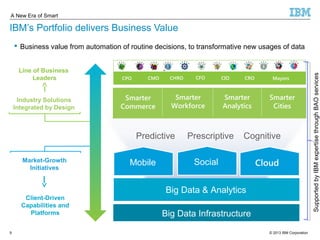
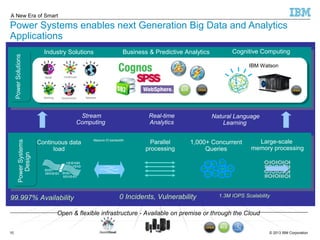
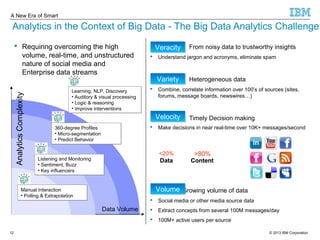

The document discusses the evolution of analytics from descriptive to cognitive analytics, detailing IBM's approach to big data and its application across various industries. It highlights the value of IBM's analytics solutions, including specific use cases, customer case studies, and the technologies involved in managing and analyzing big data. Additionally, it emphasizes the importance of cognitive analytics in making near real-time decisions, understanding data trustworthiness, and leveraging advanced technologies like natural language processing and machine learning.


![제 23회 보아즈(BOAZ) 빅데이터 컨퍼런스 - [MBOAX] : ABSA를 활용한 소비자 반응 분석 기반 운영 효율화 대시보드 설계](https://cdn.slidesharecdn.com/ss_thumbnails/3-1boaz23rdconferencemboax-260203102709-9d519923-thumbnail.jpg?width=640&height=640&fit=bounds)


