Download as PDF, PPTX
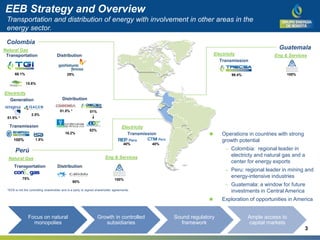
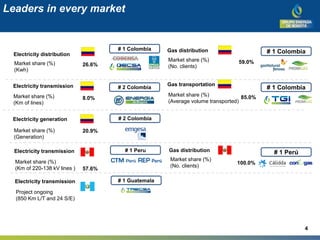
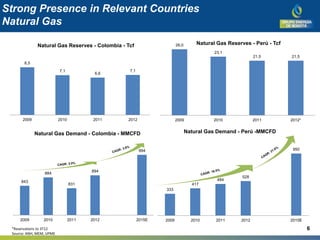
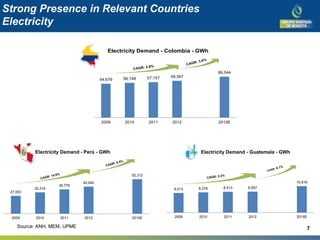
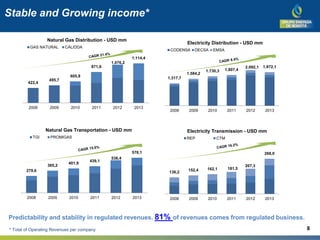
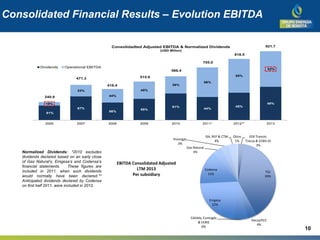
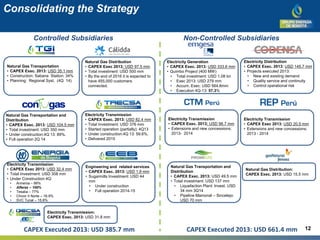
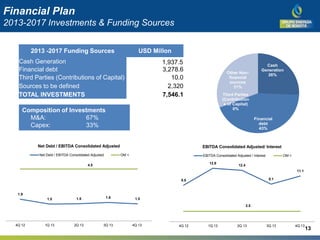
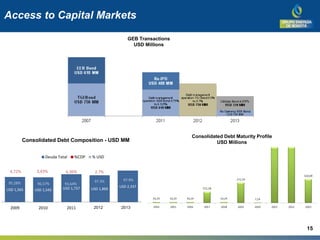
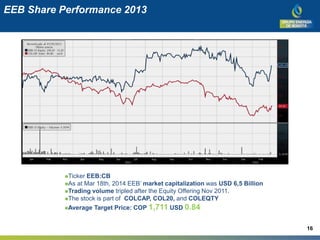

EEB is a regional leader in the energy sector with operations in Colombia, Peru, and Guatemala. It has majority ownership of companies involved in electricity transmission and distribution, natural gas transportation and distribution, and electricity generation. EEB has pursued a strategy of growth through controlled subsidiaries and expanding infrastructure. It has a strong financial position with stable revenues from regulated businesses comprising 81% of its income. EEB has ambitious capital investment projects underway totaling over $7.5 billion from 2013-2017 to further consolidate its leadership position across its operations.