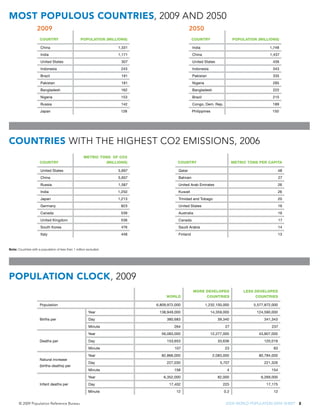
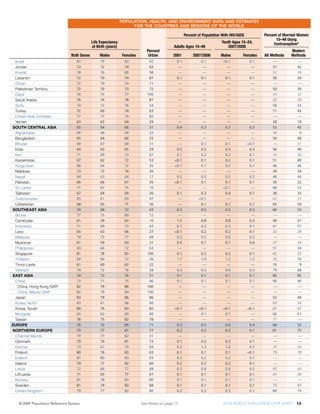
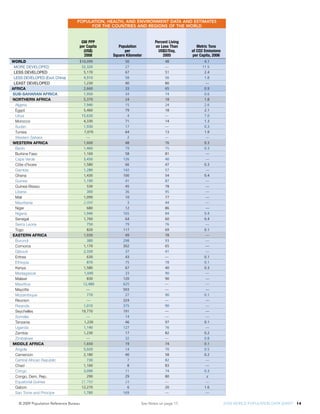
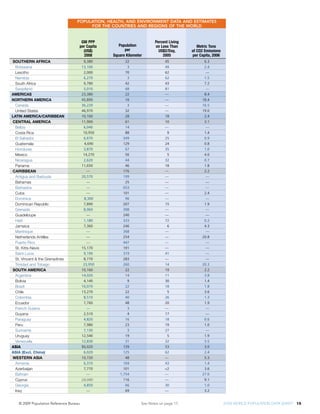
The document provides population data and estimates for countries and regions of the world from 2009 to 2050. Some key figures presented include:
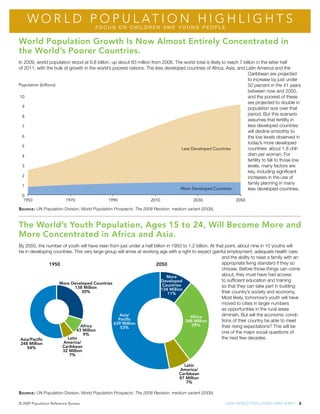
- World population in 2009 was 6.8 billion and is projected to increase to 9.4 billion by 2050.
- Less developed regions are growing faster, projected to increase 45% by 2050 compared to 7% in more developed regions.
- The population of sub-Saharan Africa is projected to nearly double, increasing 110% by 2050.
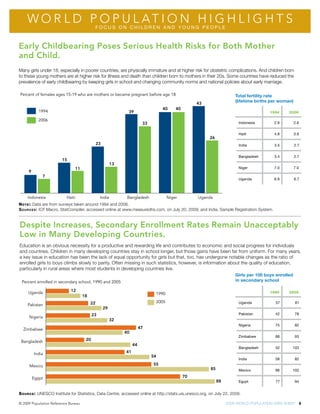
- Fertility rates remain highest in least developed countries at 4.6 births per woman on average, compared to 1.7 in more developed countries.