1. 0.125
0.145
0.165
0.185
0.205
0.225
0.245
35000 45000 55000 65000 75000 85000 95000
CrackLength
Cycles
Photos placed in horizontal position
with even amount of white space
between photos and header
Photos placed in horizontal position
with even amount of white space
between photos and header
Sandia National Laboratories is a multi-program laboratory managed and operated by Sandia Corporation, a wholly owned subsidiary of Lockheed
Martin Corporation, for the U.S. Department of Energy’s National Nuclear Security Administration under contract DE-AC04-94AL85000.
SAND No. SAND2015-5921 D
Max Gatenby
Max B. Gatenby, CSU Chico, B.S. Mechanical Engineering, est. June 2017
Paul J. Gibbs, Org. 8367, Hydrogen Combustion & Technology
July 29, 2015
Abstract
Hydrogen embrittlement is becoming a prevalent
issue as companies look to hydrogen as a viable
fuel source.
Stainless steels are currently the most feasible
solution for hydrogen storage.
Fatigue testing (periodic loading and unloading)
is a simplified way to represent the fill-empty
cycles experienced by a hydrogen storage tank.
Project Goals:
Identify crack growth rate in Nitronic 40 stainless
steel using direct current potential drop (DCPD).
Derive formula to translate DCPD data into crack
growth curve.
Background
Results
The method of obtaining crack growth shows great promise,
and will likely present a viable method for indirectly
obtaining crack growth data. Future work will refine the
analysis to understand the discrepancy between heat tinted
measurements the crack area measured using DCPD.
Additionally the technique will be compared to direct
measurements of crack growth rate.
Acknowledgments
Paul J. Gibbs, Chris San Marchi, Brian Somerday, Joseph Ronevich, Samantha Lawrence, Jeff Campbell, Brendan Davis.
pressure
Specimen geometry schematic
relating the measured voltage at
the DCPD leads (blue above) to
the approximate crack length.
The crack length equation
(below) was derived from a
geometrical assumptions
(right and schematic above)
using the voltage measured
on either side of the crack,
and specimen parameters.
Example of a notched
fatigue specimen with
blue DCPD wires attached.
1) Hydrogen-surface interactions: molecular absorption and dissociation
producing atomic hydrogen chemisorbed on the metal surface.
2) Bulk metal-hydrogen interactions: dissolution of atomic hydrogen into the
bulk and segregation to defects in the metal (i.e., transport and trapping).
3) Hydrogen-assisted cracking: interaction of hydrogen with defects changes
local properties of the metal leading to embrittlement and possibly failure.
0
0.5
1
1.5
2
2.5
3
0.05
0.1
0.15
0.2
0.25
0.3
25000 30000 35000 40000 45000 50000 55000
CrackSIze(in)
Cycles
Crack Length DCPD (mV)
DCPDResistance(mV)
𝑎 = 𝑐𝑜𝑠−1
𝑠𝑖𝑛ℎ 𝜋𝑦 𝑜
2𝑏
𝑠𝑖𝑛ℎ 𝑉2(𝑎)
𝑉2(𝑎 𝑜)
𝑠𝑖𝑛ℎ−1
sinh
𝜋𝑦 𝑜
2𝑏
𝑐𝑜𝑠
𝜋𝑎 𝑜
2𝑏
2𝑏
𝜋
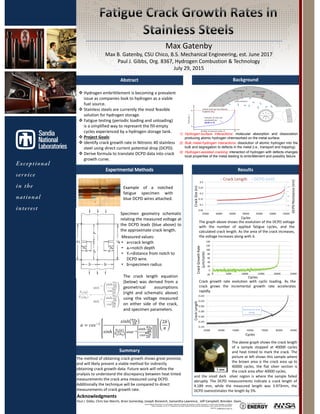
The graph above shows the evolution of the DCPD voltage
with the number of applied fatigue cycles, and the
calculated crack length. As the area of the crack increases,
the voltage increases along with it.
-20
0
20
40
60
80
100
120
140
0 5000 10000 15000 20000 25000
CrackGrowthRate
(mm/cycle)
Cycles
Crack growth rate evolution with cyclic loading. As the
crack grows the incremental growth rate accelerates
rapidly.
Removed for heat
tinting
Heat tinted area
The above graph shows the crack length
of a sample stopped at 40000 cycles
and heat tinted to mark the crack. The
picture at left shows this sample where
the brown area is the crack area up to
40000 cycles, the flat silver section is
the crack area after 40000 cycles,
Summary
Abstract
Measured values:
• a=crack length
• ao=notch depth
• Yo=distance from notch to
DCPD wire.
• b=specimen radius
and the small dark silver region is where the sample failed
abruptly. The DCPD measurements indicate a crack length of
4.189 mm, while the measured length was 3.973mm, the
DCPD overestimates the length by 5%.