
Recommended
More Related Content
What's hot
What's hot (20)
Similar to Case Study: Cyclic Voltametric Measurement
Similar to Case Study: Cyclic Voltametric Measurement (20)
More from Hasnain Ali
Case Study: Cyclic Voltametric Measurement
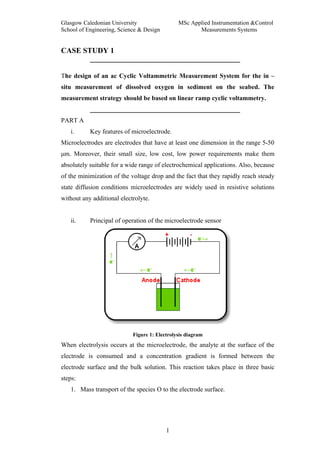
- 1. Glasgow Caledonian University MSc Applied Instrumentation &Control School of Engineering, Science & Design Measurements Systems CASE STUDY 1 The design of an ac Cyclic Voltammetric Measurement System for the in – situ measurement of dissolved oxygen in sediment on the seabed. The measurement strategy should be based on linear ramp cyclic voltammetry. PART A i. Key features of microelectrode. Microelectrodes are electrodes that have at least one dimension in the range 5-50 μm. Moreover, their small size, low cost, low power requirements make them absolutely suitable for a wide range of electrochemical applications. Also, because of the minimization of the voltage drop and the fact that they rapidly reach steady state diffusion conditions microelectrodes are widely used in resistive solutions without any additional electrolyte. ii. Principal of operation of the microelectrode sensor Figure 1: Electrolysis diagram When electrolysis occurs at the microelectrode, the analyte at the surface of the electrode is consumed and a concentration gradient is formed between the electrode surface and the bulk solution. This reaction takes place in three basic steps: 1. Mass transport of the species O to the electrode surface. 1
- 2. Glasgow Caledonian University MSc Applied Instrumentation &Control School of Engineering, Science & Design Measurements Systems 2. Oxidation of species O to product R with an associated transfer of electrons at the electrode. 3. Mass transport of the product R from the electrode surface to the bulk solution. The rate of this reaction depends on the slower step. Since step 2 can be controlled by the applied voltage, the slowest step becomes the mass transport of the species to or from the electrode surface; hence the magnitude of the measured current will be dependent on the mass transport process. The mass transport is mainly taking place by diffusion and Fick’s laws can be used to relate the flux and concentrations of a substance as a function of time and position. Figure 2: Concentration versus distance for a mictroelectrode The electrocell can be modelled by the RC circuit shown in figure 3. Rct microelectrode Rsol Reference Cdl electrode Figure 3: Equivalent electrocell model 2
- 3. Glasgow Caledonian University MSc Applied Instrumentation &Control School of Engineering, Science & Design Measurements Systems iii. Typical linear ramp cyclic voltammetry A typical linear ramp voltammetric response for a microelectrode under diffusion was obtained in the lab. The acquired in LabView data were stored in a spreadsheet and illustrated in figure 3. For this voltammogram the electrolytes is aerated water, the period is 50s, the amplitude is 2V while 1000 samples are taken. The diffusion limited current is the current between the the ‘plato’ positions of the current. Voltammogram, aerated water 1.00E-08 5.00E-09 0.00E+00 -1.5 -1 -0.5 -5.00E-09 0 0.5 1 1.5 Current (A) -1.00E-08 Diffusion limited current -1.50E-08 -2.00E-08 -2.50E-08 -3.00E-08 Applied Voltage (V) Figure 4: Measured Voltammogram There is rapid increase of the current as the voltage approaches -1V. This fact is associated with the evolution of hydrogen gas. A small peak close to 0 Volt is because of the presence of Ag + ions. The release of oxygen is responsible for the diffusion current. Measuring the produced current with an inlaid disc microelectrode the concentration of dissolved oxygen in the solution can be calculated from the diffusion limited current at an inlaid disc formula: i = 4nFaDC ∞ Equation 1 3
- 4. Glasgow Caledonian University MSc Applied Instrumentation &Control School of Engineering, Science & Design Measurements Systems where n =number of electrons involved in the reaction, F=Faraday constant, cm 2 D=diffusion coefficient ( ), C = concentration of bulk solution, a= radius of sec the electrode (cm). It is obvious that the concentration is proportional to the produced current. Solving equation 2 for C, the concentration of dissolved oxygen can be calculated. iv. Simulation results The simulation results from exercise 1 are presented in the table below. Scan Rate (V/s) Icdl 0.001 2.80E-12 0.056 1.57E-10 0.116 3.25E-10 0.176 4.92E-10 0.2 5.60E-10 0.236 6.60E-10 0.296 8.28E-10 0.356 9.96E-10 0.416 1.16E-09 0.476 1.33E-09 Table 1 Capacitance is a measure of the amount of electric charge stored (or separated) for a given electric potential. The slope of the characteristic of the current versus the scan rate will give the value of the double layer capacitance because of the following equation dq dV dV , where q= the electric charge, q = CV ⇒ =C ⇒ icdl = C icdl = the dt dt dt dV double layer current, V= electric potential, = Scan rate. dt 4
- 5. Glasgow Caledonian University MSc Applied Instrumentation &Control School of Engineering, Science & Design Measurements Systems Icd Vs Scan Rate 1.40E-09 y = 2.792E-09x + 8.293E-13 1.20E-09 1.00E-09 Current (A) 8.00E-10 Icdl 6.00E-10 4.00E-10 Linear (Icdl) 2.00E-10 0.00E+00 0 0.1 0.2 0.3 0.4 0.5 Scan Rate (V/s) Figure 5: The slope i=f(dV/dt) delivers the value for the double layer capacitance Therefore, the double layer capacitance is calculated to be 2.79nF. v. Hysteresis Hysteresis occurs due to the charging current associated with the capacitor at the microelectrode, shown in the equivalent model in figure 3. The magnitude of the capacitance is proportional to the area of the electrode. To reduce the magnitude of hysteresis, i) the size of the microelectrode should be as small as possible, ii) the scan rate should be slow. PART B vi. Block Diagram Figure 6: AC linear ramp cyclic voltammetric measurement system with phase sensitive detection 5
- 6. Glasgow Caledonian University MSc Applied Instrumentation &Control School of Engineering, Science & Design Measurements Systems vii. Design of microelectrode probe for submersible lander. In order to properly design a microelectrode system, a clear understanding for the needs and constraints of the application must be understood. The primary issues that must be considered are: the electrical, mechanical, chemical, biological, thermal, magnetic, and optical performance specifications in the context of the intended function and application. The number of electrodes, spacing/density, position in tissue, duration of use, and extent of use are all important design criteria that are driven by the application. With a low electrode count, simple individual microwires or microprobes with external discrete amplifiers are sufficient. However, as the electrode count increases, the number of wires becomes increasingly inconvenient and greatly burdens the system integration and reduces system reliability. The integration of mixed-signal circuitry has the advantage of reducing the number of wires necessary to connect to the device, positioning the amplifier nearer to the signal source to lower the noise level, but has the disadvantage of substantially increasing the cost and design complexity. The primary mechanical performance criteria involve the shape and elasticity of the microelectrode array and the supporting structure. Supporting structures can vary from thin and flexible large-area membranes to thick planar substrates and a variety of penetrating microprobes. Also, the shape of the microelectrode is critical. The chemical performance criteria involve the general chemical compatibility / stability of the materials in the device. When microelectrodes are coated with an ion-selective membrane, the potential between the solution and the electrode can be related to the concentration of the ionic species of interest (potentiometry). Similarly, cyclic voltammetry can be used to relate the magnitude of current flowing at different potentials to ionic concentration. Therefore, another chemical performance criteria would be the sensitivity of the electrode to desirable ionic species and the lack of sensitivity to undesirable ionic species. 6
- 7. Glasgow Caledonian University MSc Applied Instrumentation &Control School of Engineering, Science & Design Measurements Systems The thermal specification of most interest is the heat dissipation of the microelectrode system. Although this is essentially negligible for conventional microwires, the integration of a substantial amount of circuitry can increase concerns. In particular, the circuitry needed for the transmission of information via wireless telemetry often requires the most power and is the least efficient circuit block. Carefully designing the thermal characteristics of electrically powered systems to distribute heat uniformly can reduce the problems caused by hot spots. From a magnetic and electromagnetic perspective, the two greatest concerns lie with the use of microelectrode systems in magnetic resonance imaging (MRI) systems and the transmission /reception of wireless telemetry and inductive power. Microelectrode systems typically consist of the following materials: electrodes are made of Pt, Ir, Ag/AgCl. Electrical interconnects can be made of Al, Au, polysilicon. The electrical insulation is usually made of SiO 2, Si3N4 or polyamide. The mechanical structure is Si, glass, Al2O3, PtIr. The materials used in the electrode and supporting structure possess mechanical properties that drive the mechanical design. Small holes ( d= nm) were made on the probe’s surface for to allow the liquid come in touch with the electrodes. Figure 7: The designed probe 7
- 8. Glasgow Caledonian University MSc Applied Instrumentation &Control School of Engineering, Science & Design Measurements Systems The probe illustrated in figure 7 is designed to be put on a submersible lander on the seabed. The stainless steel cover protects from corrosion, shielding, gives mechanical strength while it has small holes in the range of a few nm to allow accurate measurements to the microelectrode. The microelectrode itself is not a new invention; it is made of platinum, glass, copper. The closer the amplifier will be to the sensor the best for our measurements. Therefore the amplifier was put inside the probe. A necessary reference microelectrode was put inside the sensor to provide accurate measurements. When the lander reaches the seabed the probe’s shaft enters the land for 3-5 μm which is the height of the cone in the bottom part of the probe. Four or more probe can be put on the lander to provide higher accuracy about the concentration of oxygen in sediment on the seabed. viii. Microelectrode diameter . dV 2 The scan rate for the given time, rate is = = = 0.01V / sec . The double dt 200 layer current should not be larger than 20pA and C dl = 550 µFcm −2 . In scan rate.xls file the diameter of the electrode is set to 10 µm . The resistance of the solution is Rsol =1.00E+06 Ohm, Rct= 1.00E+09 Ohm, and the current is 4.32E-12A which is less than 20pA. ix. Low noise current to voltage converter Figure 8: I/V converter Using the 741 IC and the above diagram a low noise current to voltage is achieved. The input impedance and the voltage gain are of the main characteristics to select an operational amplifier. The low input impedance and the infinite resistance between the inputs of the 741 amplifier in figure 7 drive the current throught the resistance Rf and finally the current is converted to voltage. 8
- 9. Glasgow Caledonian University MSc Applied Instrumentation &Control School of Engineering, Science & Design Measurements Systems For further noise reduction it is proposed the connection of a lock-in or a differential amplifier at the output of the I/V converter. x. Setting the phase at a lock-in amplifier. Figure 9: Lock-in amplifier A lock-in amplifier is an ac amplifier which provides a dc output proportional to the measured ac signal. The control switch is controlled by a reference signal between a gain of -1 and 1. Assuming that the reference is a sum of cosines, using Fourier series it can be written as v r = (4Vr / π )[ sin ω r t − sin(3ω r t ) / 3 + sin(5ω r t ) / 5 − sin(7ω r t ) / 7 + ...] , and the signal is e s = E s sin(ωt + φ ) , then: 9
- 10. Glasgow Caledonian University MSc Applied Instrumentation &Control School of Engineering, Science & Design Measurements Systems es vr = (2 E sVr / π)([cos(ωs t +ωr t ) +φ] + cos[(ωs t −ωr t ) +φ] −[cos(ωs t + 3ωr t ) +φ] / 3 + [cos(ωs t − 3ωr t ) +φ] / 3 + [cos(ωs t + 5ωr t ) +φ] / 5 + [cos(ωs t + 5ωr t ) +φ] / 5 −...) If ω s = ω r then the low pass filter will remove all the terms except one, hence: e s v r = (2 E sVr / π ) cos φ Equation 2 Equation 2 shows that the maximum dc output will come when the phase difference φ between the signal and the reference will be zero. For an in-phase squarewave the expected output is shown in figure 9. Figure 9: dc output = 0.637, phase difference=0 degrees Figure 10: dc output = 0, phase difference= 90 degrees The use of square wave reference signal guarantees 27% larger output than using a sinusoidal signal. 10
- 11. Glasgow Caledonian University MSc Applied Instrumentation &Control School of Engineering, Science & Design Measurements Systems CASE STUDY 2 The investigation of an Earth Resistivity Measurement System. 1. The measurement System Figure 3: Employed measurement system The measurement system that used was based on the four point probe Schlumberger configuration and it is shown in figure 1. The circuit diagram of a voltage controlled current source is shown in figure 2. The circuit shown here has a nearly infinite output resistance, since the output current is equal to the current through resistor R, which is i= Vin/R = 0.6/3000 = 0.0002A. The 11
- 12. Glasgow Caledonian University MSc Applied Instrumentation &Control School of Engineering, Science & Design Measurements Systems output of the op-amp changes its voltage so that this current i flows, whatever the load resistance. Vin = 0.6V Rload Vload R=3KOhm Figure 4: V/I converter Drawing a graph Vload versus Rload from the provided data, given in table 1, in figure 3 it is obvious that the current is independent of the load resistance. R(Ohms) V (Volts) I load(A) 1000 0.2 0.0002 2000 0.4 0.0002 3000 0.6 0.0002 4000 0.8 0.0002 5000 1 0.0002 6000 1.2 0.0002 Table 2 Vload VS Rload 1.4 1.2 Voltage (Volts) 1 0.8 V (Volts) 0.6 0.4 0.2 0 0 2000 4000 6000 8000 Resistance (Ohms) Figure 5: Constant current output 12
- 13. Glasgow Caledonian University MSc Applied Instrumentation &Control School of Engineering, Science & Design Measurements Systems 2. Measurement Strategy Using the measuring system shown in figure 1 the two electrodes are driven by a constant current source, and the potential difference is measured by the two inner electrodes. The constant source will ensure the current flowing throughout medium is independent of contact impedance and use of high input impedance instrumentation amplifiers will ensure that no current will flow throughout the voltage measuring electrodes. The path in which the current flows depends on how the electrical resistivity is distributed within the region. Hence, the potential difference between two pairs of adjacent electrodes contains information about the distribution of electrical resistivity. The lock-in amplifier is used to improve the signal to noise ratio. Actually, the lock-in amplifier is a phase sensitive detector with additional element which allows: • Amplification and filteration of input signal • Shifting of phase of input signal with respect to signal. • Amplification of the output. The main advantages are that it responds to the frequency of interest, and the reference frequency can be chosen to minimise the effect of 1/f and to avoid strong interfering noise signals. 3. Archaeological application The provided data are illustrated in columns 1,2 of the following table. π ( L2 − x 2 ) 2 ∆V Resistivity was calculated using the formula: ρ= 2l ( L2 − x 2 ) I meters*Volts/Ampere, where L=3.25m, 2l=0.2m, I=0.002A, x=L -LHSposition Postion from LHS (m) distance x from the centre (m) Resistivity 0.5 2.75 545.987137 1 2.25 2128.743182 1.5 1.75 3242.469482 2 1.25 11542.92394 13
- 14. Glasgow Caledonian University MSc Applied Instrumentation &Control School of Engineering, Science & Design Measurements Systems 2.5 0.75 42358.55263 3 0.25 16299.32189 3.5 -0.25 13039.45751 4 -0.75 7059.758772 4.5 -1.25 5771.461968 5 -1.75 5187.951171 5.5 -2.25 4561.592533 6 -2.75 4289.898934 Table 3 The graph of the resistivity versus position is shown in figure 4. resistivity Vs distance 45000 40000 35000 30000 Resistivity 25000 resistivity 20000 15000 10000 5000 0 -3 -2.5 -2 -1.5 -1 -0.5 0 0.5 1 1.5 2 2.5 3 Distance x (m) Figure 6: The large variation in resistivity in the region 0.5-1m indicates change in the layer The observed wave at a distance of 0.7 meters is a good indicator of changes in composition, layer thickness or contaminant levels. Electrical resistivity of stones, rocks, and hydrocarbons are about thousand times higher than that of soil’s. Hopefully, an object of great archaeological significance is hidden at this place. 4. Vertical electrical sounding (VES) To achieve vertical electrical sounding the electrodes should be maintained at the same relative spacing. Also, the position of the electrodes should be expanded over a central fixed point as shown in figure 5. 14
- 15. Glasgow Caledonian University MSc Applied Instrumentation &Control School of Engineering, Science & Design Measurements Systems Electrodes Ground Figure 5: Vertical Electrical sounding measurement system CASE STUDY 3 Optical fibre Techniques for Chemical Measurements 1. A sensor for N02. The fraction of a parallel beam of light absorbed by a sample is related to the concentration of the absorbing species by the Beer-Lambert Law : Io log10 = Ecl I Equation 3 where Io= intensity of incident light, I=intensity of transmitting light, E=molecular extinction coefficient, c= concentration in gm moles/L, Io l=paththlength of sample. The quantity log10 is known as absorbance of the I sample. When using a sampling cell with mirrored curve faces the pathlength becomes longer and the intensity ratio Io/I becomes bigger according to equation 1. In other words the absorbance becomes higher. 15
- 16. Glasgow Caledonian University MSc Applied Instrumentation &Control School of Engineering, Science & Design Measurements Systems 2. A ph sensor using fluorescence intensity measurements and the evanescent wave. The light sources are characterised by the spectral power distribution, the luminescence, the stability of light source, the way of control, the cost, and are mainly distinguished in coherent and incoherent ones. In this investigation coherent light source was used. In particular, a nitrogen dye laser was used because of the narrow line width and the high intensity it provides. Also, it is highly directional, and it has stable pulse output. Of the key parameters that influence the distance of the sensing is the concentration of the indicator. Actually, the strongest the measured signal the best for the measurements. For example, an increase in concentration of the distal end indicator would produce a decrease in signal due to absorption in the thicker distal sensing zone. 3. A sensor for dissolved oxygen. The digital curve method for oxygen sensing with a nitrogen laser or a high voltage photomultiplier gives not very fast response due to the repetition rate and the process for the calculation of the time constant tau. To decrease the repetition rate, using the same method it is proposed the use of a LED. However, the calculation time would be the same. Changing the amplifier used in the digital curve method with a phase shift detector and using a modulated pulse, the frequency domain fluorometry technique can be used to measure the lifetime of the sample. In this method the excitation light is modulated sinusoidally at frequency f, and the phase shift of the fluorescence relative to the excitation is measured as illustrated in the figure below. 16
- 17. Glasgow Caledonian University MSc Applied Instrumentation &Control School of Engineering, Science & Design Measurements Systems Figure 1: Frequency modulation technique 17