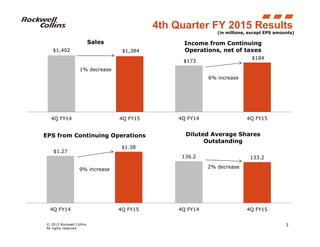
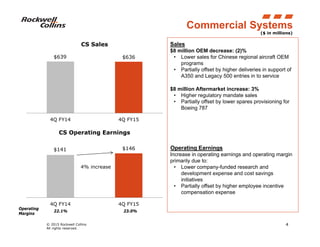
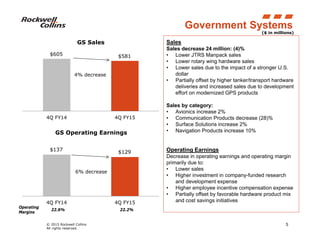
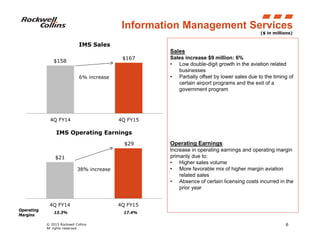
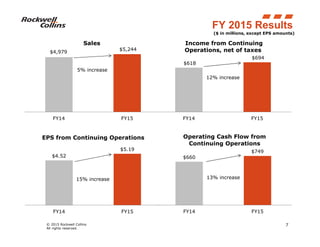
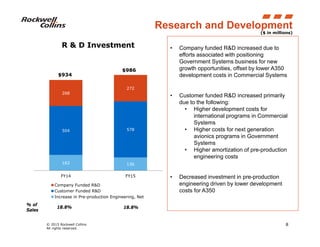
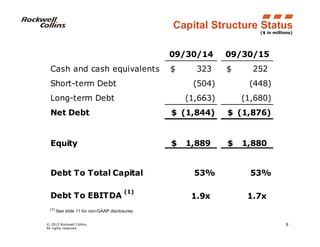
© 2015 Rockwell Collins
All rights reserved.
Insert pictures into these angled boxes. Height should be 3.44 inches.
4th Quarter FY 2015
Conference Call
October 30, 2015
© 2015 Rockwell Collins
All rights reserved.
2
Safe Harbor Statement
This presentation contains statements, including certain projections and business trends, that are forward-looking statements as
defined in the Private Securities Litigation Reform Act of 1995. Actual results may differ materially from those projected as a result
of certain risks and uncertainties, including but not limited to the financial condition of our customers and suppliers, including
bankruptcies; the health of the global economy, including potential deterioration in economic and financial market conditions;
adjustments to the commercial OEM production rates and the aftermarket; the impacts of natural disasters and pandemics,
including operational disruption, potential supply shortages and other economic impacts; cybersecurity threats, including the
potential misappropriation of assets or sensitive information, corruption of data or operational disruption; delays related to the
award of domestic and international contracts; delays in customer programs, including new aircraft programs entering service later
than anticipated; the continued support for military transformation and modernization programs; potential impact of volatility in oil
prices, currency exchange rates or interest rates on the commercial aerospace industry or our business; the impact of terrorist
events on the commercial aerospace industry; declining defense budgets resulting from budget deficits in the U.S. and abroad;
changes in domestic and foreign government spending, budgetary, procurement and trade policies adverse to our businesses;
market acceptance of our new and existing technologies, products and services; reliability of and customer satisfaction with our
products and services; potential unavailability of our mission-critical data and voice communication networks; unfavorable
outcomes on or potential cancellation or restructuring of contracts, orders or program priorities by our customers; recruitment and
retention of qualified personnel; regulatory restrictions on air travel due to environmental concerns; effective negotiation of
collective bargaining agreements by us, our customers, and our suppliers; performance of our customers and subcontractors;
risks inherent in development and fixed-price contracts, particularly the risk of cost overruns; risk of significant reduction to air
travel or aircraft capacity beyond our forecasts; our ability to execute to internal performance plans such as restructuring activities,
productivity and quality improvements and cost reduction initiatives; achievement of ARINC integration and synergy plans as well
as our other acquisition and related integration plans; continuing to maintain our planned effective tax rates; our ability to develop
contract compliant systems and products on schedule and within anticipated cost estimates; risk of fines and penalties related to
noncompliance with laws and regulations including compliance requirements associated with U.S. Government work, export
control and environmental regulations; risk of asset impairments; our ability to win new business and convert those orders to sales
within the fiscal year in accordance with our annual operating plan; and the uncertainties of the outcome of lawsuits, claims and
legal proceedings, as well as other risks and uncertainties, including but not limited to those detailed herein and from time to time
in our Securities and Exchange Commission filings. These forward-looking statements are made only as of the date hereof and
the company assumes no obligation to update any forward-looking statement.
The fourth quarter fiscal 2015 and full year fiscal 2015 financial results in this presentation are unaudited.
© 2015 Rockwell Collins
All rights reserved.
3
(in millions, except EPS amounts)
4th Quarter FY 2015 Results
$173
$184
4Q FY14 4Q FY15
Income from Continuing
Operations, net of taxes
6% increase
$1.27
$1.38
4Q FY14 4Q FY15
EPS from Continuing Operations
9% increase
$1,402 $1,384
4Q FY14 4Q FY15
Sales
1% decrease
136.2 133.2
4Q FY14 4Q FY15
Diluted Average Shares
Outstanding
2% decrease
© 2015 Rockwell Collins
All rights reserved.
$639 $636
4Q FY14 4Q FY15
CS Sales
4
($ in millions)
Sales
$8 million OEM decrease: (2)%
• Lower sales for Chinese regional aircraft OEM
programs
• Partially offset by higher deliveries in support of
A350 and Legacy 500 entries in to service
$8 million Aftermarket increase: 3%
• Higher regulatory mandate sales
• Partially offset by lower spares provisioning for
Boeing 787
Operating Earnings
Increase in operating earnings and operating margin
primarily due to:
• Lower company-funded research and
development expense and cost savings
initiatives
• Partially offset by higher employee incentive
compensation expense
Commercial Systems
23.0%22.1%
Operating
Margins
$141 $146
4Q FY14 4Q FY15
CS Operating Earnings
4% increase
© 2015 Rockwell Collins
All rights reserved.
5
22.6% 22.2%
($ in millions)
Government Systems
Sales
Sales decrease 24 million: (4)%
• Lower JTRS Manpack sales
• Lower rotary wing hardware sales
• Lower sales due to the impact of a stronger U.S.
dollar
• Partially offset by higher tanker/transport hardware
deliveries and increased sales due to development
effort on modernized GPS products
Sales by category:
• Avionics increase 2%
• Communication Products decrease (28)%
• Surface Solutions increase 2%
• Navigation Products increase 10%
Operating Earnings
Decrease in operating earnings and operating margin
primarily due to:
• Lower sales
• Higher investment in company-funded research
and development expense
• Higher employee incentive compensation expense
• Partially offset by favorable hardware product mix
and cost savings initiatives
Operating
Margins
$605 $581
4Q FY14 4Q FY15
GS Sales
4% decrease
$137 $129
4Q FY14 4Q FY15
GS Operating Earnings
6% decrease
© 2015 Rockwell Collins
All rights reserved.
6
($ in millions)
Sales
Sales increase $9 million: 6%
• Low double-digit growth in the aviation related
businesses
• Partially offset by lower sales due to the timing of
certain airport programs and the exit of a
government program
Operating Earnings
Increase in operating earnings and operating margin
primarily due to:
• Higher sales volume
• More favorable mix of higher margin aviation
related sales
• Absence of certain licensing costs incurred in the
prior year
Information Management Services
17.4%13.3%
Operating
Margins
$158
$167
4Q FY14 4Q FY15
IMS Sales
6% increase
$21
$29
4Q FY14 4Q FY15
IMS Operating Earnings
38% increase
© 2015 Rockwell Collins
All rights reserved.
$660
$749
FY14 FY15
Operating Cash Flow from
Continuing Operations
13% increase
7
($ in millions, except EPS amounts)
FY 2015 Results
$4,979
$5,244
FY14 FY15
Sales
5% increase
$618
$694
FY14 FY15
Income from Continuing
Operations, net of taxes
12% increase
$4.52
$5.19
FY14 FY15
EPS from Continuing Operations
15% increase
© 2015 Rockwell Collins
All rights reserved.
162 136
504 578
268
272
FY14 FY15
R & D Investment
Company Funded R&D
Customer Funded R&D
Increase in Pre-production Engineering, Net
8
$934
$986
($ in millions)
Research and Development
• Company funded R&D increased due to
efforts associated with positioning
Government Systems business for new
growth opportunities, offset by lower A350
development costs in Commercial Systems
• Customer funded R&D increased primarily
due to the following:
• Higher development costs for
international programs in Commercial
Systems
• Higher costs for next generation
avionics programs in Government
Systems
• Higher amortization of pre-production
engineering costs
• Decreased investment in pre-production
engineering driven by lower development
costs for A350
18.8% 18.8%
% of
Sales
© 2015 Rockwell Collins
All rights reserved.
9
09/30/14 09/30/15
Cash and cash equivalents 323$ 252$
Short-term Debt (504) (448)
Long-term Debt (1,663) (1,680)
Net Debt (1,844)$ (1,876)$
Equity 1,889$ 1,880$
Debt To Total Capital 53% 53%
Debt To EBITDA
(1)
1.9x 1.7x
($ in millions)
Capital Structure Status
(1) See slide 11 for non-GAAP disclosures.
© 2015 Rockwell Collins
All rights reserved.
10
Total Sales $5.3 Bil. to $5.4 Bil.
Total Segment Operating Margins About 21.0%
Earnings Per Share $5.20 to $5.40
Cash Flow from Operations $700 Mil. To $800 Mil.
Research & Development Investment About $1 Bil.
Capital Expenditures About $200 Mil.
FY 2016 Guidance
© 2015 Rockwell Collins
All rights reserved.
11
The Non-GAAP ratio of debt to EBITDA information included on slide nine is believed to be useful to
investors’ understanding and assessment of the Company’s total capital structure and liquidity. The
Company does not intend for the information to be considered in isolation or as a substitute for the
related GAAP measures. The table below explains the debt to EBITDA calculation in more detail for the
twelve-month period from October 1, 2013 through September 30, 2014 and the twelve-month period
from October 1, 2014 through September 30, 2015 (unaudited, in millions). All businesses reported as
discontinued operations have been excluded from the debt to EBITDA calculation.
Non-GAAP Financial Information
12 months ended
9/30/14 9/30/15
Income from continuing operations before income taxes $ 882 $ 962
Interest expense 59 61
Depreciation 141 152
Amortization of intangible assets and pre-production engineering
costs 84 100
Earnings before interest, taxes, depreciation and amortization
(EBITDA)
$ 1,166 $ 1,275
9/30/14 9/30/15
Total debt $ 2,167 $ 2,128
Debt to EBITDA 1.9x 1.7x
© 2015 Rockwell Collins
All rights reserved.
12

Final col q4 fy15 quarterly earnings presentation

  • 1.
    © 2015 RockwellCollins All rights reserved. Insert pictures into these angled boxes. Height should be 3.44 inches. 4th Quarter FY 2015 Conference Call October 30, 2015
  • 2.
    © 2015 RockwellCollins All rights reserved. 2 Safe Harbor Statement This presentation contains statements, including certain projections and business trends, that are forward-looking statements as defined in the Private Securities Litigation Reform Act of 1995. Actual results may differ materially from those projected as a result of certain risks and uncertainties, including but not limited to the financial condition of our customers and suppliers, including bankruptcies; the health of the global economy, including potential deterioration in economic and financial market conditions; adjustments to the commercial OEM production rates and the aftermarket; the impacts of natural disasters and pandemics, including operational disruption, potential supply shortages and other economic impacts; cybersecurity threats, including the potential misappropriation of assets or sensitive information, corruption of data or operational disruption; delays related to the award of domestic and international contracts; delays in customer programs, including new aircraft programs entering service later than anticipated; the continued support for military transformation and modernization programs; potential impact of volatility in oil prices, currency exchange rates or interest rates on the commercial aerospace industry or our business; the impact of terrorist events on the commercial aerospace industry; declining defense budgets resulting from budget deficits in the U.S. and abroad; changes in domestic and foreign government spending, budgetary, procurement and trade policies adverse to our businesses; market acceptance of our new and existing technologies, products and services; reliability of and customer satisfaction with our products and services; potential unavailability of our mission-critical data and voice communication networks; unfavorable outcomes on or potential cancellation or restructuring of contracts, orders or program priorities by our customers; recruitment and retention of qualified personnel; regulatory restrictions on air travel due to environmental concerns; effective negotiation of collective bargaining agreements by us, our customers, and our suppliers; performance of our customers and subcontractors; risks inherent in development and fixed-price contracts, particularly the risk of cost overruns; risk of significant reduction to air travel or aircraft capacity beyond our forecasts; our ability to execute to internal performance plans such as restructuring activities, productivity and quality improvements and cost reduction initiatives; achievement of ARINC integration and synergy plans as well as our other acquisition and related integration plans; continuing to maintain our planned effective tax rates; our ability to develop contract compliant systems and products on schedule and within anticipated cost estimates; risk of fines and penalties related to noncompliance with laws and regulations including compliance requirements associated with U.S. Government work, export control and environmental regulations; risk of asset impairments; our ability to win new business and convert those orders to sales within the fiscal year in accordance with our annual operating plan; and the uncertainties of the outcome of lawsuits, claims and legal proceedings, as well as other risks and uncertainties, including but not limited to those detailed herein and from time to time in our Securities and Exchange Commission filings. These forward-looking statements are made only as of the date hereof and the company assumes no obligation to update any forward-looking statement. The fourth quarter fiscal 2015 and full year fiscal 2015 financial results in this presentation are unaudited.
  • 3.
    © 2015 RockwellCollins All rights reserved. 3 (in millions, except EPS amounts) 4th Quarter FY 2015 Results $173 $184 4Q FY14 4Q FY15 Income from Continuing Operations, net of taxes 6% increase $1.27 $1.38 4Q FY14 4Q FY15 EPS from Continuing Operations 9% increase $1,402 $1,384 4Q FY14 4Q FY15 Sales 1% decrease 136.2 133.2 4Q FY14 4Q FY15 Diluted Average Shares Outstanding 2% decrease
  • 4.
    © 2015 RockwellCollins All rights reserved. $639 $636 4Q FY14 4Q FY15 CS Sales 4 ($ in millions) Sales $8 million OEM decrease: (2)% • Lower sales for Chinese regional aircraft OEM programs • Partially offset by higher deliveries in support of A350 and Legacy 500 entries in to service $8 million Aftermarket increase: 3% • Higher regulatory mandate sales • Partially offset by lower spares provisioning for Boeing 787 Operating Earnings Increase in operating earnings and operating margin primarily due to: • Lower company-funded research and development expense and cost savings initiatives • Partially offset by higher employee incentive compensation expense Commercial Systems 23.0%22.1% Operating Margins $141 $146 4Q FY14 4Q FY15 CS Operating Earnings 4% increase
  • 5.
    © 2015 RockwellCollins All rights reserved. 5 22.6% 22.2% ($ in millions) Government Systems Sales Sales decrease 24 million: (4)% • Lower JTRS Manpack sales • Lower rotary wing hardware sales • Lower sales due to the impact of a stronger U.S. dollar • Partially offset by higher tanker/transport hardware deliveries and increased sales due to development effort on modernized GPS products Sales by category: • Avionics increase 2% • Communication Products decrease (28)% • Surface Solutions increase 2% • Navigation Products increase 10% Operating Earnings Decrease in operating earnings and operating margin primarily due to: • Lower sales • Higher investment in company-funded research and development expense • Higher employee incentive compensation expense • Partially offset by favorable hardware product mix and cost savings initiatives Operating Margins $605 $581 4Q FY14 4Q FY15 GS Sales 4% decrease $137 $129 4Q FY14 4Q FY15 GS Operating Earnings 6% decrease
  • 6.
    © 2015 RockwellCollins All rights reserved. 6 ($ in millions) Sales Sales increase $9 million: 6% • Low double-digit growth in the aviation related businesses • Partially offset by lower sales due to the timing of certain airport programs and the exit of a government program Operating Earnings Increase in operating earnings and operating margin primarily due to: • Higher sales volume • More favorable mix of higher margin aviation related sales • Absence of certain licensing costs incurred in the prior year Information Management Services 17.4%13.3% Operating Margins $158 $167 4Q FY14 4Q FY15 IMS Sales 6% increase $21 $29 4Q FY14 4Q FY15 IMS Operating Earnings 38% increase
  • 7.
    © 2015 RockwellCollins All rights reserved. $660 $749 FY14 FY15 Operating Cash Flow from Continuing Operations 13% increase 7 ($ in millions, except EPS amounts) FY 2015 Results $4,979 $5,244 FY14 FY15 Sales 5% increase $618 $694 FY14 FY15 Income from Continuing Operations, net of taxes 12% increase $4.52 $5.19 FY14 FY15 EPS from Continuing Operations 15% increase
  • 8.
    © 2015 RockwellCollins All rights reserved. 162 136 504 578 268 272 FY14 FY15 R & D Investment Company Funded R&D Customer Funded R&D Increase in Pre-production Engineering, Net 8 $934 $986 ($ in millions) Research and Development • Company funded R&D increased due to efforts associated with positioning Government Systems business for new growth opportunities, offset by lower A350 development costs in Commercial Systems • Customer funded R&D increased primarily due to the following: • Higher development costs for international programs in Commercial Systems • Higher costs for next generation avionics programs in Government Systems • Higher amortization of pre-production engineering costs • Decreased investment in pre-production engineering driven by lower development costs for A350 18.8% 18.8% % of Sales
  • 9.
    © 2015 RockwellCollins All rights reserved. 9 09/30/14 09/30/15 Cash and cash equivalents 323$ 252$ Short-term Debt (504) (448) Long-term Debt (1,663) (1,680) Net Debt (1,844)$ (1,876)$ Equity 1,889$ 1,880$ Debt To Total Capital 53% 53% Debt To EBITDA (1) 1.9x 1.7x ($ in millions) Capital Structure Status (1) See slide 11 for non-GAAP disclosures.
  • 10.
    © 2015 RockwellCollins All rights reserved. 10 Total Sales $5.3 Bil. to $5.4 Bil. Total Segment Operating Margins About 21.0% Earnings Per Share $5.20 to $5.40 Cash Flow from Operations $700 Mil. To $800 Mil. Research & Development Investment About $1 Bil. Capital Expenditures About $200 Mil. FY 2016 Guidance
  • 11.
    © 2015 RockwellCollins All rights reserved. 11 The Non-GAAP ratio of debt to EBITDA information included on slide nine is believed to be useful to investors’ understanding and assessment of the Company’s total capital structure and liquidity. The Company does not intend for the information to be considered in isolation or as a substitute for the related GAAP measures. The table below explains the debt to EBITDA calculation in more detail for the twelve-month period from October 1, 2013 through September 30, 2014 and the twelve-month period from October 1, 2014 through September 30, 2015 (unaudited, in millions). All businesses reported as discontinued operations have been excluded from the debt to EBITDA calculation. Non-GAAP Financial Information 12 months ended 9/30/14 9/30/15 Income from continuing operations before income taxes $ 882 $ 962 Interest expense 59 61 Depreciation 141 152 Amortization of intangible assets and pre-production engineering costs 84 100 Earnings before interest, taxes, depreciation and amortization (EBITDA) $ 1,166 $ 1,275 9/30/14 9/30/15 Total debt $ 2,167 $ 2,128 Debt to EBITDA 1.9x 1.7x
  • 12.
    © 2015 RockwellCollins All rights reserved. 12