What is the time for Gold & Silver?
•
0 likes•2,682 views

Scutify All-Star Michael Haynes who is also the CEO of The American Precious Metals Exchange (APMEX) talks about Gold and Silver and how it may be time to diversify due to uncertainty in the world.

Recommended
Recommended
More Related Content
What's hot
What's hot (19)
Similar to What is the time for Gold & Silver?
Similar to What is the time for Gold & Silver? (20)
More from Scutify
More from Scutify (18)
Recently uploaded
Recently uploaded (20)
What is the time for Gold & Silver?
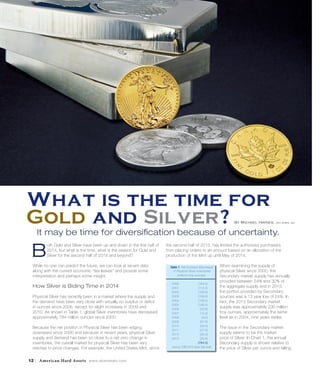
- 1. S E C T I O N N A M E | Story Name 12 | American Hard Assets www.ahametals.com B oth Gold and Silver have been up and down in the first half of 2014, but what is the time, what is the season for Gold and Silver for the second half of 2014 and beyond? While no one can predict the future, we can look at recent data along with the current economic “tea leaves” and provide some interpretation and perhaps some insight. How Silver is Biding Time in 2014 Physical Silver has recently been in a market where the supply and the demand have been very close with virtually no surplus or deficit in ounces since 2006, except for slight increases in 2009 and 2010. As shown in Table 1, global Silver inventories have decreased approximately 784 million ounces since 2000. Because the net position in Physical Silver has been edging downward since 2000 and because in recent years, physical Silver supply and demand has been so close to a net zero change in inventories, the overall market for physical Silver has been very reactive to price changes. For example, the United States Mint, since the second half of 2013, has limited the authorized purchasers from placing orders to an amount based on an allocation of the production of the Mint up until May of 2014. When examining the supply of physical Silver since 2000, the Secondary market supply has annually provided between 24% and 30% of the aggregate supply and in 2013, the portion provided by Secondary sources was a 13 year low of 24%. In fact, the 2013 Secondary market supply was approximately 230 million troy ounces, approximately the same level as in 2004, nine years earlier. The issue in the Secondary market supply seems to be the market price of Silver. In Chart 1, the annual Secondary supply is shown relative to the price of Silver per ounce and falling By Michael Haynes, ceo apmex, inc It may be time for diversification because of uncertainty.
- 2. www.ahametals.com American Hard Assets | 13 Metals Market Report | H A R D A S S E T U P DAT E S Silver prices in 2012 and 2013 seem to be having a significant effect on the decisions in the Secondary Silver market to submit Silver for refining. Although there are many factors in the supply of Silver, it appears that Silver prices may have an impact on the inflow from Secondary sources and perhaps may cause mining activity to slow. Chart 1.Annual Secondary Source of Silver and Silver Price per Troy Ounce, 2000-2013. in 2000 to a record level of over 136 million troy ounces in 2013, an increase of over 260% and an increase of 43% from 2012 to 2013. In Chart 3, it appears that lower Silver prices in 2013 did not inhibit investment coinage demand, but on the contrary, such demand increased to record levels. Chart 3. Annual Physical Investment Demand in Silver Coinage and Price perTroy Ounce, 2000-2013. From the demand side of Silver, there is evidence of rapidly increasing demand in Photovoltaics (batteries and solar devices), increasing in demand by 46% in 2013 over 2012. Shown in Chart 2 are the major segments of fabrication demand in Silver since 2000. Generally speaking, lower Silver prices should have a positive effect on demand from the largest segment of demand in Jewelry/Silverware as lower prices should stimulate more demand. Chart 2.Annual Fabrication Demand for Silver in Troy Ounces by Segment, 2000-1013. The final section of demand is from investment measured by Silver bullion coin production in the six main issuing countries of the United States, Canada, Austria, Germany, Mexico and China along with other countries consuming physical Silver in coin production. The investment coin Silver demand has grown from approximately 38 million troy ounces Will the alarm go off in Silver? With Silver prices hovering around $20 per troy ounce, the historical data would indicate that supplies of Silver, especially from the Secondary markets, will be constricted. On the demand side, industrial use of Silver will not be inhibited by lower Silver prices and perhaps fabrication demand may increase in the Jewelry/Silverware segment as prices remain relatively low compared to the prior three years. Also affecting Silver demand, investment coinage does not appear to be negatively impacted by lower Silver prices, but on the contrary, investment coinage demand rose in 2013 to record levels and the year to date mintage by the United States Mint seems to be approximately the same pace in 2014 as 2013. Accordingly, will Silver prices rise given the pressure applied by lower supply and potentially rising demand? While no one can predict the future, it appears that the clock is ticking on physical Silver. Gold May be Waiting for the Bell to Ring Gold supply is proportionately more reliant on mining than secondary sources over the last nine quarters with mining providing on the average 67% of the market supply for the entire period, but in the last four quarters ended March 31, 2014, mining has provided a higher portion of total market supply of 73%, 70%, 72% and 69%, respectively, of total market supply. The converse of this Gold supply is secondary sources which have been, not surprisingly, below recent historical levels. Chart 4 shows that for the last five quarters ended March 31, 2014, secondary sources of Gold have consistently fallen below levels established in the previous four quarters ended December 31, 2012. This means that physical Gold supply has been hindered for the entire year of 2013 and continuing in the first quarter of 2014.
- 3. 14 | American Hard Assets www.ahametals.com Note that the Net Investment Demand did contract for the four consecutive quarters ended December 31, 2013, however, this was caused primarily by the liquidations from the Gold ETFs. The data shows that the Physical Gold Bar and Coin investment demand was more than sufficient to offset the ETF liquidations. In fact, Physical Gold Bar and Coin demand increased each quarter for the four consecutive quarters ended June 30, 2013, with physical investors in contradiction to ETF investors during most of this period. Many believe that the Gold ETF has more investors with short term trading windows, perhaps a day up to a month in duration, while Physical Gold Bar and Coin investors have a longer term outlook, perhaps three to five years. When will time strike midnight and awake the Gold market? From the supply side, Gold is meeting the demand with a decreasing contribution from the secondary sources, which sources are unlikely to increase without a price rise to attract more of the Gold product ready for recycling. From the demand side, all of the segments of Gold demand, except for Investment demand, are relatively stable for the last nine quarters. Investment Gold demand recorded a net contraction in recent quarters but only as a result of Gold ETFs shedding ounces which were readily absorbed by the Physical Gold Bar and Coin demand. With the supply and demand for Gold appears to bring on the two factors, (1) secondary market supply influenced by current Gold prices, and (2) Investment demand influenced by relatively strong long term oriented Physical Gold Bar and Coin demand and short term oriented Gold ETF demand. Accordingly, the it appears that the time for Gold awakening may be an event in the global economic markets or a global political event that causes the short term investors to expand Gold ETF demand which would also likely increase the long term investors demand for Physical Gold Bar and Coin demand. For those awaiting such an event, look to the European Union and the Euro and to the upcoming United States Congressional elections in November 2014, which in both cases may provide evidence of the coming economic course. H A R D A S S E T U P DAT E S | Metals Market Report Chart 4.Quarterly Secondary Source of Gold and Gold Price per Troy Ounce, Q1 2012 – Q1 2014. Chart 6.Quarterly Net Investment Demand for Gold in Troy Ounces, Q1 2012 – Q1 2014. When examining the demand for Gold, it is evident in Chart 5 that the demand in Jewelry, Technology and even in Central Bank purchases is relatively consistent, quarter after quarter for the last nine months. However, the Investment demand seems to expand and contract, expanding during the three consecutive quarters ended December 31, 2012, yet contracting for the four consecutive quarters ended December 31, 2013. For the quarter ended March 31, 2014, Investment demand expanded by 47% over the quarter ended December 31, 2013. Chart 5.Quarterly Demand for Gold in Troy Ounces by Segment, Q1 2012 – Q1 2014. Even though the Investment demand has both expanded and contracted, Chart 6 shows the breakout of Investment demand between the Gold ETFs and Physical Gold Bar and Coin. (For the sake of clarity, according to the World Gold Council, the data for Physical God Bar and Coin demand relates only to the investor demand for the physical Gold and does not include any Gold Bars for any of the future exchanges.)