Download to read offline

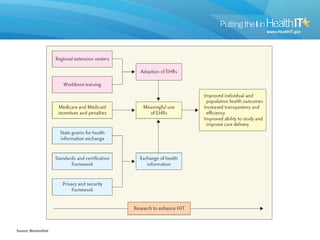
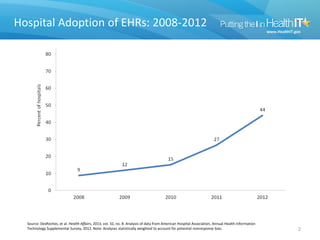
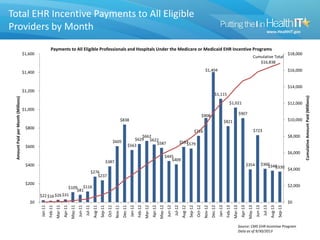

The document discusses health information technology adoption in the United States. It shows that hospital adoption of electronic health records increased substantially between 2008 and 2012. It also shows a graph of cumulative incentive payments made to eligible health providers under the Medicare and Medicaid EHR incentive programs, with over $16 billion paid out since the program's start in 2011. The economic incentives provided under these programs have successfully encouraged many health providers to adopt electronic health records and health information technology.


