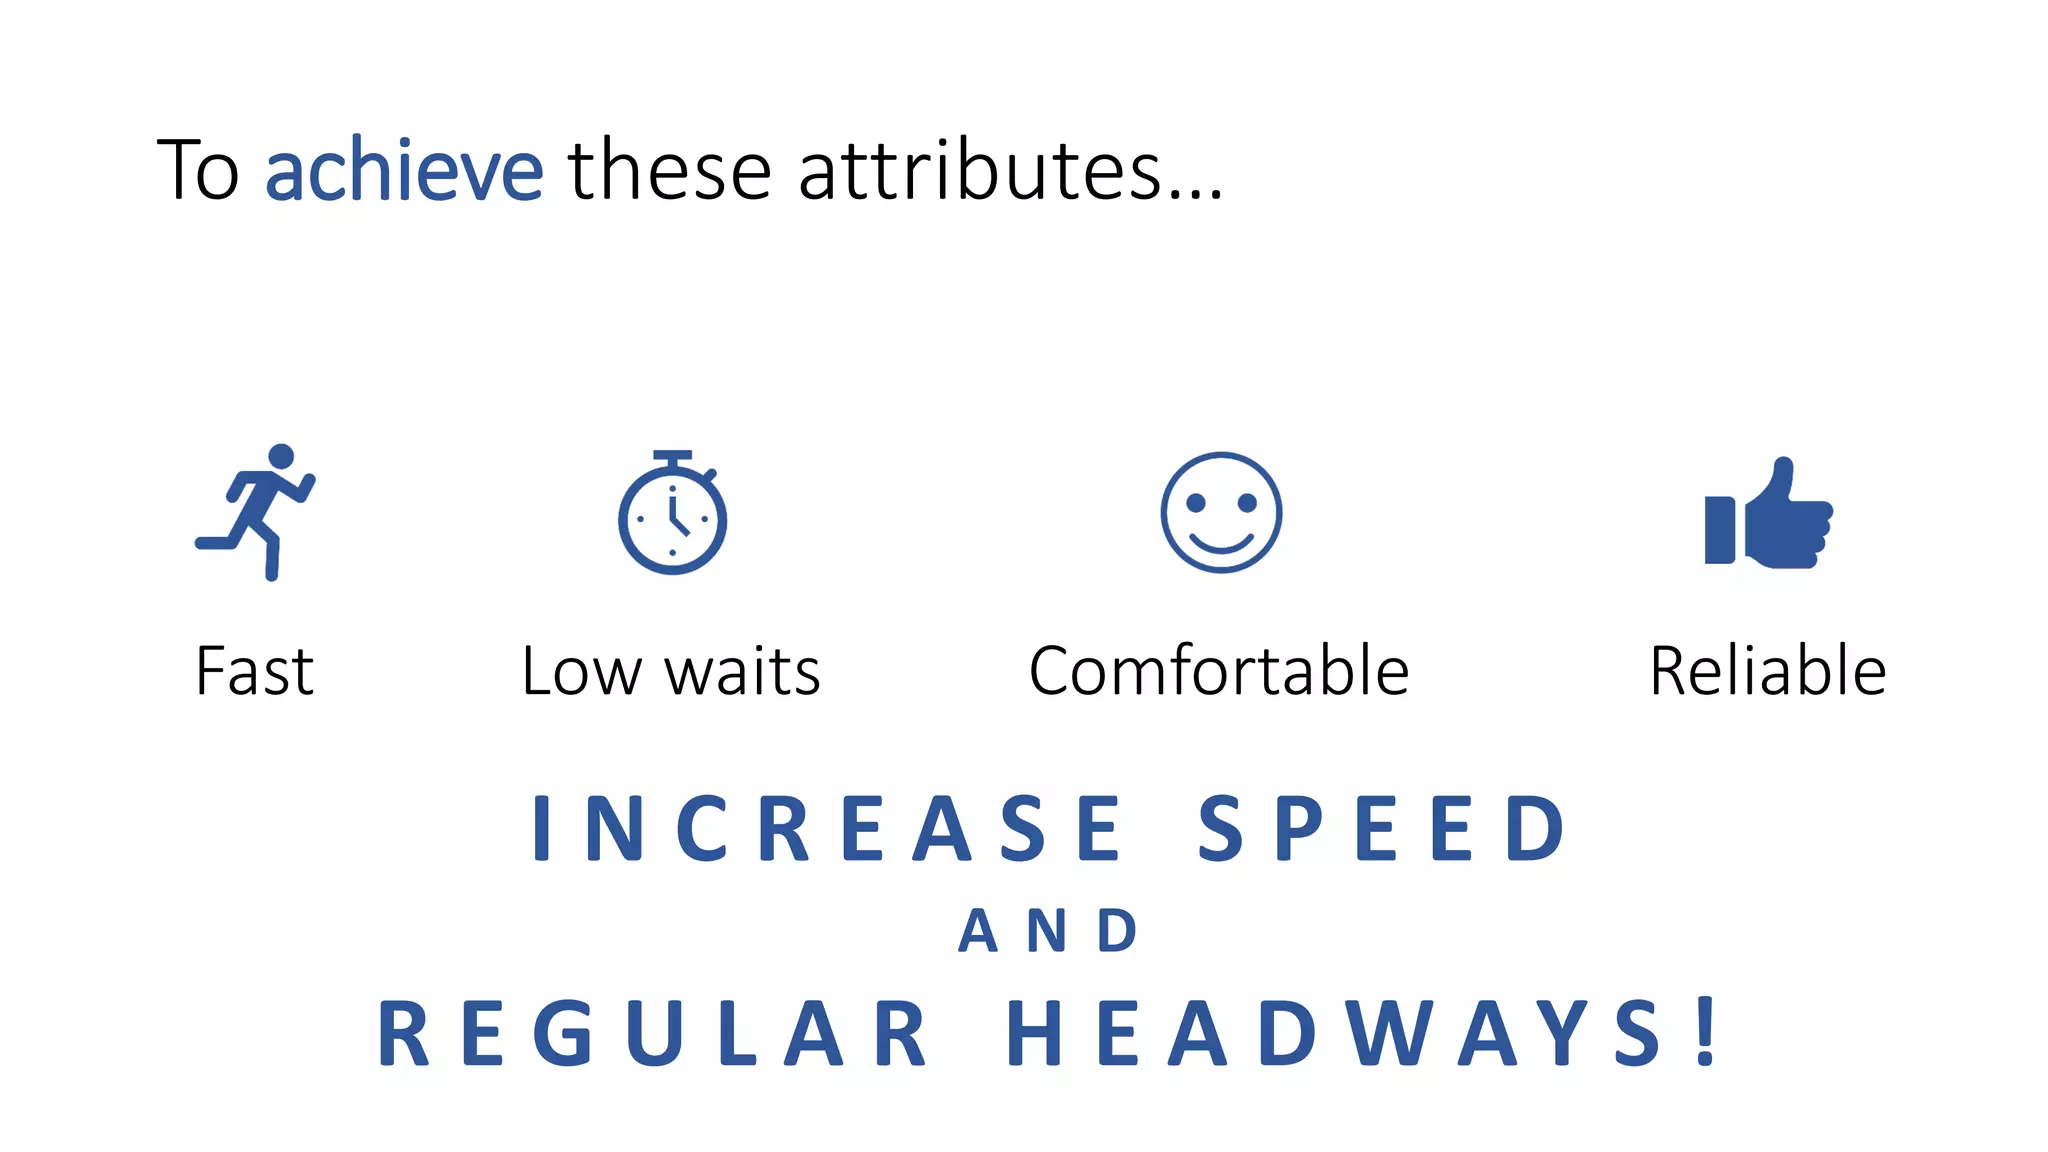
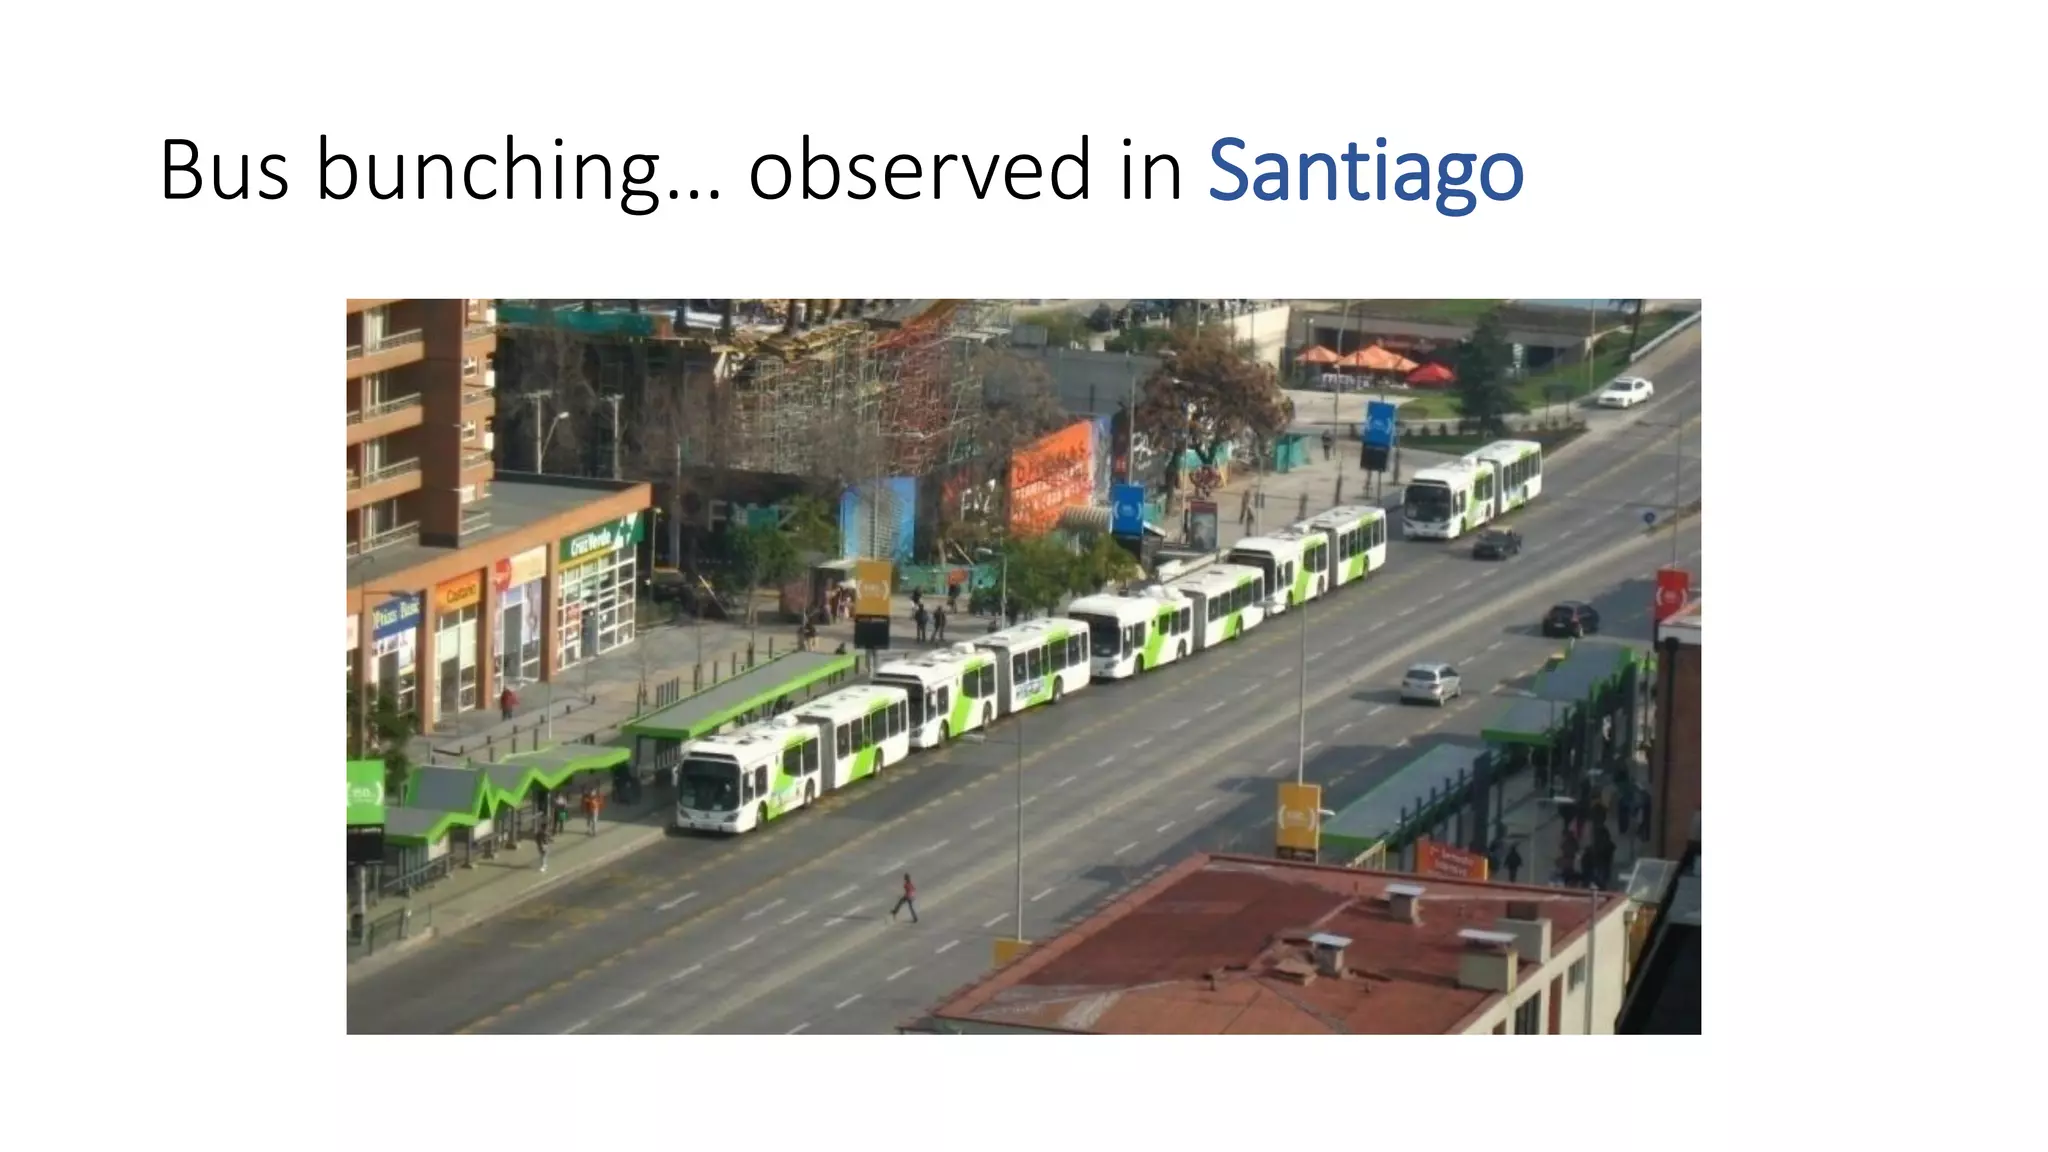
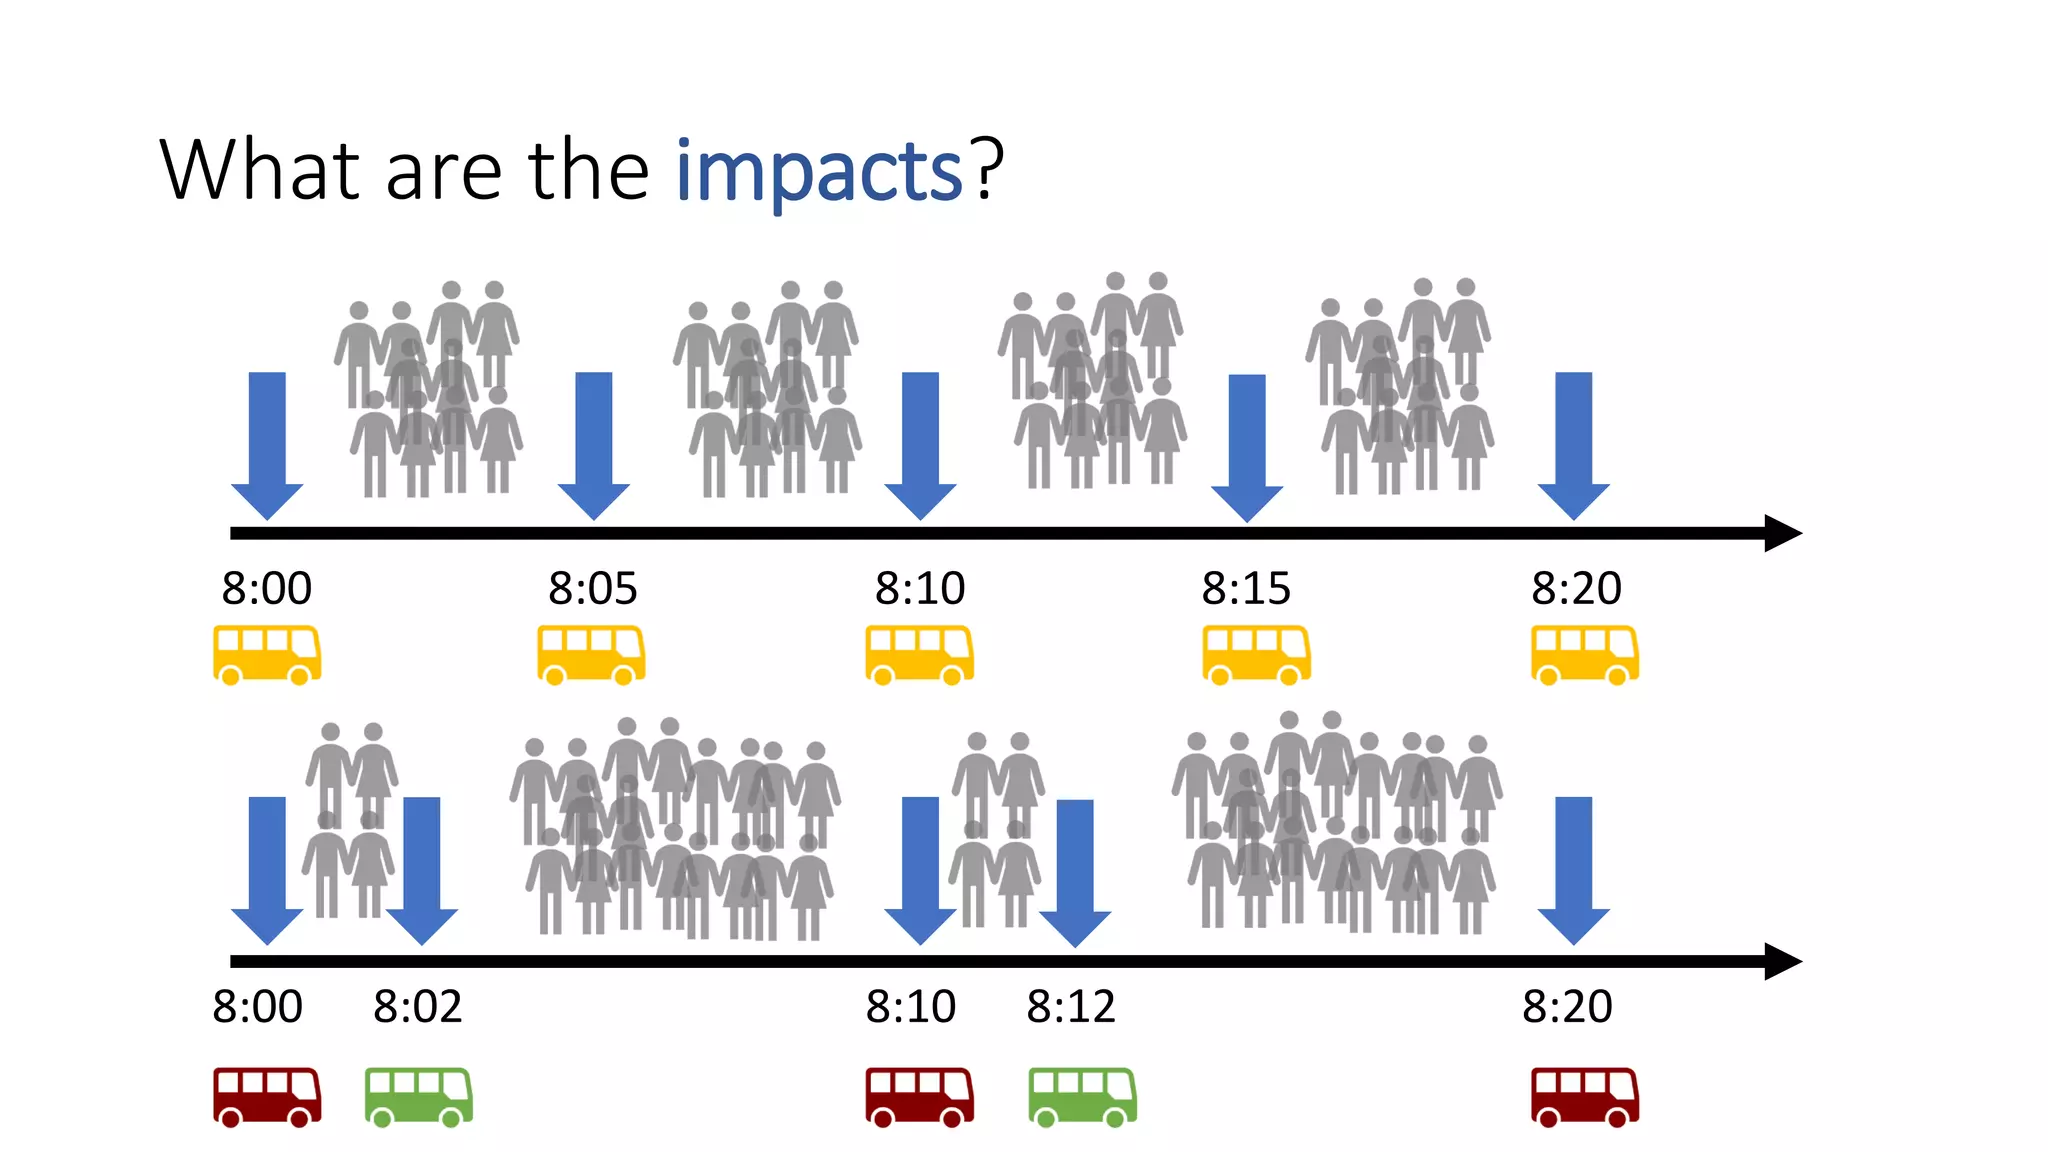
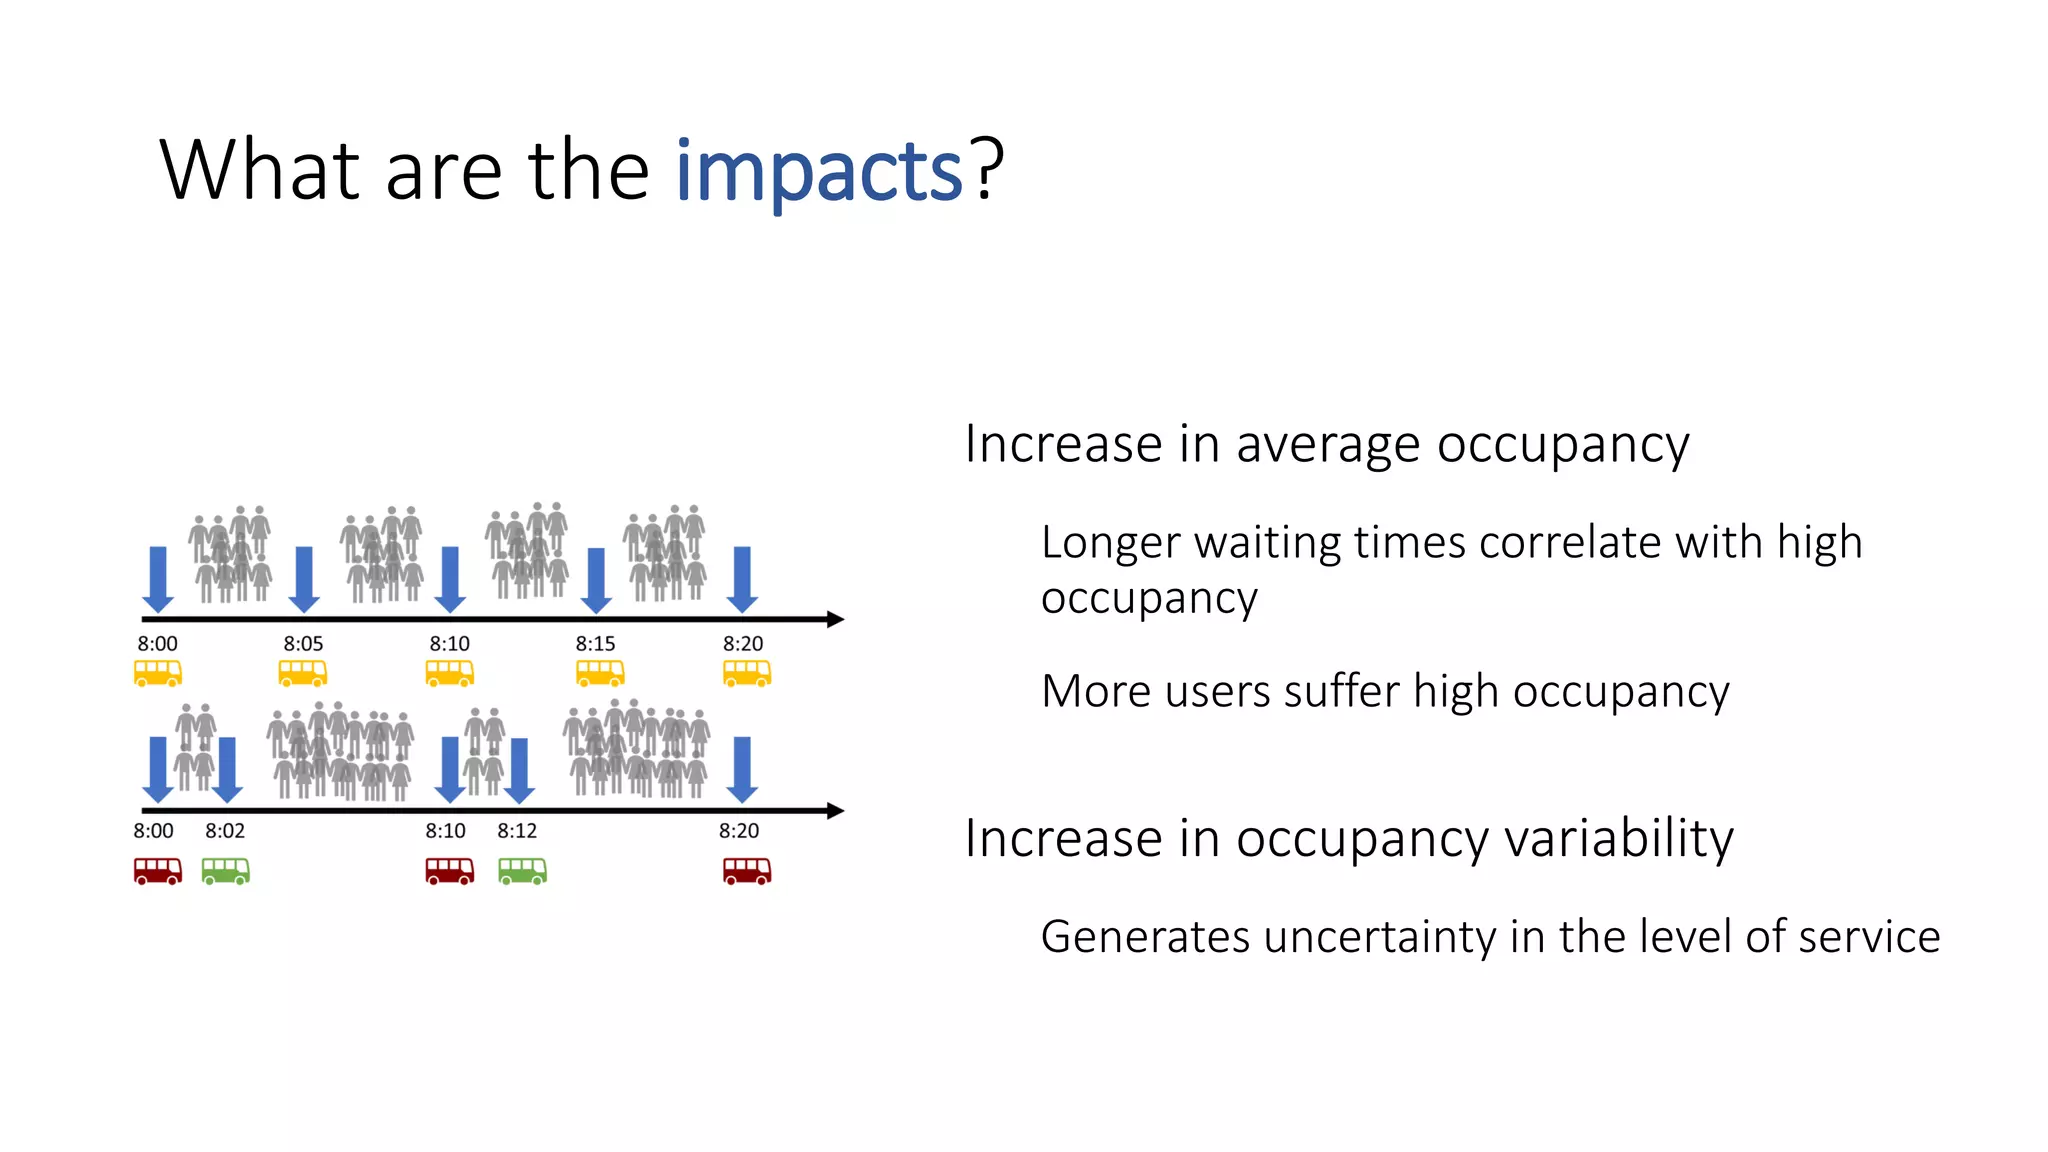
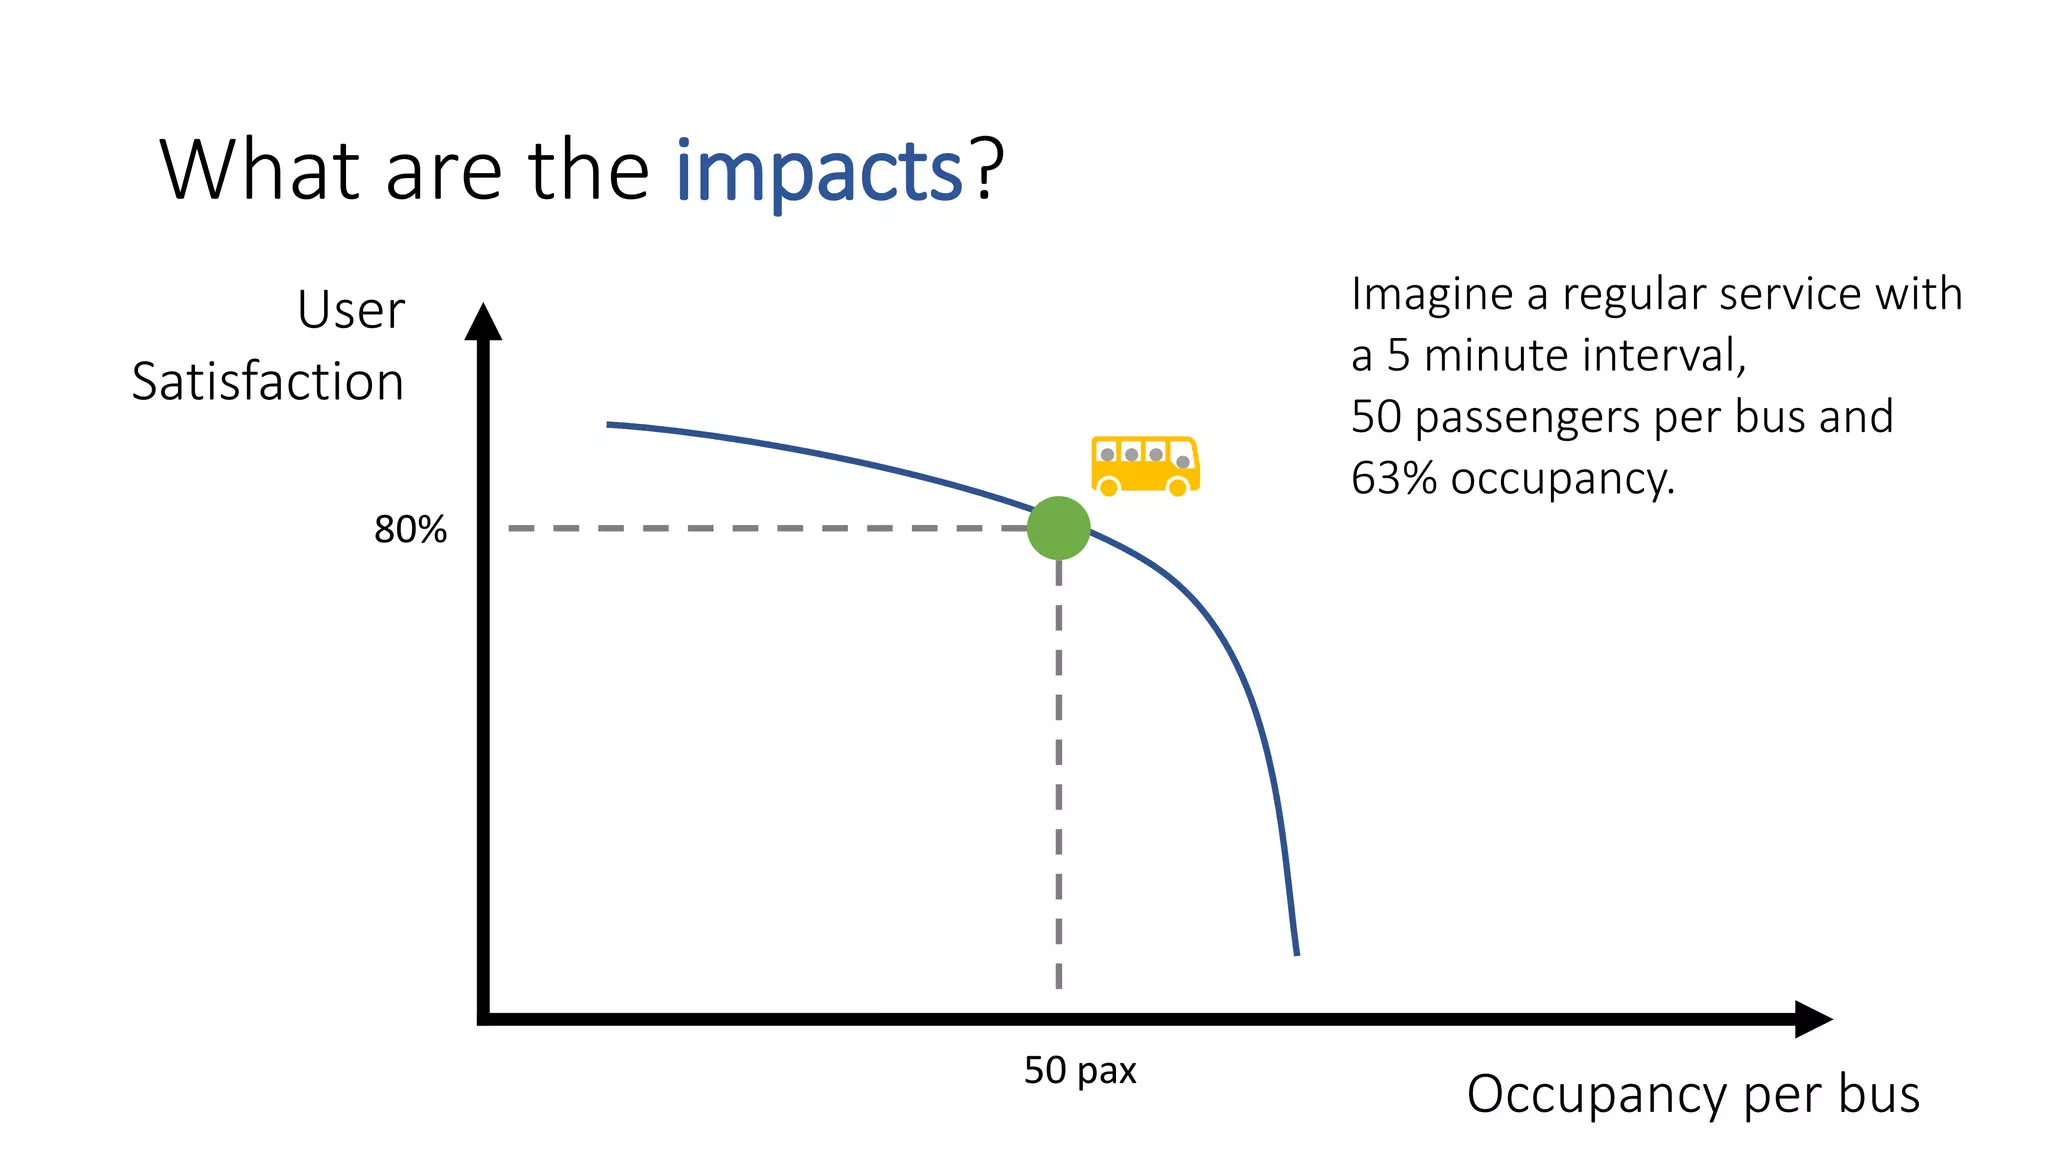
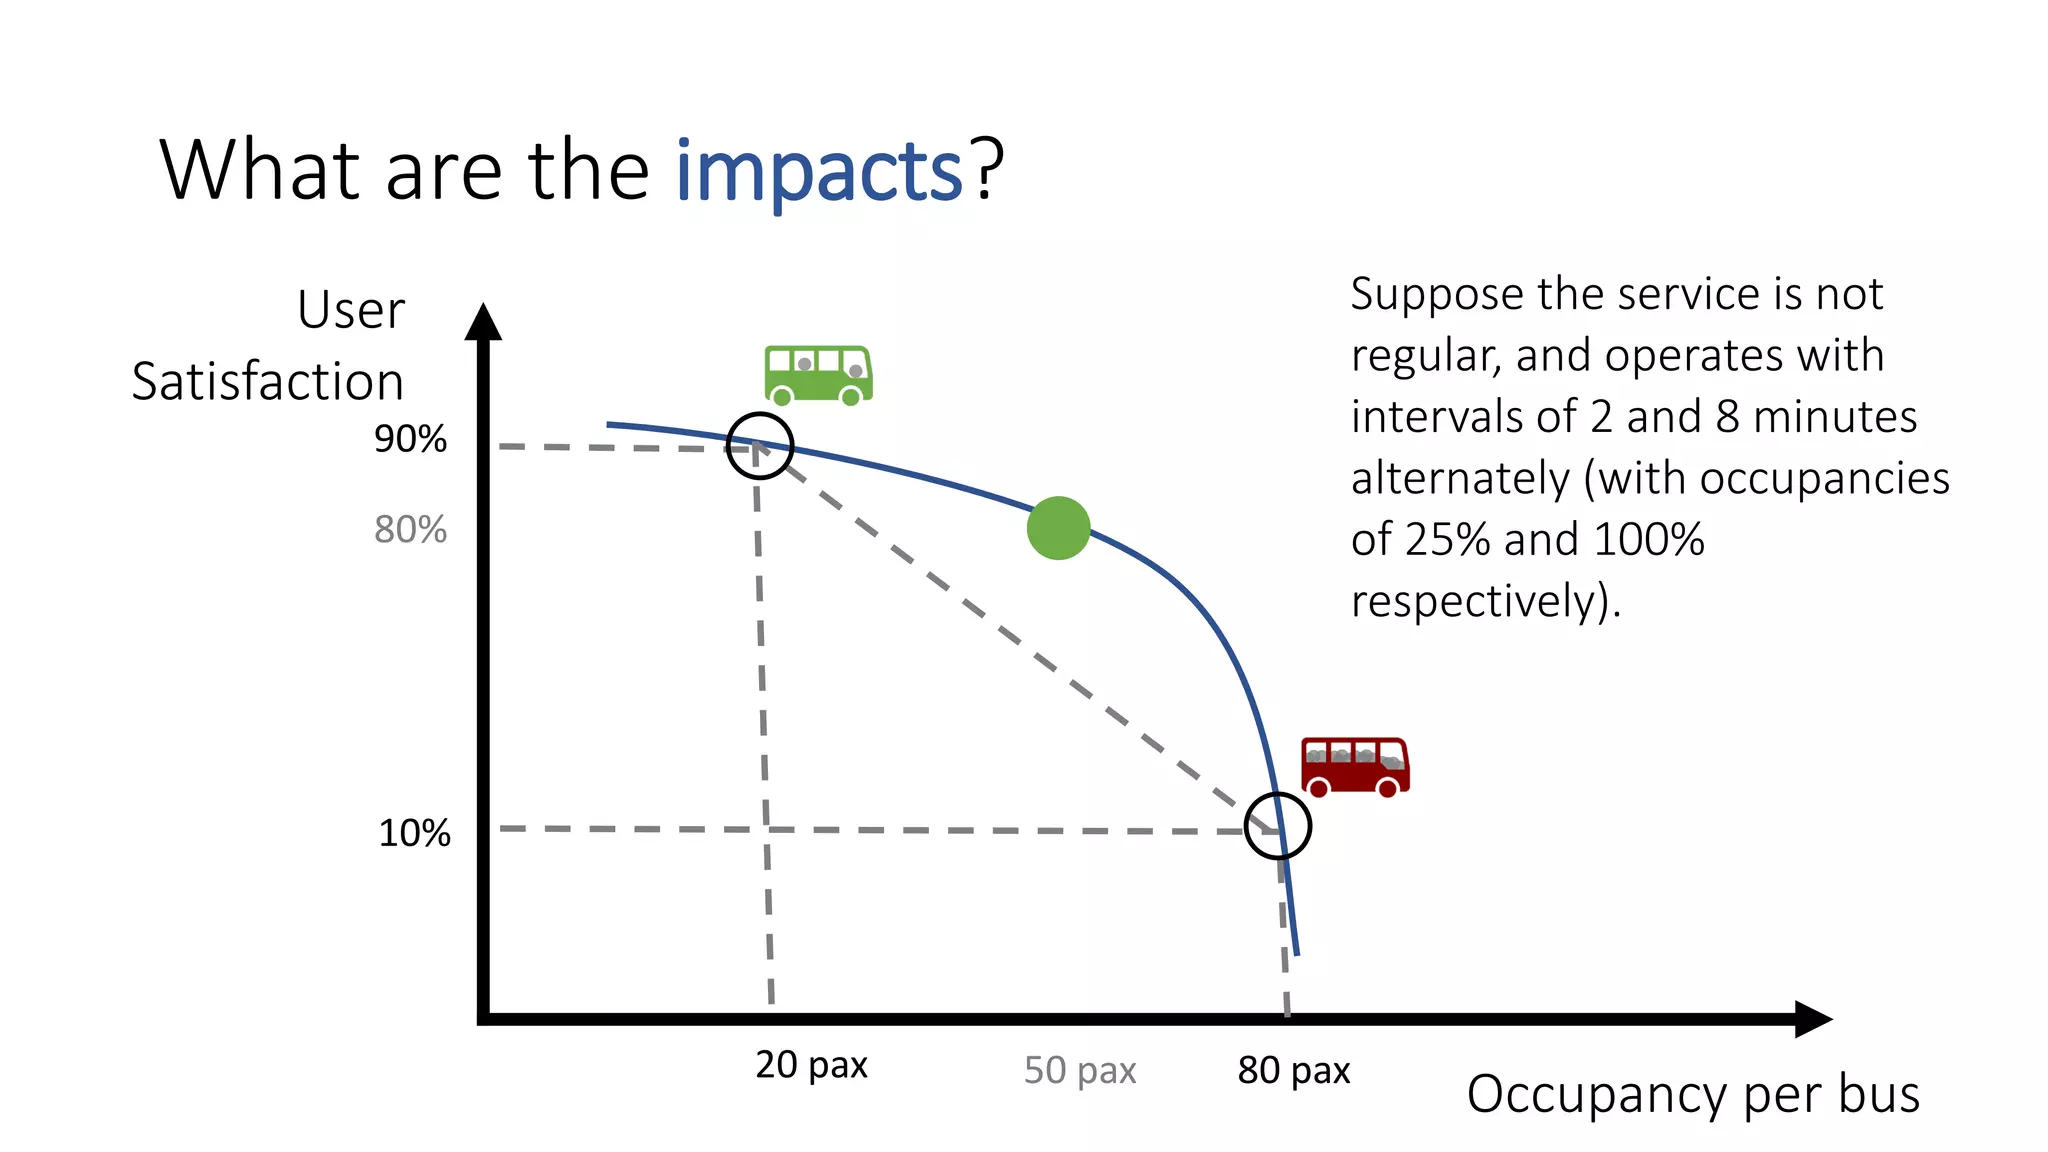
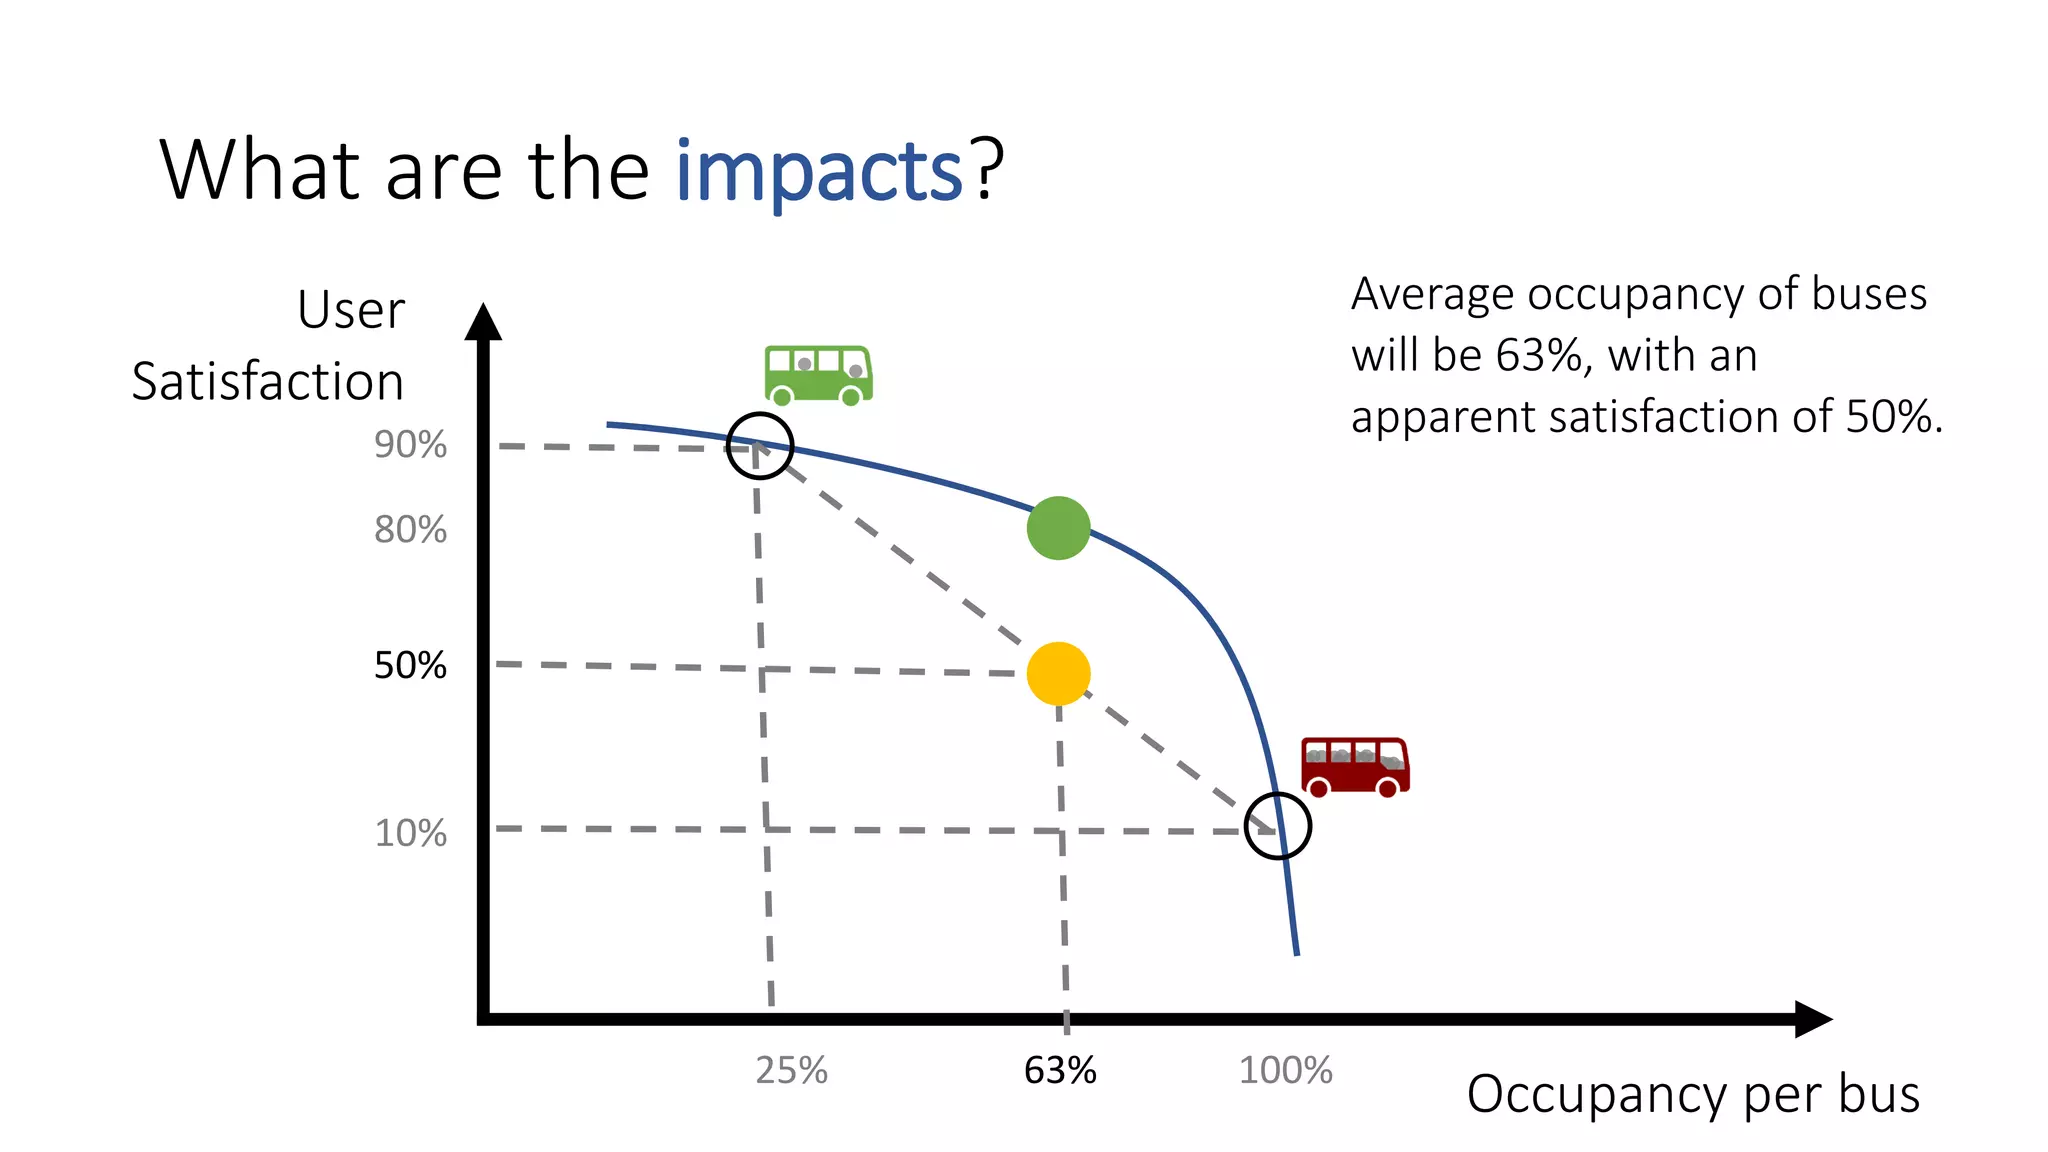
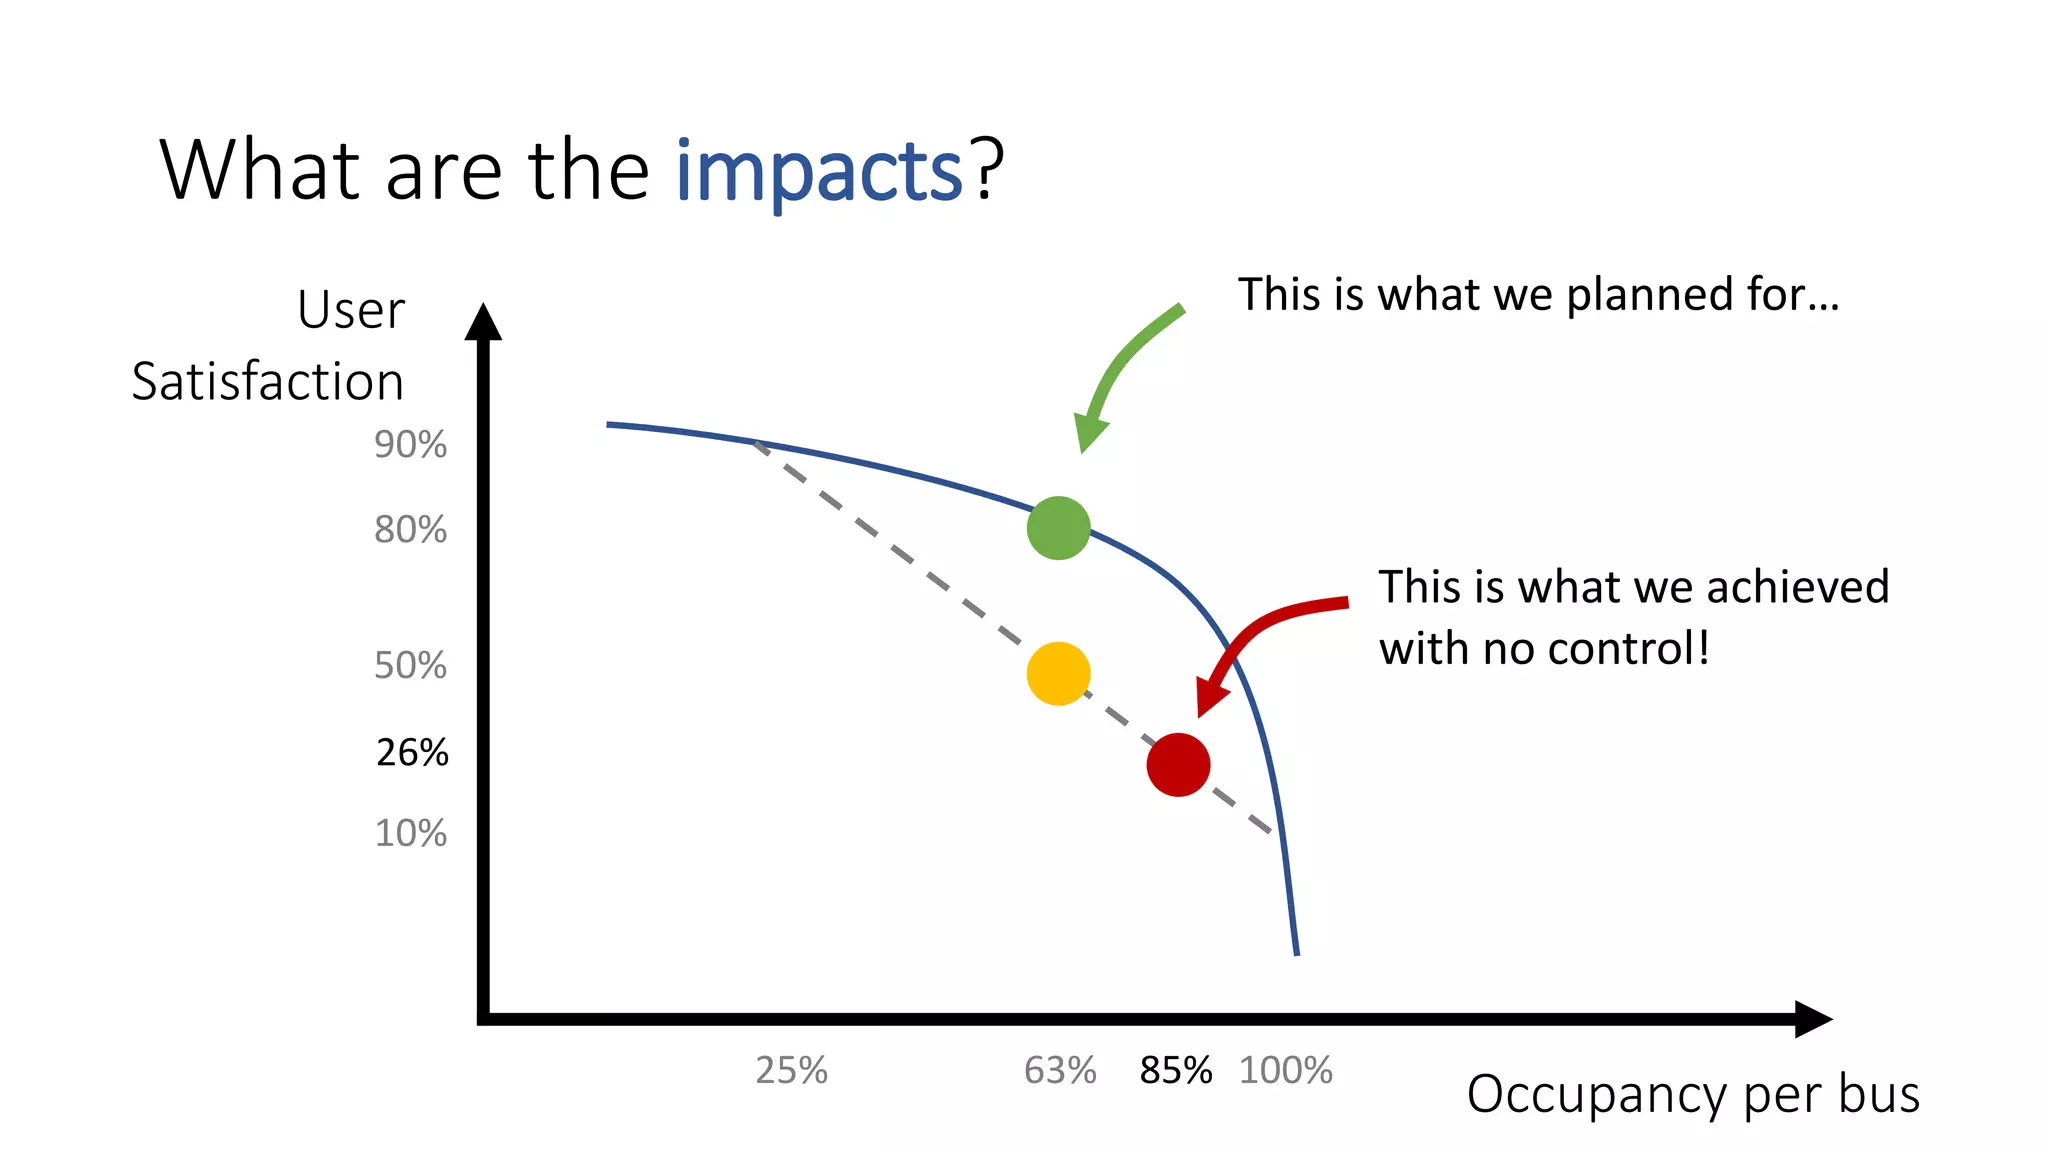
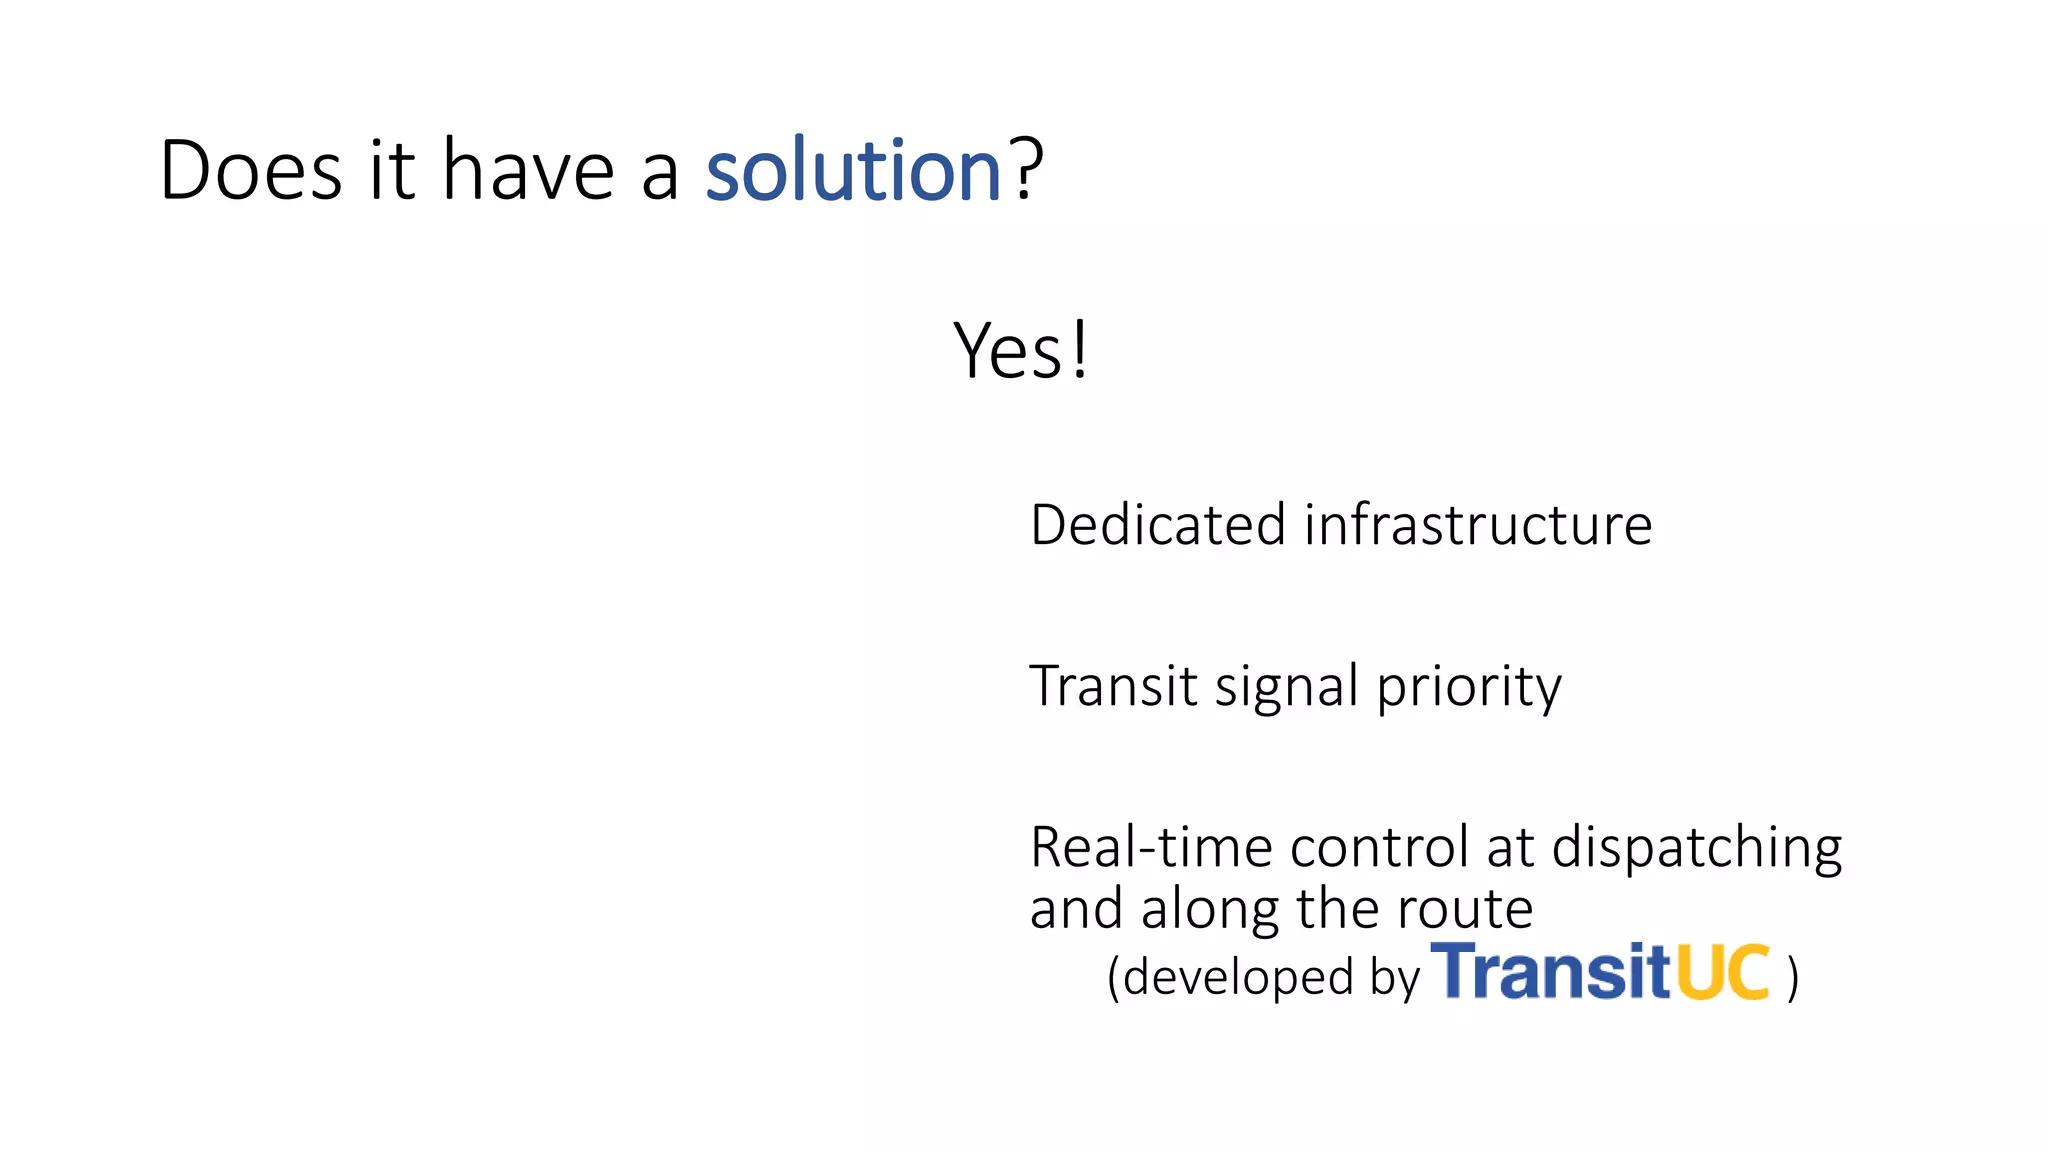
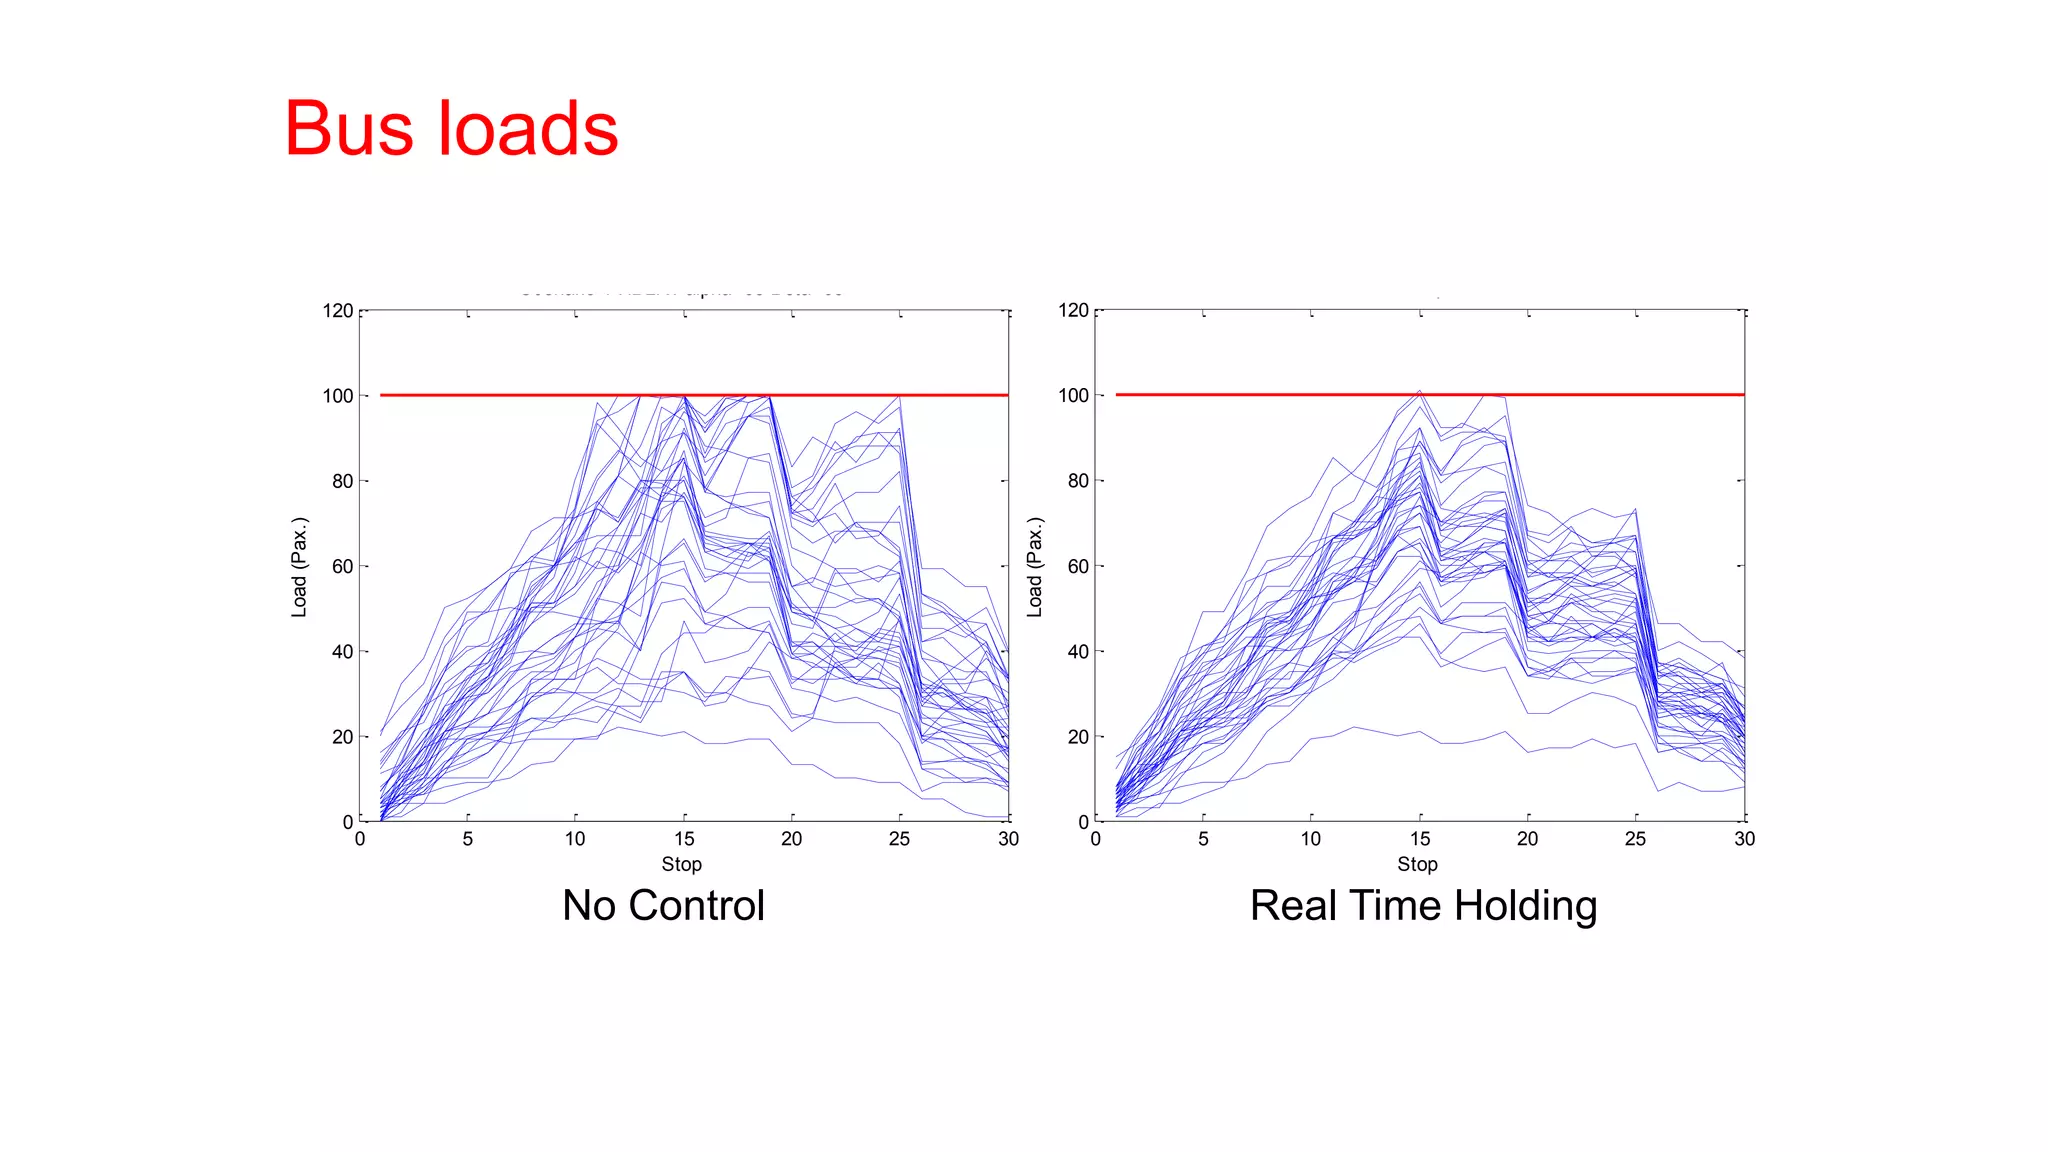
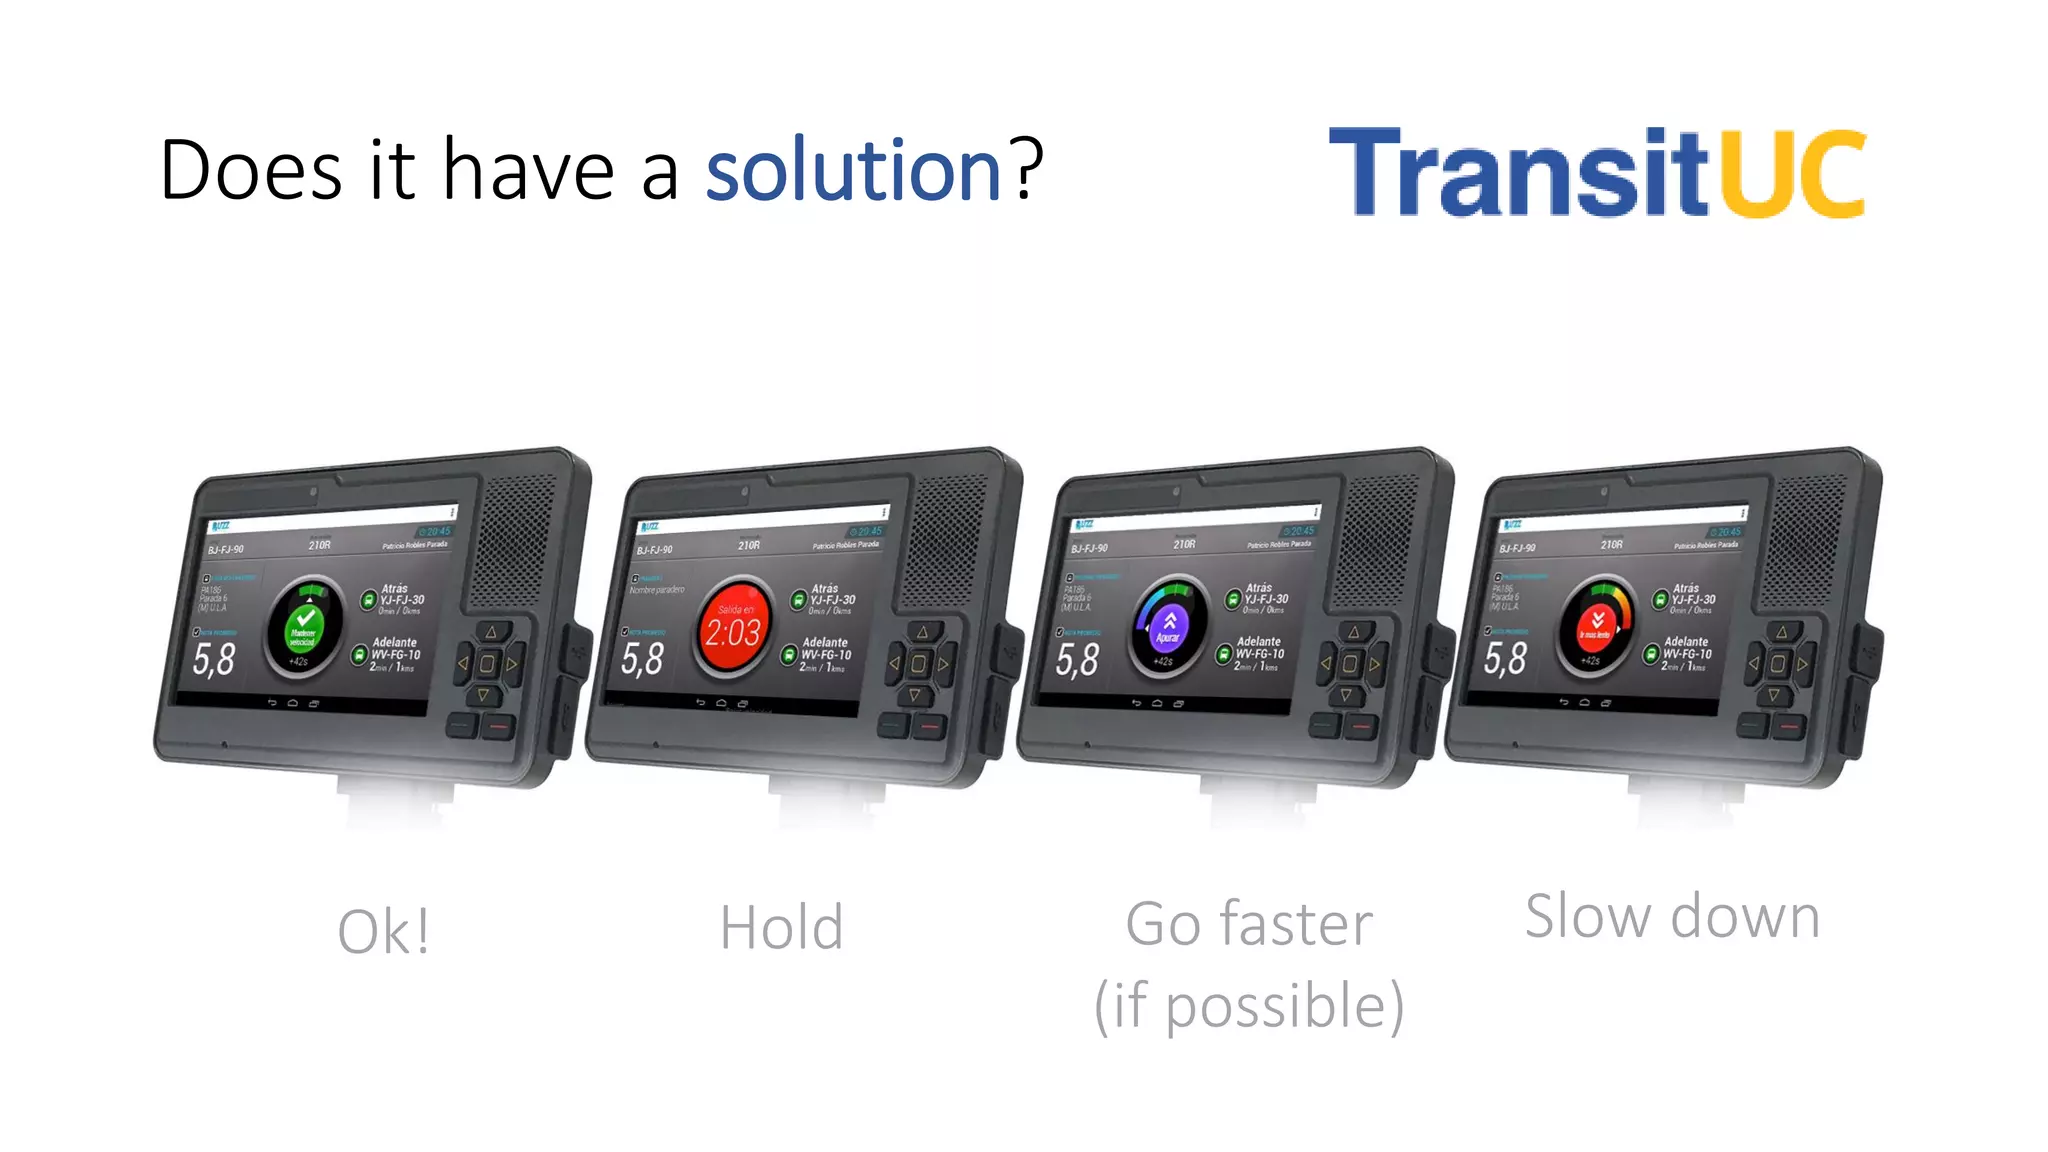
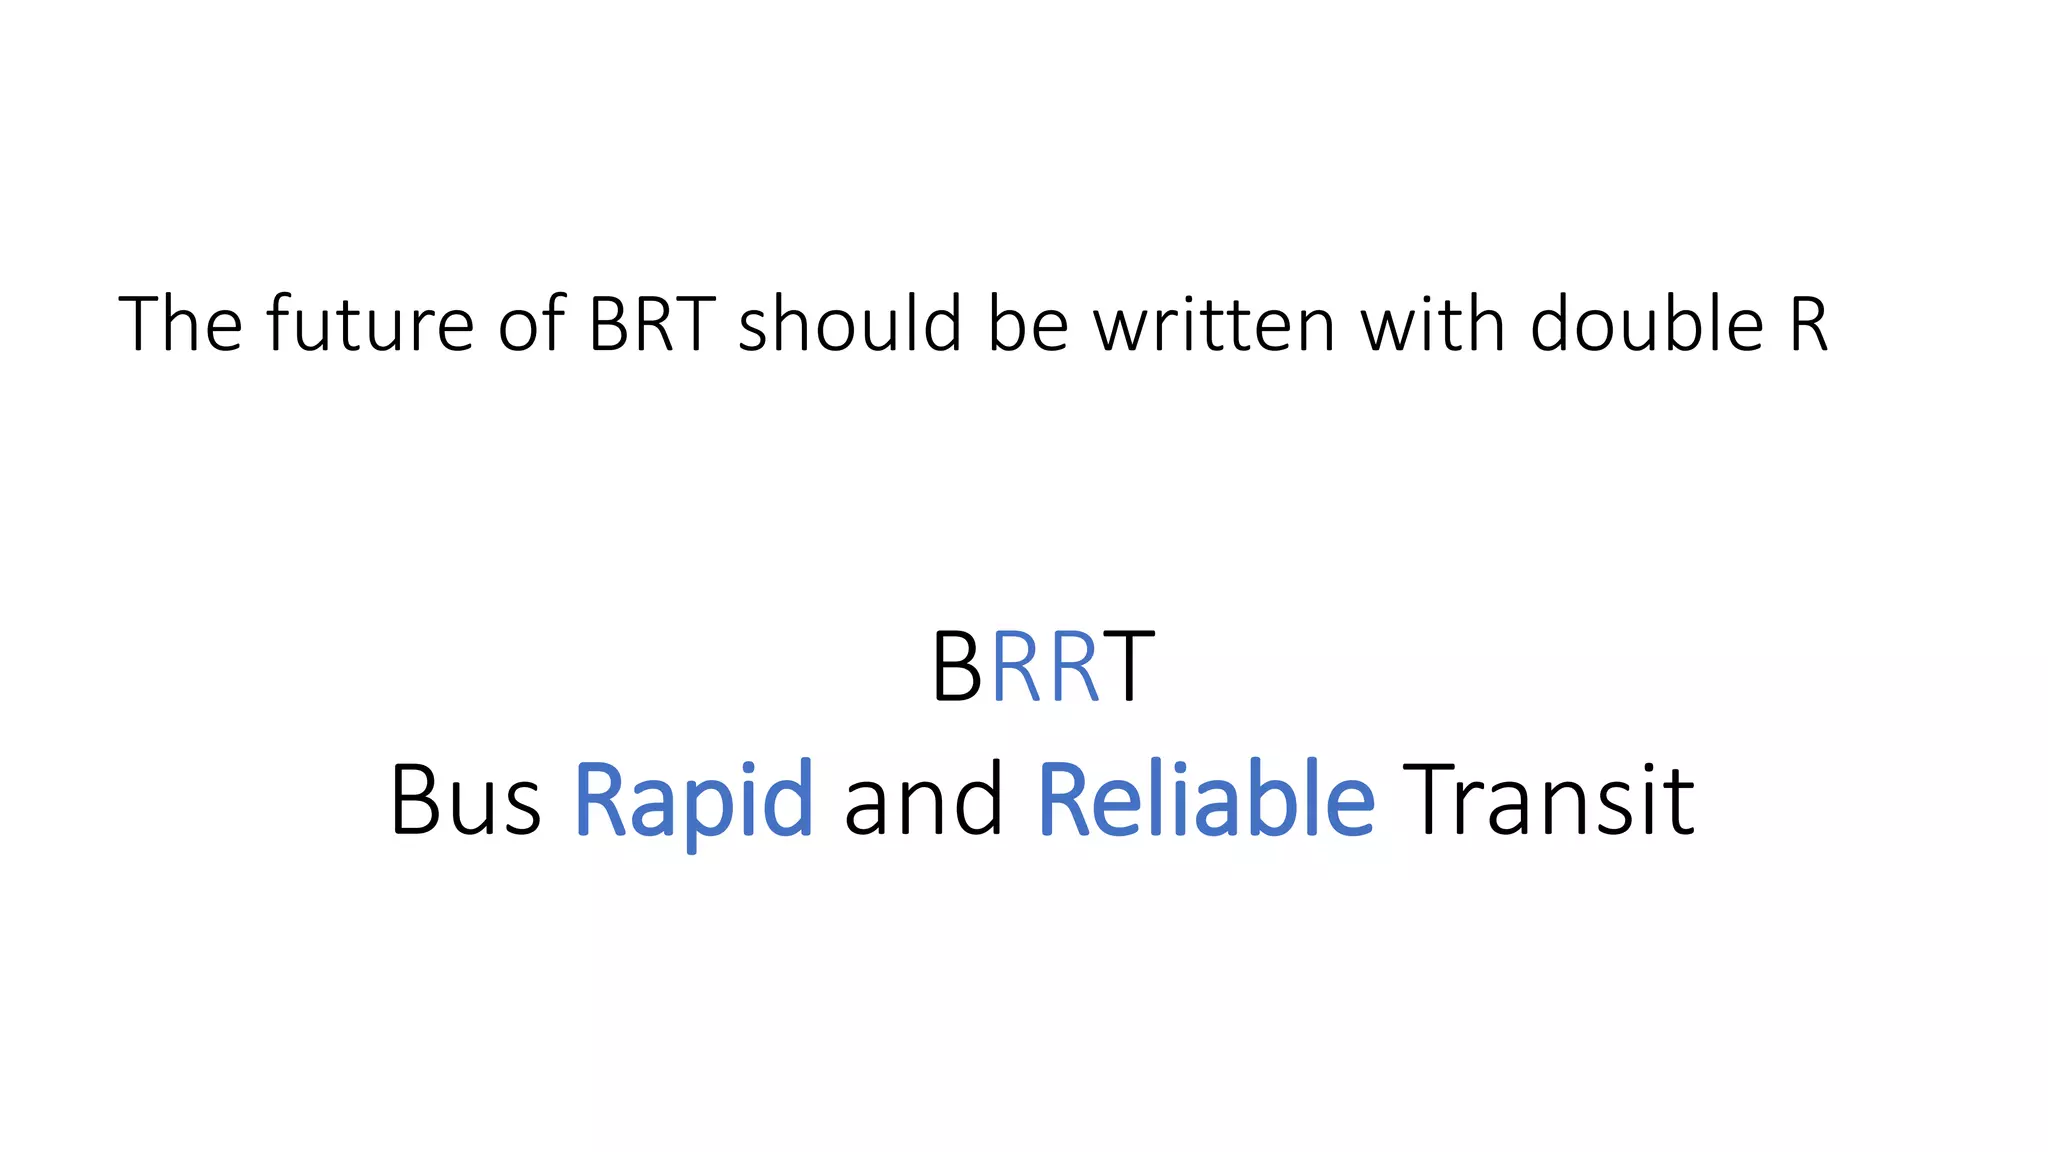
The full cost of bus headway variability and our
experience to achieve a regular service
Juan Carlos Munoz
Bus Rapid Transit Centre of Excellence
Centro de Desarrollo Urbano Sustentable, CEDEUS
Pontificia Universidad Católica de Chile
Hong Kong, December 8th, 2018
@JuanCaMunozA
Work done with collaborators at PUC
Cities need its citizens to use public transport
This is easier if citizens like their public transport,
if they are satisfied with its use
What do people seek when travelling
in public transport?
Fast Low waits Comfortable Reliable
How can we achieve these attributes?
DECREASE
TRAVEL TIME
INCREASE
FREQUENCY
INCREASE FLEET
OR
INCREASE SPEED
INCREASE
TRANSPORT CAPACITY
DECREASE
TRAVEL TIME VARIABILITY
Fast Low waits Comfortable Reliable
INCREASE SPEED
INCREASE FLEET, VEHICLE SIZE
OR
INCREASE SPEED
REGULAR HEADWAYS
To achieve these attributes….
Fast Low waits Comfortable Reliable
INCREASE SPEED!
AND THEN MAYBE IF WE
HAVE SPARE TIME FOCUS
ON REGULAR HEADWAYS….
BRT : Bus Rapid Transit
But… is this enough?
What about reliability?
What are the impacts of an unreliable service?
To achieve these attributes…
Fast Low waits Comfortable Reliable
I N C R E A S E S P E E D
A N D
R E G U L A R H E A D W A Y S !
Vehicles in public transport systems
behave like magnets….
Any perturbation and the equilibrium is lost… all around the world.
Regular intervals is an unstable equilibrium
Bus bunching… observed in London
Bus bunching… observed in Beijing
Bus bunching… observed in Boston
Bus bunching… observed in Santiago
Today we will address three questions
Why does bus bunching happen?
What are the impacts?
1
2
Does it have a solution?3
Why does bus bunching happen?
• Dispatch strategy
• Speed variability
• Travel time variability
• Dwell time variability
Why does bus bunching happen?
Time (minutes)
Position (km)
Why does bus bunching happen?
• Dispatch strategy
• Speed variability
• Travel time variability
• Dwell time variability
Why does bus bunching happen?
Congestion Traffic lights Driver heterogeneity
Travel time variability
Why does bus bunching happen?
Stochastic passenger arrivals
at each stop
Dwell time variability
Today we will address three questions
Why does bus bunching happen?
What are the impacts?
1
2
Does it have a solution?3
What are the impacts?
Impacts are various, affecting:
Users Operators
What are the impacts?
• Consider the following bus service
• 5 min average headway
• 80-pax capacity buses
• An average demand of 50 pax/bus
What are the impacts?
8:00 8:05 8:10 8:15 8:20
8:00 8:02 8:10 8:12 8:20
What are the impacts?
• Increase in average occupancy
• Longer waiting times correlate with high
occupancy
• More users suffer high occupancy
• Increase in occupancy variability
• Generates uncertainty in the level of service
What are the impacts?
• Increase in waiting times
• One minute of waiting is perceived as
two or three minutes of in-vehicle time
• Increase in the variability of waiting
times
• Leads to earlier departures for users
What are the impacts?
• Increase in dwell times
• Boarding and alighting is slow
and creates friction between passengers
• Increase in the variability of dwell time
• Damages the reliability of the service
• Operators need extra fleet and drivers due
to variable cycle times
Cities need its citizens to use public transport
This is easier if citizens like their public transport,
if they are satisfied with its use
Cities need its citizens to use public transport
This is easier if citizens like their public transport,
if they are satisfied with its use
How does reliability affect user satisfaction?
What are the impacts?
User
Satisfaction
Occupancy per bus
What are the impacts?
User
Satisfaction
Occupancy per bus50 pax
80%
Imagine a regular service with
a 5 minute interval,
50 passengers per bus and
63% occupancy.
What are the impacts?
User
Satisfaction
50 pax
80%
Suppose the service is not
regular, and operates with
intervals of 2 and 8 minutes
alternately (with occupancies
of 25% and 100%
respectively).
90%
20 pax 80 pax
10%
Occupancy per bus
What are the impacts?
User
Satisfaction
63%
80%
90%
25% 100%
Average occupancy of buses
will be 63%, with an
apparent satisfaction of 50%.
50%
10%
Occupancy per bus
What are the impacts?
User
Satisfaction
63%
80%
90%
25% 100%
Average occupancy of
perceived by users will be
85%, with a satisfaction level
of only 26%!
50%
85%
26%
10%
Occupancy per bus
What are the impacts?
User
Satisfaction
63%
80%
90%
25% 100%
50%
85%
26%
10%
This is what we planned for…
This is what we achieved
with no control!
Occupancy per bus
To achieve these attributes…
Fast Low waits Comfortable Reliable
I N C R E A S E S P E E D
A N D
R E G U L A R H E A D W A Y S !
Today we will address three questions
Why does bus bunching happen?
What are the impacts?
1
2
Does it have a solution?3
Does it have a solution?
•Yes!
• Dedicated infrastructure
• Transit signal priority
• Real-time control at dispatching
and along the route
• (developed by )
Does it have a solution?
Source: mto.gov.on.ca
Does it have a solution?
No control
With control
Color indicates
bus load!
Time-space trajectories
0 20 40 60 80 100 120
0
1
2
3
4
5
6
7
8
9
10
s2 NETS sc corrida17Distance(Km)
Time(minutes)
Real Time Holding
0 20 40 60 80 100 120
0
1
2
3
4
5
6
7
8
9
10
Scenario 1 threshold run17
Distance(Km)
Time(minutes)
No Control
Bus loads
0 5 10 15 20 25 30
0
20
40
60
80
100
120
Scenario 1 HBLRT alpha=05 Beta=05
Load(Pax.)
Stop
0 5 10 15 20 25 30
0
20
40
60
80
100
120
Scenario 1 HBLRT alpha=05 Beta=05
Load(Pax.)
Stop
No Control Real Time Holding
Cycle times
25 30 35 40 45
0
50
100
150
200
250
300
350
mean =33.64
Std.Dev. =3.51
No control
Frequency
Cycle Time (Minutes)
25 30 35 40 45
0
50
100
150
200
250
300
350
mean =32.11
Std.Dev. =1.2
HRT 05
Frequency
Cycle Time (Minutes)
No Control Real Time Holding
Does it have a solution?
Ok! Hold Go faster
(if possible)
Slow down
Does it have a solution?
The future of BRT should be written with double R
BRRT
Bus Rapid and Reliable Transit
The full cost of bus headway variability and our
experience to achieve a regular service
Juan Carlos Munoz
Bus Rapid Transit Centre of Excellence
Centro de Desarrollo Urbano Sustentable, CEDEUS
Pontificia Universidad Católica de Chile
Hong Kong, December 8th, 2018
@JuanCaMunozA

Full cost reliability by Juan Carlos Muñoz

  • 1.
    The full costof bus headway variability and our experience to achieve a regular service Juan Carlos Munoz Bus Rapid Transit Centre of Excellence Centro de Desarrollo Urbano Sustentable, CEDEUS Pontificia Universidad Católica de Chile Hong Kong, December 8th, 2018 @JuanCaMunozA
  • 2.
    Work done withcollaborators at PUC
  • 3.
    Cities need itscitizens to use public transport This is easier if citizens like their public transport, if they are satisfied with its use
  • 4.
    What do peopleseek when travelling in public transport? Fast Low waits Comfortable Reliable
  • 5.
    How can weachieve these attributes? DECREASE TRAVEL TIME INCREASE FREQUENCY INCREASE FLEET OR INCREASE SPEED INCREASE TRANSPORT CAPACITY DECREASE TRAVEL TIME VARIABILITY Fast Low waits Comfortable Reliable INCREASE SPEED INCREASE FLEET, VEHICLE SIZE OR INCREASE SPEED REGULAR HEADWAYS
  • 6.
    To achieve theseattributes…. Fast Low waits Comfortable Reliable INCREASE SPEED! AND THEN MAYBE IF WE HAVE SPARE TIME FOCUS ON REGULAR HEADWAYS….
  • 7.
    BRT : BusRapid Transit
  • 8.
  • 10.
    What about reliability? Whatare the impacts of an unreliable service?
  • 11.
    To achieve theseattributes… Fast Low waits Comfortable Reliable I N C R E A S E S P E E D A N D R E G U L A R H E A D W A Y S !
  • 12.
    Vehicles in publictransport systems behave like magnets…. Any perturbation and the equilibrium is lost… all around the world. Regular intervals is an unstable equilibrium
  • 13.
  • 14.
  • 15.
  • 16.
  • 17.
    Today we willaddress three questions Why does bus bunching happen? What are the impacts? 1 2 Does it have a solution?3
  • 18.
    Why does busbunching happen? • Dispatch strategy • Speed variability • Travel time variability • Dwell time variability
  • 19.
    Why does busbunching happen? Time (minutes) Position (km)
  • 20.
    Why does busbunching happen? • Dispatch strategy • Speed variability • Travel time variability • Dwell time variability
  • 21.
    Why does busbunching happen? Congestion Traffic lights Driver heterogeneity Travel time variability
  • 22.
    Why does busbunching happen? Stochastic passenger arrivals at each stop Dwell time variability
  • 23.
    Today we willaddress three questions Why does bus bunching happen? What are the impacts? 1 2 Does it have a solution?3
  • 24.
    What are theimpacts? Impacts are various, affecting: Users Operators
  • 25.
    What are theimpacts? • Consider the following bus service • 5 min average headway • 80-pax capacity buses • An average demand of 50 pax/bus
  • 26.
    What are theimpacts? 8:00 8:05 8:10 8:15 8:20 8:00 8:02 8:10 8:12 8:20
  • 27.
    What are theimpacts? • Increase in average occupancy • Longer waiting times correlate with high occupancy • More users suffer high occupancy • Increase in occupancy variability • Generates uncertainty in the level of service
  • 28.
    What are theimpacts? • Increase in waiting times • One minute of waiting is perceived as two or three minutes of in-vehicle time • Increase in the variability of waiting times • Leads to earlier departures for users
  • 29.
    What are theimpacts? • Increase in dwell times • Boarding and alighting is slow and creates friction between passengers • Increase in the variability of dwell time • Damages the reliability of the service • Operators need extra fleet and drivers due to variable cycle times
  • 30.
    Cities need itscitizens to use public transport This is easier if citizens like their public transport, if they are satisfied with its use
  • 31.
    Cities need itscitizens to use public transport This is easier if citizens like their public transport, if they are satisfied with its use How does reliability affect user satisfaction?
  • 32.
    What are theimpacts? User Satisfaction Occupancy per bus
  • 33.
    What are theimpacts? User Satisfaction Occupancy per bus50 pax 80% Imagine a regular service with a 5 minute interval, 50 passengers per bus and 63% occupancy.
  • 34.
    What are theimpacts? User Satisfaction 50 pax 80% Suppose the service is not regular, and operates with intervals of 2 and 8 minutes alternately (with occupancies of 25% and 100% respectively). 90% 20 pax 80 pax 10% Occupancy per bus
  • 35.
    What are theimpacts? User Satisfaction 63% 80% 90% 25% 100% Average occupancy of buses will be 63%, with an apparent satisfaction of 50%. 50% 10% Occupancy per bus
  • 36.
    What are theimpacts? User Satisfaction 63% 80% 90% 25% 100% Average occupancy of perceived by users will be 85%, with a satisfaction level of only 26%! 50% 85% 26% 10% Occupancy per bus
  • 37.
    What are theimpacts? User Satisfaction 63% 80% 90% 25% 100% 50% 85% 26% 10% This is what we planned for… This is what we achieved with no control! Occupancy per bus
  • 39.
    To achieve theseattributes… Fast Low waits Comfortable Reliable I N C R E A S E S P E E D A N D R E G U L A R H E A D W A Y S !
  • 40.
    Today we willaddress three questions Why does bus bunching happen? What are the impacts? 1 2 Does it have a solution?3
  • 41.
    Does it havea solution? •Yes! • Dedicated infrastructure • Transit signal priority • Real-time control at dispatching and along the route • (developed by )
  • 42.
    Does it havea solution?
  • 43.
    Does it havea solution? Source: mto.gov.on.ca
  • 44.
    Does it havea solution? No control With control Color indicates bus load!
  • 45.
    Time-space trajectories 0 2040 60 80 100 120 0 1 2 3 4 5 6 7 8 9 10 s2 NETS sc corrida17Distance(Km) Time(minutes) Real Time Holding 0 20 40 60 80 100 120 0 1 2 3 4 5 6 7 8 9 10 Scenario 1 threshold run17 Distance(Km) Time(minutes) No Control
  • 46.
    Bus loads 0 510 15 20 25 30 0 20 40 60 80 100 120 Scenario 1 HBLRT alpha=05 Beta=05 Load(Pax.) Stop 0 5 10 15 20 25 30 0 20 40 60 80 100 120 Scenario 1 HBLRT alpha=05 Beta=05 Load(Pax.) Stop No Control Real Time Holding
  • 47.
    Cycle times 25 3035 40 45 0 50 100 150 200 250 300 350 mean =33.64 Std.Dev. =3.51 No control Frequency Cycle Time (Minutes) 25 30 35 40 45 0 50 100 150 200 250 300 350 mean =32.11 Std.Dev. =1.2 HRT 05 Frequency Cycle Time (Minutes) No Control Real Time Holding
  • 48.
    Does it havea solution? Ok! Hold Go faster (if possible) Slow down
  • 49.
    Does it havea solution?
  • 50.
    The future ofBRT should be written with double R BRRT Bus Rapid and Reliable Transit
  • 51.
    The full costof bus headway variability and our experience to achieve a regular service Juan Carlos Munoz Bus Rapid Transit Centre of Excellence Centro de Desarrollo Urbano Sustentable, CEDEUS Pontificia Universidad Católica de Chile Hong Kong, December 8th, 2018 @JuanCaMunozA