Recommended
PPTX
PPT
PPTX
Introduction to Limits and Continuity for Basic Calculus-WEEK2.pptx
DOCX
Basic%20Cal%20Final.docx.docx
PPTX
Basic Cal - Quarter 1 Week 1-2.pptx
PDF
Forms study purpusesChapter-2-Limits.pdf
PPTX
Basic Calculussssssssssssssssssssss.pptx
PPT
L4 One-sided limits limits at infinity.ppt
PPTX
1-LIMIT-OF-A-FUNCTION.pptx
DOCX
PPT
Limit fungsi dasar hingga trigonometri dan penerapannya
PPT
L4 one sided limits limits at infinity
PDF
PPT
l2_limits_of_functions for senior high.ppt
PPTX
CAL 11 Q3 0101 PF FINAL.pptx212233445666
PDF
11 x1 t09 01 limits & continuity (2013)
PPTX
BC1-Limit-of-Function.pptx
PDF
Limit 140929031133-phpapp01
PPTX
PPTX
BASIC-CALCULUS-LESSON-Gr11 2024-2025.pptx
PDF
BAS-CAL-LESSON-1-LIMITS-OF-A-FUNCTION.pdf
KEY
PDF
Solutions for Exercises in Calculus: Early Transcendentals, 11th Global Editi...
PPTX
One-Sided-Lbbbbbbbbbbbbbbbbbbbbbbbbbbbbbbbbimits.pptx
PPTX
EBS30145678CALCULUS - Units 1 and 2.pptx
PDF
1552 limits graphically and nume
PDF
PPSX
More Related Content
PPTX
PPT
PPTX
Introduction to Limits and Continuity for Basic Calculus-WEEK2.pptx
DOCX
Basic%20Cal%20Final.docx.docx
PPTX
Basic Cal - Quarter 1 Week 1-2.pptx
PDF
Forms study purpusesChapter-2-Limits.pdf
PPTX
Basic Calculussssssssssssssssssssss.pptx
PPT
L4 One-sided limits limits at infinity.ppt
Similar to -from-table-and-graphs you wanna learn this
PPTX
1-LIMIT-OF-A-FUNCTION.pptx
DOCX
PPT
Limit fungsi dasar hingga trigonometri dan penerapannya
PPT
L4 one sided limits limits at infinity
PDF
PPT
l2_limits_of_functions for senior high.ppt
PPTX
CAL 11 Q3 0101 PF FINAL.pptx212233445666
PDF
11 x1 t09 01 limits & continuity (2013)
PPTX
BC1-Limit-of-Function.pptx
PDF
Limit 140929031133-phpapp01
PPTX
PPTX
BASIC-CALCULUS-LESSON-Gr11 2024-2025.pptx
PDF
BAS-CAL-LESSON-1-LIMITS-OF-A-FUNCTION.pdf
KEY
PDF
Solutions for Exercises in Calculus: Early Transcendentals, 11th Global Editi...
PPTX
One-Sided-Lbbbbbbbbbbbbbbbbbbbbbbbbbbbbbbbbimits.pptx
PPTX
EBS30145678CALCULUS - Units 1 and 2.pptx
PDF
1552 limits graphically and nume
PDF
PPSX
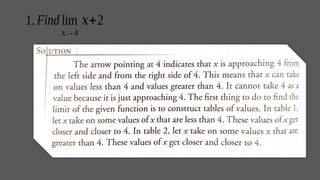
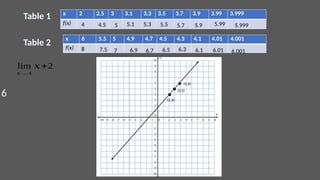
-from-table-and-graphs you wanna learn this 1. 2. 3. x 2 2.5 3 3.1 3.3 3.5 3.7 3.9 3.99 3.999
f(x)
x 6 5.5 5 4.9 4.7 4.5 4.3 4.1 4.01 4.001
f(x)
Table 1
Table 2
(4,6)
(2,4)
(3,5)
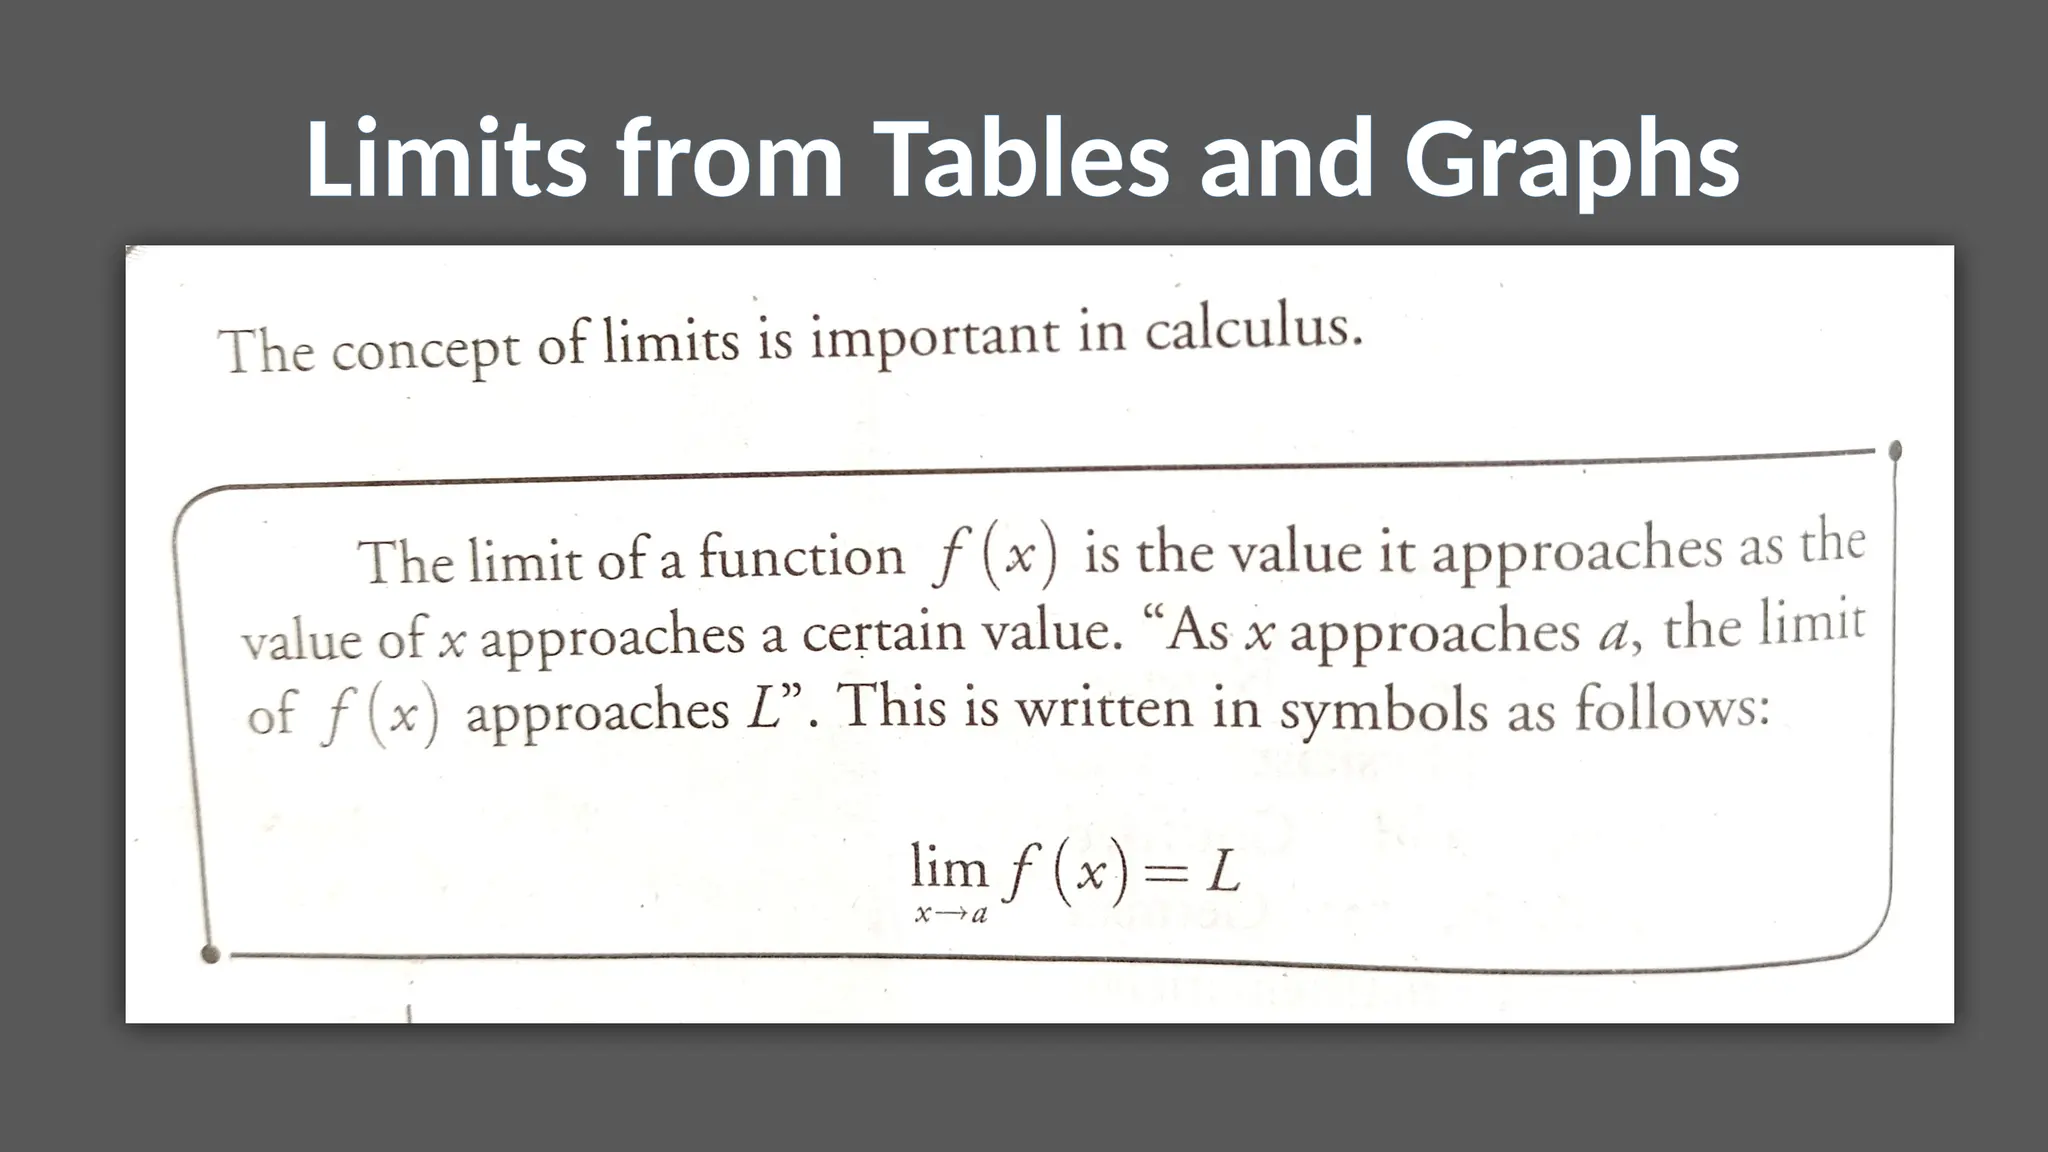
lim
𝑥 → 4
𝑥 +2
6
4 4.5 5 5.1 5.9
5.3 5.5 5.7 5.99
8
5.999
7
7.5 6.7
6.9 6.5 6.3 6.1 6.01 6.001
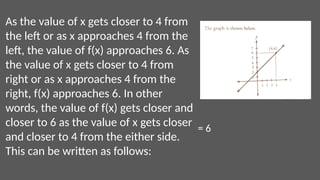
4. As the value of x gets closer to 4 from
the left or as x approaches 4 from the
left, the value of f(x) approaches 6. As
the value of x gets closer to 4 from
right or as x approaches 4 from the
right, f(x) approaches 6. In other
words, the value of f(x) gets closer and
closer to 6 as the value of x gets closer
and closer to 4 from the either side.
This can be written as follows:
= 6
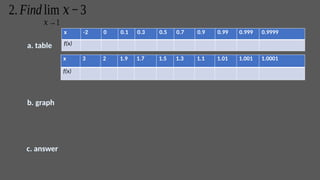
5. 2. Find lim
𝑥→1
𝑥−3
a. table
b. graph
c. answer
x -2 0 0.1 0.3 0.5 0.7 0.9 0.99 0.999 0.9999
f(x)
x 3 2 1.9 1.7 1.5 1.3 1.1 1.01 1.001 1.0001
f(x)
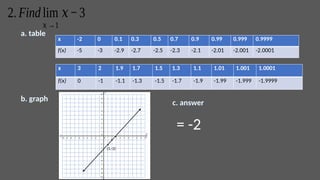
6. 2. Findlim
𝑥→1
𝑥−3
x -2 0 0.1 0.3 0.5 0.7 0.9 0.99 0.999 0.9999
f(x) -5 -3 -2.9 -2.7 -2.5 -2.3 -2.1 -2.01 -2.001 -2.0001
x 3 2 1.9 1.7 1.5 1.3 1.1 1.01 1.001 1.0001
f(x) 0 -1 -1.1 -1.3 -1.5 -1.7 -1.9 -1.99 -1.999 -1.9999
a. table
b. graph
c. answer
(1,-2)
= -2