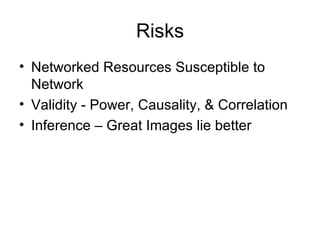
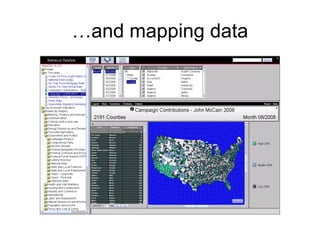
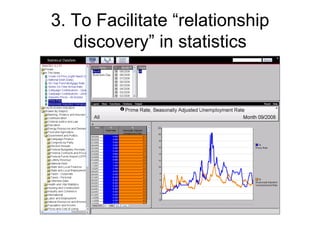
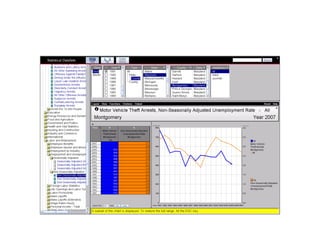
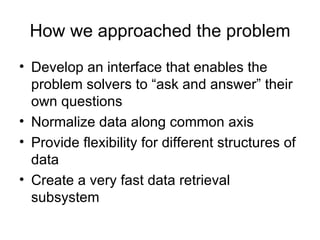
Data Visualization Computation From Data to Visualization:  Emerging Tools for Research Jan Johansson 11/12/08
 
> au: *emens; kw:model


66%
Data On The Brink… Census
Other Emerging Visualization Tools Swivel M any Eyes Google
Risks Networked Resources Susceptible to Network Validity - Power, Causality, & Correlation Inference – Great Images lie better
Data Visualization Computation
The Goals of the Datasets Product
1. To be a central repository of relevant statistical data Over 6 Billion Data points Over 800 Million Time Series 550 Datasets Public and Private Data Sources
2. Make data easy to analyze by Ranking…
…trending
…and mapping data
3. To Facilitate “relationship discovery” in statistics
 
How we approached the problem Develop an interface that enables the problem solvers to “ask and answer” their own questions Normalize data along common axis Provide flexibility for different structures of data Create a very fast data retrieval subsystem
Issues to overcome Data is available in an astounding array of complexities Standards are implemented inconsistently? Very large data files Different update frequencies Infrastructure that supports quick addition of new data…including users data Data has to be electronically updated How do you avoid improper use?
Things we have learned along the way All of the data has to be clearly cited Wherever possible, we have to show the users where we got the data We have to be able to output the data in as many formats as reasonable Automation is key in managing and updating data
Where we are going Add more data The data source has tripled in size over the past year Add more specialized content Respond to current events with timely data Integration with other programs Google Maps, ESRI, SPSS Make data available through a web service

From Data to Visualization: Emerging Tools for Research / Jan Johansson

  • 1.
    Data Visualization ComputationFrom Data to Visualization: Emerging Tools for Research Jan Johansson 11/12/08
  • 2.
  • 3.
    > au: *emens;kw:model
  • 4.
  • 5.
  • 6.
  • 7.
  • 8.
  • 9.
  • 10.
    Data On TheBrink… Census
  • 11.
    Other Emerging VisualizationTools Swivel M any Eyes Google
  • 12.
    Risks Networked ResourcesSusceptible to Network Validity - Power, Causality, & Correlation Inference – Great Images lie better
  • 13.
  • 14.
    The Goals ofthe Datasets Product
  • 15.
    1. To bea central repository of relevant statistical data Over 6 Billion Data points Over 800 Million Time Series 550 Datasets Public and Private Data Sources
  • 16.
    2. Make dataeasy to analyze by Ranking…
  • 17.
  • 18.
  • 19.
    3. To Facilitate“relationship discovery” in statistics
  • 20.
  • 21.
    How we approachedthe problem Develop an interface that enables the problem solvers to “ask and answer” their own questions Normalize data along common axis Provide flexibility for different structures of data Create a very fast data retrieval subsystem
  • 22.
    Issues to overcomeData is available in an astounding array of complexities Standards are implemented inconsistently? Very large data files Different update frequencies Infrastructure that supports quick addition of new data…including users data Data has to be electronically updated How do you avoid improper use?
  • 23.
    Things we havelearned along the way All of the data has to be clearly cited Wherever possible, we have to show the users where we got the data We have to be able to output the data in as many formats as reasonable Automation is key in managing and updating data
  • 24.
    Where we aregoing Add more data The data source has tripled in size over the past year Add more specialized content Respond to current events with timely data Integration with other programs Google Maps, ESRI, SPSS Make data available through a web service