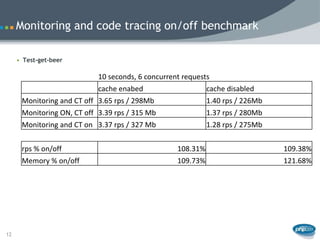
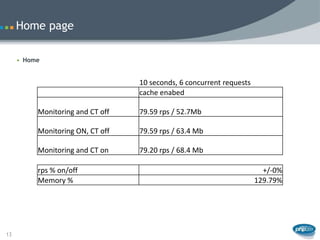
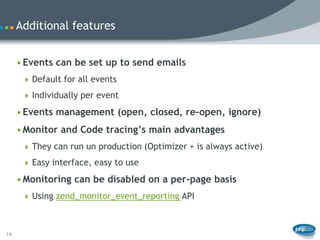
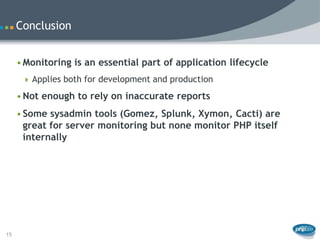
The document summarizes a presentation about using Zend Server's monitoring and profiling features to diagnose performance problems in applications. It begins with an introduction to the speaker and an overview of the session. It then discusses common issues like slow performance, errors and high memory usage that are difficult to reproduce. The presentation demonstrates how to use Zend Server's monitoring and code tracing to diagnose examples of these types of problems in a sample BeerIOU application. It also covers the performance impact and advantages of Zend Server's monitoring features.
