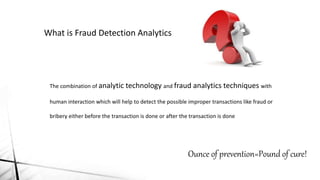
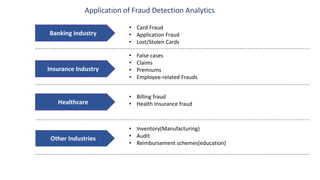
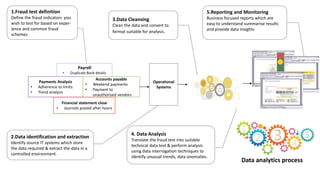
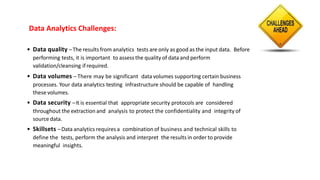
The combination of analytic technology and fraud analytics techniques with human interaction which will help to detect the possible improper transactions like fraud or bribery either before the transaction is done or after the transaction is done
Slides used for a presentation to introduce the field of business analytics. Covers what BA is, how it is a part of business intelligence, and what areas make up BA.
This presentation briefly explains the following topics:
Why is Data Analytics important?
What is Data Analytics?
Top Data Analytics Tools
How to Become a Data Analyst?
Data analytics involves analyzing data to extract useful information. It is used to identify risks, improve business processes, verify effectiveness, and influence decisions. There are five categories: data analytics of transactions and operations; web analytics of website traffic; social analytics of social media; mobile analytics of device data; and big data analytics. Companies obtain user data from GPS, sensors, and social media to perform analyses that benefit organizations.
Detecting Fraud Using Data Mining TechniquesDecosimoCPAs
1. Collect transaction data from purchase orders, invoices, checks, and other documents from the vendor/supplier files.
2. Analyze the first digit distributions using Benford's Law to identify anomalies.
3. Group transactions by amount into strata and calculate expected distributions within each stratum.
4. Compare actual first digit distributions to expected for each strata to identify outliers.
5. Investigate outliers and anomalies further to detect potential fraud patterns.
This document discusses different types of data analytics including web, mobile, retail, social media, and unstructured analytics. It defines business analytics as the integration of disparate internal and external data sources to answer forward-looking business questions tied to key objectives. Big data comes from various sources like web behavior and social media, while little data refers to any data not considered big data. Successful analytics requires addressing business challenges, having a strong data foundation, implementing solutions with goals in mind, generating insights, measuring results, sharing knowledge, and innovating approaches. The future of analytics involves every company having a data strategy and using tools to augment internal data. Predictive analytics tells what will happen, while prescriptive analytics tells how to make it
This document outlines topics related to data analytics including the definition of data analytics, the data analytics process, types of data analytics, steps of data analytics, tools used, trends in the field, techniques and methods, the importance of data analytics, skills required, and benefits. It defines data analytics as the science of analyzing raw data to make conclusions and explains that many analytics techniques and processes have been automated into algorithms. The importance of data analytics includes predicting customer trends, analyzing and interpreting data, increasing business productivity, and driving effective decision-making.
Real-Time Fraud Detection in Payment TransactionsChristian Gügi
This document discusses building a real-time fraud detection system using big data technologies. It outlines the cyber threat landscape, what anomalies and fraud detection are, and proposes an architecture with a data layer to integrate various sources and an analytics layer using stream processing, rules engines, and machine learning to score transactions in real-time and detect fraud. The system aims to scalably and reliably detect threats for increased security.
The document discusses business analytics and the role of a business analyst. It defines key terms like business analytics, data analytics, business intelligence, big data, data science, and data mining. It describes the skills required of a business analyst like understanding the business, basic statistics, Excel, and some analytics tools. The duties of a business analyst are to understand business problems and use data to help decision making. The document also lists some common business analyst job titles and roles.
The document discusses becoming a data analyst and the role of a data analyst on a PBIS (Positive Behavioral Interventions and Supports) team. It describes the responsibilities of a data analyst which include preparing data summaries before meetings, presenting data at meetings to help identify problems and evaluate solutions, and being prepared to generate custom reports during meetings. It also provides examples of how to use SWIS (School-Wide Information System) data to define problems precisely in order to develop effective solutions.
This document introduces data science, big data, and data analytics. It discusses the roles of data scientists, big data professionals, and data analysts. Data scientists use machine learning and AI to find patterns in data from multiple sources to make predictions. Big data professionals build large-scale data processing systems and use big data tools. Data analysts acquire, analyze, and process data to find insights and create reports. The document also provides examples of how Netflix uses data analytics, data science, and big data professionals to optimize content caching, quality, and create personalized streaming experiences based on quality of experience and user behavior analysis.
1. Easy Solutions is a leading global provider of electronic fraud prevention for financial institutions and enterprise customers, protecting over 75 million users and monitoring over 22 billion online connections in the last 12 months.
2. Alejandro Correa Bahnsen is a data scientist at Easy Solutions who has over 8 years of experience in data science and works on fraud detection and prevention.
3. Fraud analytics uses machine learning and artificial intelligence techniques to analyze customer transaction data and detect patterns that can predict fraudulent transactions from legitimate ones.
Data Analytics For Beginners | Introduction To Data Analytics | Data Analytic...Edureka!
Data Analytics for R Course: https://www.edureka.co/r-for-analytics
This Edureka Tutorial on Data Analytics for Beginners will help you learn the various parameters you need to consider while performing data analysis.
The following are the topics covered in this session:
Introduction To Data Analytics
Statistics
Data Cleaning and Manipulation
Data Visualization
Machine Learning
Roles, Responsibilities and Salary of Data Analyst
Need of R
Hands-On
Statistics for Data Science: https://youtu.be/oT87O0VQRi8
Follow us to never miss an update in the future.
Instagram: https://www.instagram.com/edureka_learning/
Facebook: https://www.facebook.com/edurekaIN/
Twitter: https://twitter.com/edurekain
LinkedIn: https://www.linkedin.com/company/edureka
This presentation is an Introduction to the importance of Data Analytics in Product Management. During this talk Etugo Nwokah, former Chief Product Officer for WellMatch, covered how to define Data Analytics why it should be a first class citizen in any software organization
It is an introduction to Data Analytics, its applications in different domains, the stages of Analytics project and the different phases of Data Analytics life cycle.
I deeply acknowledge the sources from which I could consolidate the material.
The document discusses data leakage from organizations to external parties. It proposes using watermarking and fake data objects to detect the source of leaks. The system would include modules for data allocation, fake objects, data distribution, and identifying guilty agents. The goal is to distribute data intelligently to improve detection of agents responsible for leaks, while satisfying data requests. Challenges include some data not supporting watermarks and dynamic agent requests.
The document discusses data science and data analytics. It provides definitions of data science, noting it emerged as a discipline to provide insights from large data volumes. It also defines data analytics as the process of analyzing datasets to find insights using algorithms and statistics. Additionally, it discusses components of data science including preprocessing, data modeling, and visualization. It provides examples of data science applications in various domains like personalization, pricing, fraud detection, and smart grids.
The document provides an introduction to data analytics, including defining key terms like data, information, and analytics. It outlines the learning outcomes which are the basic definition of data analytics concepts, different variable types, types of analytics, and the analytics life cycle. The analytics life cycle is described in detail and involves problem identification, hypothesis formulation, data collection, data exploration, model building, and model validation/evaluation. Different variable types like numerical, categorical, and ordinal variables are also defined.
DI&A Slides: Descriptive, Prescriptive, and Predictive AnalyticsDATAVERSITY
Data analysis can be divided into descriptive, prescriptive and predictive analytics. Descriptive analytics aims to help uncover valuable insight from the data being analyzed. Prescriptive analytics suggests conclusions or actions that may be taken based on the analysis. Predictive analytics focuses on the application of statistical models to help forecast the behavior of people and markets.
This webinar will compare and contrast these different data analysis activities and cover:
- Statistical Analysis – forming a hypothesis, identifying appropriate sources and proving / disproving the hypothesis
- Descriptive Data Analytics – finding patterns
- Predictive Analytics – creating models of behavior
- Prescriptive Analytics – acting on insight
- How the analytic environment differs for each
The document outlines a data science roadmap that covers fundamental concepts, statistics, programming, machine learning, text mining, data visualization, big data, data ingestion, data munging, and tools. It provides the percentage of time that should be spent on each topic, and lists specific techniques in each area, such as linear regression, decision trees, and MapReduce in big data.
Anomaly Detection - Real World Scenarios, Approaches and Live ImplementationImpetus Technologies
Detecting anomalous patterns in data can lead to significant actionable insights in a wide variety of application domains, such as fraud detection, network traffic management, predictive healthcare, energy monitoring and many more.
However, detecting anomalies accurately can be difficult. What qualifies as an anomaly is continuously changing and anomalous patterns are unexpected. An effective anomaly detection system needs to continuously self-learn without relying on pre-programmed thresholds.
Join our speakers Ravishankar Rao Vallabhajosyula, Senior Data Scientist, Impetus Technologies and Saurabh Dutta, Technical Product Manager - StreamAnalytix, in a discussion on:
Importance of anomaly detection in enterprise data, types of anomalies, and challenges
Prominent real-time application areas
Approaches, techniques and algorithms for anomaly detection
Sample use-case implementation on the StreamAnalytix platform
The document provides an overview of data science applications and use cases. It defines data science as using computer science, statistics, machine learning and other techniques to analyze data and create data products to help businesses make better decisions. It discusses big data challenges, the differences between data science and software engineering, and key areas of data science competence including data analytics, engineering, domain expertise and data management. Finally, it outlines several common data science applications and use cases such as recommender systems, credit scoring, dynamic pricing, customer churn analysis and fraud detection with examples of how each works and real world cases.
The document discusses data science, defining it as a field that employs techniques from many areas like statistics, computer science, and mathematics to understand and analyze real-world phenomena. It explains that data science involves collecting, processing, and analyzing large amounts of data to discover patterns and make predictions. The document also notes that data science is an in-demand field that is expected to continue growing significantly in the coming years.
Data mining is an important part of business intelligence and refers to discovering interesting patterns from large amounts of data. It involves applying techniques from multiple disciplines like statistics, machine learning, and information science to large datasets. While organizations collect vast amounts of data, data mining is needed to extract useful knowledge and insights from it. Some common techniques of data mining include classification, clustering, association analysis, and outlier detection. Data mining tools can help organizations apply these techniques to gain intelligence from their data warehouses.
This document discusses data analytics and related concepts. It defines data and information, explaining that data becomes information when it is organized and analyzed to be useful. It then discusses how data is everywhere and the value of data analysis skills. The rest of the document outlines the methodology of data analytics, including data collection, management, cleaning, exploratory analysis, modeling, mining, and visualization. It provides examples of how data analytics is used in healthcare and travel to optimize processes and customer experiences.
Fighting financial fraud at Danske Bank with artificial intelligenceRon Bodkin
Danske Bank, the leader in mobile payments in Denmark, is innovating with AI. Danske Bank’s existing fraud detection engine is being enhanced with deep learning algorithms that can analyze potentially tens of thousands of latent features. Danske Bank’s current system is largely based on handcrafted rules created by the business, based on intuition and some light analysis. The system is effective at blocking fraud, but it has a high rate of false positives, which is expensive and inconvenient, and it has proved impractical to update and maintain as fraudsters evolve their capabilities. Moreover, the bank understands that fraud is getting worse in the near- and long-term future due to the increased digitization of banking and the prevalence of mobile banking applications and recognizes the need to use cutting-edge techniques to engage fraudsters not where they are today but where they will be tomorrow.
Application fraud is an important emerging trend, in which machines fill in transaction forms. There is evidence that criminals are employing sophisticated machine-learning techniques to attack, so it’s critical to use sophisticated machine learning to catch fraud in banking and mobile payment transactions.
Ron Bodkin and Nadeem Gulzar explore how Danske Bank uses deep learning for better fraud detection. Danske Bank’s multistep program first productionizes “classic” machine learning techniques (boosted decision trees) while in parallel developing deep learning models with TensorFlow as a “challenger” to test. The system was first tested in shadow production and then in full production in a champion-challenger setup against live transactions. Ron and Nadeem explain how the bank is integrating the models with the efforts already running, giving the bank and its investigation team the ability to adapt to new patterns faster than before and taking on complex highly varying functions not present in the training examples.
This document provides an overview of fraud analysis. It discusses how fraud analysis uses a combination of analytic technology and detection techniques with human interaction to help detect potential improper transactions. The process involves gathering and storing relevant data and mining it for patterns, discrepancies, and anomalies. Key topics covered include the role of fraud analysts, common types of fraud, importance of fraud analysis, potential benefits, and statistical and artificial intelligence techniques used for fraud detection.
Machine learning and artificial intelligence techniques are increasingly being used in cyber security to detect threats like malware, fraud, and intrusions. By analyzing large amounts of data, machine learning algorithms can learn patterns of both normal and anomalous behavior and make predictions about new or unseen data. This allows threats to be identified more accurately and in real-time without being explicitly programmed. Some key benefits of machine learning for cyber security include improved spam filtering, malware detection, identifying advanced threats, and detecting insider threats and data leaks. It is helping to address challenges of data overload, speed of threats, and unknown threats that traditional rule-based detection was unable to handle effectively.
This document contains confidential information belonging to AAUM. Any disclosure of this confidential information would damage AAUM. AAUM retains ownership of all confidential information contained in this document, regardless of the media. This document contains claim analytics data that AAUM considers confidential.
This document discusses controls, auditing, testing, and security as they relate to information systems. It provides motivation for why each of these elements are necessary: controls are needed to ensure reliability of data and reports; audits are required to protect against fraud and ensure sound practices; testing is important to identify errors when integrated systems are implemented; and security measures must be in place to protect sensitive data from unauthorized access and network threats. The document outlines various methods used for each of these functions.
This document discusses data science and related topics. It summarizes that data science involves deriving knowledge from large, structured and unstructured data using techniques like data mining, machine learning, and big data analytics. It provides examples of industries that use these approaches for applications such as fraud detection, sales predictions, and recommendations. The document also outlines Deteo's data science service offerings and expertise in areas like recommendation systems, machine learning, and analyzing structured and unstructured data using tools like Hadoop, R, and Python.
AlgoAnalytics is the “one stop AI shop”. We are the best organization in India as far as applied machine learning expertise is considered. We aim to be the one of the best in the world.
We work at the intersection of mathematics, computer science and specific domain knowledge like finance, retail, healthcare, manufacturing and others. We have developed expertise in handling structured/numerical, image and text data and integrating the intelligence gathered from heterogeneous data which is combination of structured and un-structured.
We integrate the cutting edge tools and technologies with our strong domain expertise to design predictive analytics solutions for businesses.We are proficient in classical as well as deep learning methodologies. In AlgoAnalytics we extensively use tools like R-Caret, Scikit-learn, Tensorflow, Theano and Microsoft Cognitive toolkit (CNTK).
During this webinar you will learn:
How new advanced fraud detection models, including clustering, data/text mining, machine learning and network analysis can detect more suspicious transactions and behaviours
How workflow decision learning will make your system smarter by learning based on previous decisions and interactions
How batch file attachments can be used to attach invoices, receipts and other documentation to alerts for proper record keeping during investigations
Our new search feature that allows organizations to search alerts, work items, cases, regulatory reports, comments and attachments, as well as data from outside sources, to look for potential risks (for example, searching Export Control Lists to screen for export controlled goods)
How Concur users can now open original images of receipts directly in CaseWare Monitor, making investigations easier
This document outlines a 4-stage business analytics model:
- Descriptive analytics uses historical data and simple tools to summarize past performance.
- Diagnostic analytics takes a deeper look at data to understand reasons behind results from descriptive analytics.
- Predictive analytics analyzes past trends to forecast future outcomes, using techniques like machine learning.
- Prescriptive analytics is the most complex stage, using data to recommend optimal decisions and actions.
This document provides an overview of key concepts in data analytics including:
- The sources and nature of data as well as classifications like structured, semi-structured, and unstructured data.
- The need for data analytics to gather hidden insights, generate reports, perform market analysis, and improve business requirements.
- The stages of the data analytics lifecycle including discovery, data preparation, model planning, model building, and communicating results.
- Popular tools used in data analytics like R, Python, Tableau, and SAS.
PRISM Informatics provides services including SAP HANA implementation, predictive analytics, mobile application development, and cyber security. SAP HANA is an in-memory database that provides high performance analytics capabilities. Predictive analytics processes historical data to make predictions about future events. Mobile applications are developed for personal and professional use across various platforms. Cyber security services help protect critical data and systems from threats.
The Next Gen Auditor - Auditing through technological disruptionsBharath Rao
The document discusses how emerging technologies like analytics, blockchain, artificial intelligence, and robotic process automation are disrupting businesses and the auditing profession, outlining both the opportunities and risks these technologies present for improving decision making, automating processes, and strengthening controls, while also noting challenges around regulatory compliance, privacy, and ensuring accurate data processing. Use of these technologies requires auditors to update their skills and leverage new techniques like analytics to conduct more risk-based audits and place greater reliance on automated controls.
The document discusses data analytics and its evolution from relying on past experiences to using data-driven insights. It covers the types of analytics including descriptive, diagnostic, predictive, and prescriptive analytics. Descriptive analytics summarize past data, diagnostic analytics determine factors influencing outcomes, predictive analytics make future predictions, and prescriptive analytics identify best courses of action. The document also discusses data analysis tools, natural language processing, applications of analytics, benefits of analytics for IoT, and issues with big data in IoT contexts like smart agriculture.
The document discusses the importance of aligning business processes and information technology (IT) in supply chain management. It explains that investing in both business processes and IT leads to better supply chain performance than investing in only one. The goals of supply chain IT are described as providing visibility of supply chain data, enabling analysis of that data, and facilitating collaboration with partners. Different components of supply chain management systems are outlined, including decision support systems, enterprise resource planning software, and the use of analytics and artificial intelligence.
Building Continuous Auditing Capabilities utilizing CAATs and Data Analytics technologies. Overview , CA, DA, ACL, Audit Guidelines, Technology, Audit Innovation,
Intro of Key Features of Soft CAAT Ent Softwarerafeq
This presentation provides a brief overview of SoftCAAT Ent with use cases. SoftCAAT Ent is a data analytics/BI software used by CAs and CXOs for Assurance, Compliance and Fraud Investigations.
Architecting the Framework for Compliance & Risk Managementjadams6
Privacy and protection of personal information is a hot topic in data governance. However, the compliance challenge is in creating audit defensibility that ensures practices are compliant and performed in a way that is scalable, transparent, and defensible; thus creating “Audit Resilience.” Data practitioners often struggle with viewing the world from the auditor’s perspective. This presentation focuses on how to create the foundational governance framework supporting a data control model required to produce clean audit findings. These capabilities are critical in a world where due diligence and compliance with best practices are critical in addressing the impacts of security and privacy breaches. The companies in the news recently drive home these points.
This document discusses machine learning methods and analysis. It provides an overview of machine learning, including that it allows computer programs to teach themselves from new data. The main machine learning techniques are described as supervised learning, unsupervised learning, and reinforcement learning. Popular applications of these techniques are also listed. The document then outlines the typical steps involved in applying machine learning, including data curation, processing, resampling, variable selection, building a predictive model, and generating predictions. It stresses that while data is important, the right analysis is also needed to apply machine learning effectively. The document concludes by discussing issues like data drift and how to implement validation and quality checks to safeguard automated predictions from such problems.
The three steps of risk management are:
1) Risk identification: Examining security posture and risks faced by an organization.
2) Risk assessment: Documenting results of risk identification.
3) Risk control: Applying controls to reduce risks to data and information systems.
Risk identification involves identifying assets, threats, and vulnerabilities. Risk assessment assigns values and likelihoods to risks. Risk control identifies additional controls to further mitigate residual risks.
FDA News Webinar - Inspection IntelligenceArmin Torres
Developing a Digital Data-Driven Approach to preparing for FDA Inspections. Using Data Analytics to proactively monitor internal and external Quality & Compliance data sources.
the process of identifying and categorising opinions expressed in a piece of text, especially in order to determine whether the writer's attitude towards a particular topic, product, etc.
is positive, negative, or neutral
This document provides an overview of BMW's marketing approach and evolution over the 1970s-1990s. It discusses BMW positioning itself as a niche luxury brand focused on performance. In the 1980s, it faced new competition from Lexus, Acura, and Infiniti but maintained its positioning through superior quality. In the 1990s, BMW targeted highly educated, affluent individuals seeking a great driving experience and reconceptualized its dealer system. By 2001, BMW aimed to increase its US market share against toughening competition. It developed short films promoting its technology and driving experience, achieving widespread online views and positive publicity. The document evaluates alternatives for BMW's marketing path forward.
This document provides instructions for finding the unique Facebook ID of a celebrity page, copying and pasting the ID into a website to retrieve network data, and then using the Netvizz app on Facebook to analyze page likes and generate statistics, distributions, and reports on centrality, degree, and appearances for further analysis of the celebrity page.
This document discusses four types of people who are essential to organizations based on their roles in informal networks: 1) Central connectors who link people and provide critical information, 2) Boundary spanners who connect internal networks to other parts of the company and external organizations, 3) Information brokers who share information within subgroups to prevent segmentation, and 4) Peripheral specialists who possess specific expertise and are working to expand their networks. Research from HBR found that people with strong personal networks stay longer at companies, are more satisfied, and can boost productivity.
Transferable skills include communication, teamwork, problem solving, and intellectual skills that can be applied to different jobs. Initiative involves independently assessing and acting on opportunities. Self-discipline is controlling and motivating oneself to stay on track and do what is right. Reliability means consistently performing well and being trustworthy. Creativity is creating something new and valuable. Problem solving involves searching for solutions in different ways.
The document discusses several personal and professional development skills including transferable skills like communication, teamwork and problem solving. It also covers initiative, self-discipline, reliability, creativity, and problem solving. Transferable skills can be skills someone takes between jobs, while initiative involves acting independently and assessing situations. Self-discipline and reliability refer to an individual's ability to control themselves and consistently perform well. Creativity generates new ideas, and problem solving searches for solutions in different ways.
Global Situational Awareness of A.I. and where its headedvikram sood
You can see the future first in San Francisco.
Over the past year, the talk of the town has shifted from $10 billion compute clusters to $100 billion clusters to trillion-dollar clusters. Every six months another zero is added to the boardroom plans. Behind the scenes, there’s a fierce scramble to secure every power contract still available for the rest of the decade, every voltage transformer that can possibly be procured. American big business is gearing up to pour trillions of dollars into a long-unseen mobilization of American industrial might. By the end of the decade, American electricity production will have grown tens of percent; from the shale fields of Pennsylvania to the solar farms of Nevada, hundreds of millions of GPUs will hum.
The AGI race has begun. We are building machines that can think and reason. By 2025/26, these machines will outpace college graduates. By the end of the decade, they will be smarter than you or I; we will have superintelligence, in the true sense of the word. Along the way, national security forces not seen in half a century will be un-leashed, and before long, The Project will be on. If we’re lucky, we’ll be in an all-out race with the CCP; if we’re unlucky, an all-out war.
Everyone is now talking about AI, but few have the faintest glimmer of what is about to hit them. Nvidia analysts still think 2024 might be close to the peak. Mainstream pundits are stuck on the wilful blindness of “it’s just predicting the next word”. They see only hype and business-as-usual; at most they entertain another internet-scale technological change.
Before long, the world will wake up. But right now, there are perhaps a few hundred people, most of them in San Francisco and the AI labs, that have situational awareness. Through whatever peculiar forces of fate, I have found myself amongst them. A few years ago, these people were derided as crazy—but they trusted the trendlines, which allowed them to correctly predict the AI advances of the past few years. Whether these people are also right about the next few years remains to be seen. But these are very smart people—the smartest people I have ever met—and they are the ones building this technology. Perhaps they will be an odd footnote in history, or perhaps they will go down in history like Szilard and Oppenheimer and Teller. If they are seeing the future even close to correctly, we are in for a wild ride.
Let me tell you what we see.
End-to-end pipeline agility - Berlin Buzzwords 2024Lars Albertsson
We describe how we achieve high change agility in data engineering by eliminating the fear of breaking downstream data pipelines through end-to-end pipeline testing, and by using schema metaprogramming to safely eliminate boilerplate involved in changes that affect whole pipelines.
A quick poll on agility in changing pipelines from end to end indicated a huge span in capabilities. For the question "How long time does it take for all downstream pipelines to be adapted to an upstream change," the median response was 6 months, but some respondents could do it in less than a day. When quantitative data engineering differences between the best and worst are measured, the span is often 100x-1000x, sometimes even more.
A long time ago, we suffered at Spotify from fear of changing pipelines due to not knowing what the impact might be downstream. We made plans for a technical solution to test pipelines end-to-end to mitigate that fear, but the effort failed for cultural reasons. We eventually solved this challenge, but in a different context. In this presentation we will describe how we test full pipelines effectively by manipulating workflow orchestration, which enables us to make changes in pipelines without fear of breaking downstream.
Making schema changes that affect many jobs also involves a lot of toil and boilerplate. Using schema-on-read mitigates some of it, but has drawbacks since it makes it more difficult to detect errors early. We will describe how we have rejected this tradeoff by applying schema metaprogramming, eliminating boilerplate but keeping the protection of static typing, thereby further improving agility to quickly modify data pipelines without fear.
The Ipsos - AI - Monitor 2024 Report.pdfSocial Samosa
According to Ipsos AI Monitor's 2024 report, 65% Indians said that products and services using AI have profoundly changed their daily life in the past 3-5 years.
Analysis insight about a Flyball dog competition team's performanceroli9797
Insight of my analysis about a Flyball dog competition team's last year performance. Find more: https://github.com/rolandnagy-ds/flyball_race_analysis/tree/main
ViewShift: Hassle-free Dynamic Policy Enforcement for Every Data LakeWalaa Eldin Moustafa
Dynamic policy enforcement is becoming an increasingly important topic in today’s world where data privacy and compliance is a top priority for companies, individuals, and regulators alike. In these slides, we discuss how LinkedIn implements a powerful dynamic policy enforcement engine, called ViewShift, and integrates it within its data lake. We show the query engine architecture and how catalog implementations can automatically route table resolutions to compliance-enforcing SQL views. Such views have a set of very interesting properties: (1) They are auto-generated from declarative data annotations. (2) They respect user-level consent and preferences (3) They are context-aware, encoding a different set of transformations for different use cases (4) They are portable; while the SQL logic is only implemented in one SQL dialect, it is accessible in all engines.
#SQL #Views #Privacy #Compliance #DataLake
2. The combination of analytic technology and fraud analytics techniques with
human interaction which will help to detect the possible improper transactions like fraud or
bribery either before the transaction is done or after the transaction is done
What is Fraud Detection Analytics
Ounce of prevention=Pound of cure!
3. Why use of Data analytics for fraud?
•Improved efficiency –Automated method
for detectingandmonitoring potentially
fraudulentbehaviour.
•Repeatable tests – Repeatable fraud tests
that canbe run on yourdataat any time.
•Wider coverage –Full coverage of testing
population rather than ‘spot checks’ on
transactions –betterchance of finding
exceptional items.
•Early warning system –Analytics solutions
can help you to quickly identify potentially
fraudulent behaviourbefore the fraud
becomes material.
Fraud Detection Methods
Social
Network
Analysis
Predictive
analytics for
big Data
Social
Customer
Relationship
Management
(CRM)
AI Techniques
• Data Mining
• Expert
systems
• Pattern
recognition
Repetitive or
Continuous
Analysis
4. Application of Fraud Detection Analytics
Banking Industry
Insurance Industry
Healthcare
Other Industries
• Card Fraud
• Application Fraud
• Lost/Stolen Cards
• False cases
• Claims
• Premiums
• Employee-related Frauds
• Billing fraud
• Health Insurance fraud
• Inventory(Manufacturing)
• Audit
• Reimbursement schemes(education)
5. Payroll
• Duplicate Bank details
Payments Analysis
• Adherence to limits
• Trend analysis
1.Fraud test definition
Define the fraud indicators you
wish to test for based on exper-
ience and common fraud
schemes
Accounts payable
• Weekend payments
• Payment to
unauthorised vendors
Financial statement close
• Journals posted after hours
2.Data identification and extraction
Identify source IT systems which store
the data required & extract the data in a
controlled environment.
Operational
Systems
3.Data Cleansing
Clean the data and convert to
format suitable for analysis.
4. Data Analysis
Translate the fraud test into suitable
technical data test & perform analysis
using data interrogation techniques to
identify unusual trends, data anomalies.
5.Reporting and Monitoring
Business focused reports which are
easy to understand summarise results
and provide data insights
Data analytics process
6. Data Analytics Challenges:
• Data quality –The results from analytics tests are only as good as the input data. Before
performing tests, it is important to assess the quality of data and perform
validation/cleansing ifrequired.
• Data volumes – There may be significant data volumes supporting certain business
processes. Your data analytics testing infrastructure should be capable of handling
these volumes.
• Data security –It is essential that appropriate security protocols are considered
throughout the extraction and analysis to protect the confidentiality and integrity of
source data.
• Skillsets –Data analytics requires a combination of business and technical skills to
define the tests, perform the analysis and interpret the results in order to provide
meaningful insights.