The portfolio holdings data is for the Templeton Global Bond Fund as of June 30, 2015. It provides security-level details including name, market value, shares/positions held, coupon rate, maturity date, and percentage of total net assets (% of TNA). Some information, such as details on over-the-counter derivatives, is not included. The complete portfolio data can be found in the fund's semi-annual and annual financial statements. The data includes positions in various government bonds from countries like Malaysia, Hungary, India, and Indonesia as well as corporate bonds from banks such as Citigroup and JPMorgan Chase.
The portfolio currently holds 27 active loans totaling $15.5 million, secured by $30 million in collateral. Previously, 12 loans totaling $2.5 million have been repaid, secured by $4.5 million in collateral. The average loan size is $572,811 with an average LTV of 57% and term of 9.3 months at an interest rate of 12.4%. The fund seeks to generate high returns for investors through short-term real estate lending while minimizing risk.
EPIC RESEARCH SINGAPORE - Daily SGX Singapore report of 10 February 2015Epic Research Singapore
Epic Research private limited have best technical research team, Our research team provide Daily report on SGX Singapore and SGX Exchange, You can get Daily Favorable Tips & future Strategy for SGX Stocks Market.
The Nigerian stock market declined further on the day, with the benchmark index falling 2.4% to close at 30,420.54 points. Banking stocks declined the most, led by losses in Access Bank, Guaranty Trust Bank, and Fidelity Bank. The document provides analysis and recommendations on various Nigerian stocks, with "buy," "hold," and "sell" ratings assigned. It also includes the latest stock prices and financial data, as well as recent news headlines related to the banking sector.
- Net profit for the company decreased 70.1% in the first half of 2016 compared to the same period in 2015, largely due to a one-time gain from the sale of government bonds in 2015. Excluding this, net profit decreased 17.6%.
- Total assets decreased slightly to €4.74 billion as of June 30, 2016, compared to December 31, 2015, as holdings of other financial assets decreased significantly while loans to customers remained stable.
- Capital levels remained strong with a Common Equity Tier 1 ratio of 15.42% as of June 30, 2016, slightly decreased from December 31, 2015 but still well above regulatory requirements.
Senior Fed officials meet next week amid what is widely seen as a slow patch in economic growth. A key question for investors, as well as for monetary policymakers, is whether this slowing will be temporary. Most likely, growth should pick up in the second half of the year. However, there are downside risks in the near term. Moreover, monetary policy appears to be handcuffed and fiscal policy is set to go in the wrong direction.
EPIC RESEARCH SINGAPORE - Daily SGX Singapore report of 12 February 2016epicresearchsgmy
The document is a daily market insight report from Epic Research Singapore that includes:
- Commentary on the performance of the Singapore Straits Times Index and top gaining and losing stocks.
- Statistics on sector performance and most active stocks.
- An economic calendar of upcoming economic data releases.
- A technical analysis and recommendation for a specific stock.
Amidst oversold conditions, the NSE witnessed further decline at today’s session, as the All-Share-Index depreciated by 0.29% to close at 29,052.87bps. All sectorial indices monitored by the exchange showed mixed performance. Portpaint, Dangcem and Oando appreciated by 4.75%, 0.62 and 8.68% respectively leaving NSEIND and NSEOILGS in positive territory. On the back of Unitybnk(-4.62%), Fidelitybk(-2.82%), Continsure(-3.00%), Unilever(-4.98%) and Cadbury(-4.96%), NSEBNK, NSECNSM and NSEINS shed points.
Terna reported its 1Q13 consolidated results, with total revenues increasing 8.8% year-over-year to €470 million. EBITDA grew 12.1% to €381 million, while group net income rose 24.6% to €142 million. Total regulated capex decreased 16% to €196 million compared to 1Q12. Net debt increased €69 million from December 31, 2012 to €5.924 billion as of March 31, 2013 due to operating cash flow, changes in working capital, and capex spending.
The Nigerian stock market saw a slight increase of 0.22% at the start of the week due to improved liquidity from the Central Bank. Some sectors increased while others decreased. The document provides analysis of company results and dividends, as well as commentary on trends in the fixed income and commodity markets. It also summarizes a survey showing most Nigerians experienced improved electricity supply over the last quarter.
EPIC RESEARCH SINGAPORE - Daily SGX Singapore report of 11 February 2016epicresearchsgmy
The document provides a daily market insight report for the Singapore market. It includes commentary on market performance, statistics on index levels and top gainers and losers. The Straits Times Index fell 1.57% and the top active stocks were SingTel, DBS, Global Logistic and CapitaLand. Sector performance was mixed with industrials outperforming and healthcare underperforming. It also provides economic calendar updates and a stock recommendation for GMG Global.
Epic Research Singapore have best technical research team, Our research team provide Daily report on SGX Singapore and SGX Exchange, You can get Daily Favorable Tips & future Strategy for SGX Stocks Market.
EPIC RESEARCH SINGAPORE - Daily SGX Singapore report of 06 January 2016epicresearchsgmy
Epic Research Singapore have best technical research team, Our research team provide Daily report on SGX Singapore and SGX Exchange, You can get Daily Favorable Tips & future Strategy for SGX Stocks Market.
This document provides data on credit unions in New York with assets between $20 million and $50 million from 2015. It lists the credit unions that led in areas such as share capital growth, asset growth, loan growth, return on assets, member growth, loan to share ratio, and shares to assets ratio. For example, St. Josephs Parish FCU had the highest share capital growth at 23.89% and assets of $45,077,551. Great Meadow FCU led in loan growth at 29.57% with loans of $17,160,679. Brooklyn Cooperative FCU performed well with the highest return on assets at 3.26% and assets of $20,438,421.
EPIC RESEARCH SINGAPORE - Daily SGX Singapore report of 10 February 2016epicresearchsgmy
Epic Research Singapore have best technical research team, Our research team provide Daily report on SGX Singapore and SGX Exchange, You can get Daily Favorable Tips & future Strategy for SGX Stocks Market.
Thirty-two venture capital funds raised $1.63 billion in the second quarter of 2003, a slight increase from the first quarter. Venture capital firms also reduced commitments from limited partners by $287.7 million, the second lowest reduction since 2002, suggesting the industry is stabilizing. While venture capital fundraising increased slightly, buyout and mezzanine funds saw a decrease, with 16 funds raising $1.29 billion in the second quarter, a 58% decrease from the previous quarter.
Financing Oil & Gas Projects in a Low Oil Price World by Jan PrinsEnergy Intelligence
37th Oil & Money Conference
www.oilandmoney.com
For more information news@oilandmoney.net
Panel:
Ignacio de Calonje, Chief Investment Officer - IFC Natural Resources
Peter Gaw, Managing Director, Global Head Oil & Gas - Standard Chartered Bank
Julian Mylchreest, Global Head, Energy & Power - Bank of America Merrill Lynch
Moderator:
Jan Prins, Independent Consultant - Energy and Infrastructure Finance
The Nigerian stock market declined further as large companies like FBNH and Guinness lost value. Most sector indices fell with the exception of oil and gas. Trading volume also decreased. The document then provides corporate earnings results and actions for various companies. It also discusses recent developments in Nigeria's rice industry, efforts to boost domestic production, and challenges around rice imports.
The Straits Times Index ended slightly higher, gaining 0.42% as Singtel and SGX saw gains while DBS declined. The real estate sector outperformed while technology declined. Trading was active in ETFs tracking Asia ex-Japan, India, and China as well as REITs including Parkwaylife, CapitaLand Commercial, and CapitaLand Mall. SBI Offshore is recommended as a buy above 0.270 with upside targets and downside support levels identified.
The Straits Times Index ended higher by 0.84% as certain sectors such as healthcare performed well. The top gaining stocks included Jardine Matheson Holdings and Jardine Strategic Holdings. Meanwhile, the top losing stocks were China Fibretech, M1 and Abterra. Trading was active in stocks such as Noble, EMS Energy and Genting Singapore. The report also provides market statistics, economic calendar, stock signals and analysis of index performance.
EPIC RESEARCH SINGAPORE - Daily SGX Singapore report of 04 May 2016epicresearchsgmy
Epic Research Singapore have best technical research team, Our research team provide Daily report on SGX Singapore and SGX Exchange, You can get Daily Favorable Tips & future Strategy for SGX Stocks Market.
EPIC RESEARCH SINGAPORE - Daily SGX Singapore report of 17 March 2016epicresearchsgmy
The document provides a daily market insight report on the Singapore stock market. It includes commentary on index performance, sector performance, top gainers and losers by share price, most active stocks by trading volume, and economic calendar updates. The key points are that the Straits Times Index gained 0.17%, the top performing sector was oil and gas, Singtel declined 0.52%, and upcoming economic reports include China PPI and US current account data.
Global oil supply has increased substantially in recent years due to rising U.S. production and other factors, leading to a sharp decline in oil prices from over $100 per barrel to under $60 currently. This drop in prices benefits consumers but hurts some oil-producing nations. While lower prices could reduce U.S. shale oil exploration and jobs in the oil industry, the effects may not be significant enough to change the Federal Reserve's cautious approach to monetary policy. Unlike past price declines caused mainly by falling demand, the current price fall is largely due to rising supply, a situation that could persist if OPEC doesn't cut production.
The document provides an overview of the Nigerian stock market for February 4, 2015. It summarizes that the benchmark index closed up 2% led by gains in banking stocks. It also reports declines in some oil and sugar stocks. Two companies, Chellarams Plc and Academy Press Plc, reported significant year-over-year declines in profits. The document then provides sector-by-sector summaries of stock performance and analyst recommendations on various stocks. It concludes with news headlines on the CBN providing liquidity to foreign exchange markets, a court case involving Dana Group and Sterling Bank, and Nigeria cutting its joint oil venture budget.
- The quarterly financial report summarizes the city's revenues and expenditures as of June 30, 2016, which is three quarters through the fiscal year.
- For the general fund, revenues are at 87% of budget while expenditures are at 66% of budget, leaving a positive operating balance. Property tax collections are at 97% of budget.
- The utility fund revenues are at 68% of budget while expenditures are at 55% of budget, also leaving a positive operating balance.
- Overall, the city's financial position remains positive with revenues and expenditures generally on track through three quarters of the fiscal year.
Robert Galindo, Director of Finance, presented the quarterly financial report for the period ending September 30, 2020. Overall revenues were close to budget while expenditures were under budget. In the general fund, property and sales tax revenues were higher than the previous year but some other revenues like permits and fees were lower due to the pandemic. The utility fund revenues were under budget mainly due to lower than expected sewer revenues. The investment portfolio performance was positive with average yields higher than benchmarks.
Bonds included on the inspirational list are selected based on market liquidity. None of the suggested bonds constitute any form of trade recommendation to sell or buy.
Pricing source: Indicative prices from Bloomberg
The document provides a daily market and sector report for Nigerian stocks. It summarizes the day's performance of the overall market and various stock indices. It also provides recommendations and analysis for specific stocks in the banking, food/beverage, building materials, breweries, agriculture, and pharmaceutical sectors. Key points covered include a unofficial devaluation of the Nigerian currency, declines in imports affecting the ports, and the government considering further budget cuts ahead of elections.
- The quarterly financial report summarizes city revenues and expenditures for the general fund, utility fund, and capital projects fund as of September 30, 2023. Overall, general fund revenues exceeded budget by 5% while expenditures were 8% under budget, resulting in a small operating surplus. Utility fund revenues were 9% under budget but expenditures were 3% under, leaving a small operating deficit. The capital projects fund spent less than budgeted on ongoing projects. The city's investment portfolio balance increased over the quarter and portfolio performance exceeded benchmarks.
Banco ABC Brasil reported a net income of BRL 35.4 million for 2Q09, an increase of 47.7% compared to 1Q09. The credit portfolio reached BRL 6,598.1 million, an increase of 2.5% over 1Q09. The middle market credit portfolio increased 22.1% compared to 1Q09. The return on average equity was 12.0% for 2Q09, up from 8.3% in 1Q09.
Japara (JHC) equity research initiation report - riding the silver tsunami -...George Gabriel
The report initiates coverage on Japara Healthcare with a BUY recommendation and $2.77 price target. It estimates Japara has 30-60% EPS upside over three years from deploying $142 million in increased accommodation bonds into acquisitions and from extra services revenue allowed under new regulations. The aged care sector benefits from demographic trends and limited supply, while Japara is well positioned to achieve its goal of 5000 beds through a fragmented market providing consolidation opportunities.
September 2020 - Market Report - Toronto & GTA Housing SalesMichelle Makos
- Sales reported through TRREB's MLS system in September 2020 set a new record for the month at 11,083, up 42.3% from September 2019. The average selling price was $960,772, up 14% year-over-year.
- Year-to-date sales in 2020 were up approximately 1% compared to the same period in 2019, following a record third quarter. However, further economic improvements will be important to support ongoing strong home sales.
- Market conditions tightened in September compared to the previous year, with faster sales growth relative to new listings and double-digit price increases common across the GTA region, resulting in a new record for the overall average selling price.
- Darling Modular Homes' gross profit for January 2020 was $3,559,456 and gross margin was 8.25%
- The document provides details on actual, forecasted, and budgeted gross profits for various home models in different regions for January 2020. The South Central region had an actual gross profit of $1,581,403.
- Performance is shown against forecast and budget for each home model in each region, with variances calculated.
- The city's quarterly financial report shows that as of March 31, 2016, the general fund revenues were 71% of budget and expenditures were 44% of budget, leaving a positive operating balance. Property tax collections were at 91% of budget. The utility fund revenues were 46% of budget and expenditures were 35% of budget, also leaving a positive operating balance. The investment portfolio balance increased from the prior quarter to over $9.4 million as of March 31, 2016. Overall, the city's financial position remains positive at the halfway point of the fiscal year.
- The quarterly financial report summarizes the city's revenues and expenditures for the first quarter of FY 2016-2017 as of December 30, 2016. Overall revenues and expenditures for the general fund and utility fund were within budget for the quarter.
- Property tax collections were at 58% of the annual budget for the general fund portion. Revenues for the general fund were at 43% of budget while expenditures were at 22% of budget for the quarter.
- Revenues for the utility fund, which includes water and sewer, were at 24% of budget while expenditures for the utility fund were at 17% of budget for the quarter. The city's financial position remains positive at the end of the first quarter.
This document provides a quarterly financial report for the city as of September 30, 2021. It summarizes revenues and expenditures for the general fund, utility fund, and capital projects fund. The general fund ended the year with total revenues at 99% of budget and expenditures at 92% of budget. Utility fund revenues were 114% of budget. The investment portfolio totaled $28.1 million as of September 30, with 96% in investment pools and 2% in certificates of deposits. Overall, the city's financial position through the fourth quarter of the fiscal year is positive.
General Shopping Brasil provides a summary of its 3Q10 earnings. It discusses positive trends in the Brazilian economy including declining unemployment and growing real income. Retail sales growth remains strong year-over-year across various sectors. The company provides an overview of its diversified growth strategy including greenfield developments, expansions, and acquisitions. It has grown its total GLA significantly through these initiatives. The presentation concludes with details on selected assets within its portfolio.
The 2014 local municipal budget summary shows a $727,483 increase over the 2013 budget. Key drivers of increased expenses include $915,000 for health insurance, $621,500 for salaries and wages, and $208,023 for debt service. Revenues are increased through $1,261,730 raised by local taxation, $395,119 in anticipated miscellaneous revenues, and $300,000 from available fund balance. Several items reduced the budget increase, including $-62,116 for the library appropriation and $-842,000 from accelerated Sandy reimbursements. The total tax levy and tax rate are increased to cover remaining budget needs.
The document provides a daily market and sector report from Nigeria on January 7, 2015. It summarizes the negative performance of the stock market and various banking and other sectors. Specifically:
- The stock market declined sharply, with the banking sector hit particularly hard due to the government directive for government agencies to close bank revenue accounts.
- Overall market breadth favored decliners, and the key market index fell over 4%. Banking, construction, and industrial sectors all declined over 2%.
- In company news, UBA's rights issue to raise capital opened, seen as necessary to boost its capital levels to meet new regulatory requirements.
- The Sensex and Nifty indices closed lower by 0.13% and 0.20% respectively, dragged down by Zee Entertainment and IndusInd Bank.
- In company news, Titan Company's net profit rose 1.8% to Rs 320.2 crore while revenue grew 0.6%. Tech Mahindra's net profit rose 17% to Rs 1,124 crore. Berger Paints' net profit grew 67.2% to Rs 194.6 crore.
- The report provides technical recommendations to sell Tata Steel and Nifty futures and buy Dabur cash based on chart analysis and indicators.
The quarterly investment report for the City of Killeen shows that as of June 30, 2016:
- The investment portfolio complied with applicable laws and policies.
- The total portfolio value was $92.4 million, with average yields of 0.53% for the quarter and 0.44% fiscal year-to-date.
- The largest allocation was to pools and money market accounts (53%), followed by demand accounts (12%) and certificates of deposit and securities (35%).
Similar to Портфоліо активів, якими управляє Franklin Templeton Investments (20)
The leaders of the Jewish Confederation of Ukraine wrote a letter to President Macron expressing shock at the European Union's decision to sanction Moshe Kantor, the long-term president of the European Jewish Congress. They note that Kantor has dedicated his life to supporting Jewish communities, fighting antisemitism, and preserving Holocaust memory. As the proud members and partners of Kantor's European Jewish Congress, they have benefited from his unwavering support. They are confident the sanction was a mistake and call on Macron to oppose renewing the decision, for both Kantor's sake and Europe's Jewish communities who lost an important leader.
STREETONOMICS: Exploring the Uncharted Territories of Informal Markets throug...sameer shah
Delve into the world of STREETONOMICS, where a team of 7 enthusiasts embarks on a journey to understand unorganized markets. By engaging with a coffee street vendor and crafting questionnaires, this project uncovers valuable insights into consumer behavior and market dynamics in informal settings."
TEST BANK Principles of cost accounting 17th edition edward j vanderbeck mari...Donc Test
TEST BANK Principles of cost accounting 17th edition edward j vanderbeck maria r mitchell.docx
Optimizing Net Interest Margin (NIM) in the Financial Sector (With Examples).pdfshruti1menon2
NIM is calculated as the difference between interest income earned and interest expenses paid, divided by interest-earning assets.
Importance: NIM serves as a critical measure of a financial institution's profitability and operational efficiency. It reflects how effectively the institution is utilizing its interest-earning assets to generate income while managing interest costs.
Fabular Frames and the Four Ratio ProblemMajid Iqbal
Digital, interactive art showing the struggle of a society in providing for its present population while also saving planetary resources for future generations. Spread across several frames, the art is actually the rendering of real and speculative data. The stereographic projections change shape in response to prompts and provocations. Visitors interact with the model through speculative statements about how to increase savings across communities, regions, ecosystems and environments. Their fabulations combined with random noise, i.e. factors beyond control, have a dramatic effect on the societal transition. Things get better. Things get worse. The aim is to give visitors a new grasp and feel of the ongoing struggles in democracies around the world.
Stunning art in the small multiples format brings out the spatiotemporal nature of societal transitions, against backdrop issues such as energy, housing, waste, farmland and forest. In each frame we see hopeful and frightful interplays between spending and saving. Problems emerge when one of the two parts of the existential anaglyph rapidly shrinks like Arctic ice, as factors cross thresholds. Ecological wealth and intergenerational equity areFour at stake. Not enough spending could mean economic stress, social unrest and political conflict. Not enough saving and there will be climate breakdown and ‘bankruptcy’. So where does speculative design start and the gambling and betting end? Behind each fabular frame is a four ratio problem. Each ratio reflects the level of sacrifice and self-restraint a society is willing to accept, against promises of prosperity and freedom. Some values seem to stabilise a frame while others cause collapse. Get the ratios right and we can have it all. Get them wrong and things get more desperate.
Falcon stands out as a top-tier P2P Invoice Discounting platform in India, bridging esteemed blue-chip companies and eager investors. Our goal is to transform the investment landscape in India by establishing a comprehensive destination for borrowers and investors with diverse profiles and needs, all while minimizing risk. What sets Falcon apart is the elimination of intermediaries such as commercial banks and depository institutions, allowing investors to enjoy higher yields.
University of North Carolina at Charlotte degree offer diploma Transcripttscdzuip
办理美国UNCC毕业证书制作北卡大学夏洛特分校假文凭定制Q微168899991做UNCC留信网教留服认证海牙认证改UNCC成绩单GPA做UNCC假学位证假文凭高仿毕业证GRE代考如何申请北卡罗莱纳大学夏洛特分校University of North Carolina at Charlotte degree offer diploma Transcript
South Dakota State University degree offer diploma Transcriptynfqplhm
办理美国SDSU毕业证书制作南达科他州立大学假文凭定制Q微168899991做SDSU留信网教留服认证海牙认证改SDSU成绩单GPA做SDSU假学位证假文凭高仿毕业证GRE代考如何申请南达科他州立大学South Dakota State University degree offer diploma Transcript
A toxic combination of 15 years of low growth, and four decades of high inequality, has left Britain poorer and falling behind its peers. Productivity growth is weak and public investment is low, while wages today are no higher than they were before the financial crisis. Britain needs a new economic strategy to lift itself out of stagnation.
Scotland is in many ways a microcosm of this challenge. It has become a hub for creative industries, is home to several world-class universities and a thriving community of businesses – strengths that need to be harness and leveraged. But it also has high levels of deprivation, with homelessness reaching a record high and nearly half a million people living in very deep poverty last year. Scotland won’t be truly thriving unless it finds ways to ensure that all its inhabitants benefit from growth and investment. This is the central challenge facing policy makers both in Holyrood and Westminster.
What should a new national economic strategy for Scotland include? What would the pursuit of stronger economic growth mean for local, national and UK-wide policy makers? How will economic change affect the jobs we do, the places we live and the businesses we work for? And what are the prospects for cities like Glasgow, and nations like Scotland, in rising to these challenges?
"Does Foreign Direct Investment Negatively Affect Preservation of Culture in the Global South? Case Studies in Thailand and Cambodia."
Do elements of globalization, such as Foreign Direct Investment (FDI), negatively affect the ability of countries in the Global South to preserve their culture? This research aims to answer this question by employing a cross-sectional comparative case study analysis utilizing methods of difference. Thailand and Cambodia are compared as they are in the same region and have a similar culture. The metric of difference between Thailand and Cambodia is their ability to preserve their culture. This ability is operationalized by their respective attitudes towards FDI; Thailand imposes stringent regulations and limitations on FDI while Cambodia does not hesitate to accept most FDI and imposes fewer limitations. The evidence from this study suggests that FDI from globally influential countries with high gross domestic products (GDPs) (e.g. China, U.S.) challenges the ability of countries with lower GDPs (e.g. Cambodia) to protect their culture. Furthermore, the ability, or lack thereof, of the receiving countries to protect their culture is amplified by the existence and implementation of restrictive FDI policies imposed by their governments.
My study abroad in Bali, Indonesia, inspired this research topic as I noticed how globalization is changing the culture of its people. I learned their language and way of life which helped me understand the beauty and importance of cultural preservation. I believe we could all benefit from learning new perspectives as they could help us ideate solutions to contemporary issues and empathize with others.
Enhancing Asset Quality: Strategies for Financial Institutionsshruti1menon2
Ensuring robust asset quality is not just a mere aspect but a critical cornerstone for the stability and success of financial institutions worldwide. It serves as the bedrock upon which profitability is built and investor confidence is sustained. Therefore, in this presentation, we delve into a comprehensive exploration of strategies that can aid financial institutions in achieving and maintaining superior asset quality.
Enhancing Asset Quality: Strategies for Financial Institutions
Портфоліо активів, якими управляє Franklin Templeton Investments
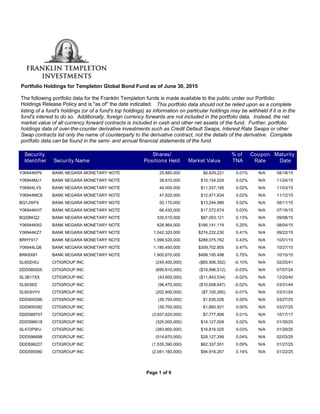
1. The following portfolio data for the Franklin Templeton funds is made available to the public under our Portfolio
Holdings Release Policy and is "as of" the date indicated.
Portfolio Holdings for Templeton Global Bond Fund as of June 30, 2015
This portfolio data should not be relied upon as a complete
listing of a fund's holdings (or of a fund's top holdings) as information on particular holdings may be withheld if it is in the
fund's interest to do so. Additionally, foreign currency forwards are not included in the portfolio data. Instead, the net
market value of all currency forward contracts is included in cash and other net assets of the fund. Further, portfolio
holdings data of over-the-counter derivative investments such as Credit Default Swaps, Interest Rate Swaps or other
Swap contracts list only the name of counterparty to the derivative contract, not the details of the derivative. Complete
portfolio data can be found in the semi- and annual financial statements of the fund.
Security Name Market Value
Shares/
Positions Held
Coupon
Rate
Maturity
Date
% of
TNA
Security
Identifier
BANK NEGARA MONETARY NOTE $6,829,22125,880,000 N/A 08/18/150.01%Y06944KP9
BANK NEGARA MONETARY NOTE $10,154,02438,810,000 N/A 11/24/150.02%Y06944MJ1
BANK NEGARA MONETARY NOTE $11,537,19544,000,000 N/A 11/03/150.02%Y06944LV5
BANK NEGARA MONETARY NOTE $12,471,63447,620,000 N/A 11/12/150.02%Y06944MC6
BANK NEGARA MONETARY NOTE $13,244,98650,170,000 N/A 08/11/150.02%BQ1JWF6
BANK NEGARA MONETARY NOTE $17,572,67466,430,000 N/A 07/16/150.03%Y06944KH7
BANK NEGARA MONETARY NOTE $87,053,121330,510,000 N/A 09/08/150.13%BQSBKQ2
BANK NEGARA MONETARY NOTE $166,141,119628,964,000 N/A 08/04/150.25%Y06944KK0
BANK NEGARA MONETARY NOTE $274,222,2301,042,320,000 N/A 09/22/150.41%Y06944KZ7
BANK NEGARA MONETARY NOTE $289,075,7621,099,520,000 N/A 10/01/150.43%BRHY917
BANK NEGARA MONETARY NOTE $309,702,8051,180,450,000 N/A 10/27/150.47%Y06944LQ6
BANK NEGARA MONETARY NOTE $499,195,4981,900,870,000 N/A 10/15/150.75%BRK8X81
CITIGROUP INC ($65,906,352)(245,400,000) N/A 02/25/41-0.10%SL602H5J
CITIGROUP INC ($19,996,512)(690,810,000) N/A 07/07/24-0.03%DDD580505
CITIGROUP INC ($11,843,534)(43,600,000) N/A 12/20/40-0.02%SL3B17XX
CITIGROUP INC ($10,658,647)(96,470,000) N/A 03/31/44-0.02%SL603I02
CITIGROUP INC ($7,100,260)(202,600,000) N/A 03/31/24-0.01%SL603HYV
CITIGROUP INC $1,635,026(39,700,000) N/A 03/27/250.00%DDD600396
CITIGROUP INC $1,660,921(39,700,000) N/A 03/27/250.00%DDD600392
CITIGROUP INC $7,777,906(3,657,620,000) N/A 10/17/170.01%DDD589707
CITIGROUP INC $14,127,508(325,000,000) N/A 01/30/250.02%DDD596518
CITIGROUP INC $16,816,025(383,800,000) N/A 01/29/250.03%SL472PWU
CITIGROUP INC $28,127,399(514,670,000) N/A 02/03/250.04%DDD596698
CITIGROUP INC $62,337,551(1,535,390,000) N/A 01/27/250.09%DDD596227
CITIGROUP INC $94,916,267(2,081,160,000) N/A 01/22/250.14%DDD595980
Page 1 of 9
2. Portfolio Holdings for Templeton Global Bond Fund as of June 30, 2015
Security Name Market Value
Shares/
Positions Held
Coupon
Rate
Maturity
Date
% of
TNA
Security
Identifier
CITIGROUP INC $106,084,489(2,601,430,000) N/A 01/23/250.16%SLMH1CEK
DEUTSCHE BANK AG ($41,376,477)(471,880,000) N/A 03/28/21-0.06%SL471X8L
DEUTSCHE BANK AG ($6,738,137)(54,025,000) N/A 03/18/44-0.01%DDD572648
DEUTSCHE BANK AG ($3,745,434)(114,725,000) N/A 03/18/24-0.01%DDD572645
DEUTSCHE BANK AG ($3,640,191)(212,000,000) N/A 10/15/20-0.01%SL3X2B57
EXPORT-IMPORT BANK OF KOREA $16,804,76614,090,000 4.625% 02/20/170.03%B1RMM21
FEDERAL HOME LOAN BANK DISCOUN $15,000,00015,000,000 N/A 07/02/150.02%313384HQ5
FEDERAL HOME LOAN BANK DISCOUN $99,999,800100,000,000 N/A 07/07/150.15%313384HV4
FEDERAL HOME LOAN BANK DISCOUN $626,749,373626,750,000 N/A 07/06/150.94%313384HU6
FEDERAL HOME LOAN BANK DISCOUN $684,400,000684,400,000 N/A 07/01/151.03%313384HP7
FINANCING OF INFRASTRUCTURE PR $11,617,26923,747,000 8.375% 11/03/170.02%BBM58D8
FINANCING OF INFRASTRUCTURE PR $118,210,950238,810,000 7.4% 04/20/180.18%31771VAB9
FOOD CORPORATION OF INDIA $383,490,35522,550,000,000 9.95% 03/07/220.58%BMH4BH2
HUNGARIAN DEVELOPMENT BANK $279,351,250250,000,000 6.25% 10/21/200.42%55280GAA7
HUNGARY GOVERNMENT BOND $62,461,06115,576,440,000 5.5% 06/24/250.09%X0R83EJZ8
HUNGARY GOVERNMENT BOND $65,984,03417,183,510,000 6.75% 02/24/170.10%B1HL5Q3
HUNGARY GOVERNMENT BOND $91,019,51721,125,910,000 7.5% 11/12/200.14%B00MQD0
HUNGARY GOVERNMENT BOND $96,166,40725,821,730,000 4% 04/25/180.14%X0R83EJY1
HUNGARY GOVERNMENT BOND $148,920,22738,023,730,000 5.5% 12/20/180.22%B93ZW86
HUNGARY GOVERNMENT BOND $168,129,85739,464,430,000 7% 06/24/220.25%B67G0S0
HUNGARY GOVERNMENT BOND $192,534,76647,097,950,000 6% 11/24/230.29%B23WL03
HUNGARY GOVERNMENT BOND $303,925,82974,957,040,000 6.5% 06/24/190.46%B2QGP11
HUNGARY GOVERNMENT BOND $439,708,489110,833,790,000 6.75% 11/24/170.66%7248052
HUNGARY TREASURY BILL $14,648,3044,151,970,000 N/A 09/16/150.02%X0R83ERS5
ICELAND GOVERNMENT INTERNATION $195,390,384173,200,000 5.875% 05/11/220.29%451029AE2
IFT MONEY MARKET PORTFOLIO $14,178,886,58814,178,886,588 N/A N/A21.32%8611239C3
INDIA GOVERNMENT BOND $8,647,806561,300,000 7.28% 06/03/190.01%BBGB069
INDIA GOVERNMENT BOND $65,046,8244,378,700,000 7.16% 05/20/230.10%BBGB6Y9
INDIA GOVERNMENT BOND $67,858,9804,260,400,000 8.35% 05/14/220.10%B05HF33
INDIA GOVERNMENT BOND $69,242,3634,362,400,000 8.28% 09/21/270.10%B2889N5
INDIA GOVERNMENT BOND $170,736,94310,842,300,000 8.12% 12/10/200.26%B8VZ7M0
INDIA GOVERNMENT BOND $224,931,37514,439,400,000 7.8% 05/03/200.34%B40G812
INDIA GOVERNMENT BOND $244,328,42614,975,000,000 8.6% 06/02/280.37%BNJZTT8
Page 2 of 9
3. Portfolio Holdings for Templeton Global Bond Fund as of June 30, 2015
Security Name Market Value
Shares/
Positions Held
Coupon
Rate
Maturity
Date
% of
TNA
Security
Identifier
INDIA GOVERNMENT BOND $618,996,52337,754,900,000 8.83% 11/25/230.93%BLRX796
INDONESIA GOVERNMENT $102,0501,150,000,000 15% 07/15/180.00%B0NDS45
INDONESIA GOVERNMENT $6,295,70966,550,000,000 12% 09/15/260.01%B17FWD1
INDONESIA GOVERNMENT $8,163,773104,700,000,000 10% 07/15/170.01%B06CP82
INDONESIA GOVERNMENT $14,340,382185,655,000,000 10.75% 05/15/160.02%B09MY93
INDONESIA GOVERNMENT $16,412,903197,824,000,000 10% 09/15/240.02%B1W6P30
INDONESIA GOVERNMENT $26,277,274341,640,000,000 9% 09/15/180.04%B283996
INDONESIA GOVERNMENT $27,888,662337,191,000,000 10.25% 07/15/220.04%B1SDSD6
INDONESIA GOVERNMENT $36,583,400437,062,000,000 11.5% 09/15/190.06%B1377F8
INDONESIA GOVERNMENT $37,817,504500,399,000,000 8.375% 09/15/260.06%B4NPD22
INDONESIA GOVERNMENT $45,753,128612,998,000,000 7.875% 04/15/190.07%BDWZ4N4
INDONESIA GOVERNMENT $50,092,049556,845,000,000 11.75% 08/15/230.08%Y39814DS7
INDONESIA GOVERNMENT $62,855,278710,760,000,000 11% 09/15/250.09%Y39814DU2
INDONESIA GOVERNMENT $69,977,910818,390,000,000 10.25% 07/15/270.11%B1P8MS7
INDONESIA GOVERNMENT $75,862,380816,108,000,000 12.9% 06/15/220.11%B114G54
INDONESIA GOVERNMENT $78,920,353896,704,000,000 10.5% 08/15/300.12%B45ZFW4
INDONESIA GOVERNMENT $81,163,726968,028,000,000 11% 11/15/200.12%B0BSGY8
INDONESIA GOVERNMENT $138,080,9821,522,849,000,000 12.8% 06/15/210.21%B0Y51T6
INDONESIA GOVERNMENT $156,338,2071,854,867,000,000 10% 02/15/280.24%B2490L7
INDONESIA GOVERNMENT $161,359,2392,039,169,000,000 9% 03/15/290.24%BDZCRY4
INDONESIA GOVERNMENT $218,309,8562,917,910,000,000 8.375% 03/15/340.33%BCV7LV1
INDONESIA GOVERNMENT $226,336,5672,825,220,000,000 9.5% 07/15/230.34%B23GK97
INDONESIA GOVERNMENT $309,717,8434,130,513,000,000 8.25% 07/15/210.47%B44K553
INDONESIA GOVERNMENT $329,160,4894,362,359,000,000 8.375% 03/15/240.49%Y39814JK8
INDONESIA RETAIL BOND $5,385,60070,944,000,000 8.5% 10/15/160.01%BGQYSR0
INDONESIA TREASURY BILL $40,605,882560,119,000,000 N/A 02/04/160.06%Y6S86ZCA5
INDONESIA TREASURY BILL $65,988,803908,570,000,000 N/A 01/07/160.10%Y6S86ZBX6
INTER-AMERICAN DEVELOPMENT BAN $178,901,7382,473,000,000 7.5% 12/05/240.27%B1XMGC3
IRELAND REP OF $911,622,798612,637,230 5.4% 03/13/251.37%B4TV0D4
JPMORGAN CHASE & CO ($66,029,383)(245,400,000) N/A 02/25/41-0.10%SL602H6G
JPMORGAN CHASE & CO ($64,751,262)(332,000,000) N/A 11/23/40-0.10%SL6Q22S7
JPMORGAN CHASE & CO ($57,043,340)(234,600,000) N/A 01/11/41-0.09%SL3B187C
JPMORGAN CHASE & CO ($48,836,672)(184,050,000) N/A 02/28/41-0.07%SLFI0TBB
Page 3 of 9
4. Portfolio Holdings for Templeton Global Bond Fund as of June 30, 2015
Security Name Market Value
Shares/
Positions Held
Coupon
Rate
Maturity
Date
% of
TNA
Security
Identifier
JPMORGAN CHASE & CO ($15,935,358)(61,350,000) N/A 03/01/41-0.02%SLF0149C
JPMORGAN CHASE & CO ($9,048,247)(101,430,000) N/A 03/04/21-0.01%SL4K2FAX
KOREA MONETARY STAB BOND $13,977,15415,612,800,000 1.92% 03/09/160.02%BWBXP62
KOREA MONETARY STAB BOND $136,197,103152,005,000,000 2.81% 10/02/150.20%BFG2VL2
KOREA MONETARY STAB BOND $138,735,986155,561,800,000 N/A 08/04/150.21%Y7277E3B7
KOREA MONETARY STAB BOND $164,328,050185,305,400,000 N/A 12/15/150.25%BYNBYL6
KOREA MONETARY STAB BOND $183,304,928206,084,800,000 N/A 10/06/150.28%BWY4YL0
KOREA MONETARY STAB BOND $191,514,409214,621,000,000 N/A 07/21/150.29%BVG2ZR8
KOREA MONETARY STAB BOND $195,107,996216,924,000,000 2.22% 10/02/160.29%BRJ2WT8
KOREA MONETARY STAB BOND $197,638,794219,279,000,000 2.8% 04/02/160.30%BLDY6J6
KOREA MONETARY STAB BOND $199,987,029223,563,600,000 2.13% 10/08/150.30%Y7277EZ97
KOREA MONETARY STAB BOND $204,536,579228,964,300,000 1.62% 06/09/160.31%BZ07RH1
KOREA MONETARY STAB BOND $207,540,966232,085,700,000 1.74% 05/09/160.31%BXRTCZ9
KOREA MONETARY STAB BOND $239,210,337267,910,100,000 N/A 07/07/150.36%BWY4YK9
KOREA MONETARY STAB BOND $302,669,188337,287,200,000 1.96% 02/02/170.46%BVVT4R7
KOREA MONETARY STAB BOND $332,386,166371,739,100,000 2.8% 08/02/150.50%BCZSWQ2
KOREA MONETARY STAB BOND $339,835,369381,607,200,000 N/A 09/08/150.51%BZ07QS5
KOREA MONETARY STAB BOND $367,568,087407,886,800,000 2.46% 08/02/160.55%BPZ5D38
KOREA MONETARY STAB BOND $608,994,730677,869,000,000 2.07% 12/02/160.92%BT9QB75
KOREA MONETARY STAB BOND $615,958,078682,221,200,000 2.79% 06/02/160.93%BN791V8
KOREA MONETARY STAB BOND $724,885,722805,900,480,000 2.78% 02/02/161.09%BJTCKY3
KOREA MONETARY STAB BOND $1,041,841,3901,159,921,000,000 2.9% 12/02/151.57%BH57FB0
KOREA REPUBLIC OF $16,248,27113,150,000 5.625% 11/03/250.02%50064FAE4
KOREA TREASURY BOND $23,388,45826,000,000,000 5.25% 09/10/150.04%B0LDCF6
KOREA TREASURY BOND $74,330,68182,830,000,000 4% 09/10/150.11%B3TJZX6
KOREA TREASURY BOND $162,474,725175,000,000,000 5% 09/10/160.24%B1FJBZ0
KOREA TREASURY BOND $725,293,159798,759,900,000 4% 03/10/161.09%B65QF21
KOREA TREASURY BOND $832,174,585914,279,640,000 3% 12/10/161.25%BH4H384
KOREA TREASURY BOND $934,432,4291,035,106,700,000 2.75% 06/10/161.40%BBGB791
LETRA TESOURO NACIONAL $145,003,280615,590 N/A 01/01/180.22%BJ38WR4
LETRA TESOURO NACIONAL $168,180,212559,730 N/A 01/01/160.25%B52JL84
LETRA TESOURO NACIONAL $261,108,363988,370 N/A 01/01/170.39%BBGB7X5
LITHUANIA REPUBLIC OF $117,115,642101,430,000 6.125% 03/09/210.18%536878AF8
Page 4 of 9
5. Portfolio Holdings for Templeton Global Bond Fund as of June 30, 2015
Security Name Market Value
Shares/
Positions Held
Coupon
Rate
Maturity
Date
% of
TNA
Security
Identifier
LITHUANIA REPUBLIC OF $309,482,595259,310,000 7.375% 02/11/200.47%536878AD3
MAHANAGAR TELEPHONE NIGAM LTD $48,580,1593,050,000,000 8.29% 11/28/240.07%BTC0L30
MAHANAGAR TELEPHONE NIGAM LTD $53,237,3083,350,000,000 8.24% 11/19/240.08%Y5401FAD5
MALAYSIA GOVT $5,769,29221,690,000 3.394% 03/15/170.01%BKWB0W2
MALAYSIA GOVT $98,942,026372,810,000 3.314% 10/31/170.15%B7GJDB1
MALAYSIA GOVT $167,372,588621,340,000 4.012% 09/15/170.25%B4PDW94
MALAYSIA GOVT $187,123,873698,910,000 3.814% 02/15/170.28%B1RPMZ3
MALAYSIA GOVT $204,394,127771,235,000 3.197% 10/15/150.31%B7GH3H1
MALAYSIA GOVT $220,932,769833,340,000 3.835% 08/12/150.33%B61CG75
MALAYSIA GOVT $543,111,5512,022,127,000 4.262% 09/15/160.82%B11ZPD8
MALAYSIA GOVT $588,556,4752,219,210,000 3.172% 07/15/160.88%B84XNT0
MALAYSIA GOVT $665,443,7712,501,900,000 4.72% 09/30/151.00%B09W567
MALAYSIA TREASURY BILL $174,452660,000 N/A 07/24/150.00%Y55745SS6
MALAYSIA TREASURY BILL $197,558750,000 N/A 09/11/150.00%BWC50B7
MALAYSIA TREASURY BILL $503,0701,910,000 N/A 09/04/150.00%EK7841902
MALAYSIA TREASURY BILL $607,0672,340,000 N/A 03/18/160.00%EK8109853
MALAYSIA TREASURY BILL $2,940,36111,110,000 N/A 07/10/150.00%BX1BD36
MALAYSIA TREASURY BILL $3,356,89712,700,000 N/A 07/24/150.01%Y55745VE3
MALAYSIA TREASURY BILL $3,753,32414,290,000 N/A 10/09/150.01%BWZMK37
MALAYSIA TREASURY BILL $3,772,18114,280,000 N/A 07/31/150.01%Y55745UF1
MALAYSIA TREASURY BILL $3,799,60714,440,000 N/A 09/25/150.01%BWSW7B1
MALAYSIA TREASURY BILL $4,163,40015,870,000 N/A 10/23/150.01%EK8722663
MALAYSIA TREASURY BILL $10,906,30242,220,000 N/A 05/27/160.02%BYL7YL6
MALAYSIA TREASURY BILL $13,623,34152,690,000 N/A 04/29/160.02%BWWC1Z9
MALAYSIA TREASURY BILL $14,008,56053,090,000 N/A 08/14/150.02%BVY9RM0
MALAYSIA TREASURY BILL $62,208,514238,220,000 N/A 12/11/150.09%EK9665119
MALAYSIA TREASURY BILL $69,521,165263,950,000 N/A 09/04/150.10%BYZZB93
MEXICAN CETES $37,950,78360,299,450 N/A 10/29/150.06%P4R07XLN4
MEXICAN CETES $44,578,49970,223,200 N/A 07/23/150.07%P4R07XHF6
MEXICAN CETES $55,560,63389,121,830 N/A 02/04/160.08%P4R07XJU1
MEXICAN CETES $59,577,00094,766,410 N/A 11/12/150.09%P4R07XJB3
MEXICAN CETES $74,321,003120,598,900 N/A 05/26/160.11%P4R07XLR5
MEXICAN CETES $90,354,734145,788,660 N/A 03/31/160.14%EK8335144
Page 5 of 9
6. Portfolio Holdings for Templeton Global Bond Fund as of June 30, 2015
Security Name Market Value
Shares/
Positions Held
Coupon
Rate
Maturity
Date
% of
TNA
Security
Identifier
MEXICAN CETES $192,700,506307,344,110 N/A 12/10/150.29%P4R07XJG2
MEXICAN CETES $270,731,329428,471,890 N/A 09/17/150.41%BRJ6Q87
MEXICAN CETES $274,004,378440,752,650 N/A 03/03/160.41%P4R07XJZ0
MEXICAN CETES $276,880,187447,301,160 N/A 04/14/160.42%BX9CYK5
MEXICAN CETES $313,155,330500,731,550 N/A 01/07/160.47%P4R07XJN7
MEXICAN CETES $344,983,825546,702,930 N/A 10/01/150.52%P4R07XHU3
MEXICAN FIXED RATE BONDS $610,025,89393,478,050 6.25% 06/16/160.92%B6WC685
MEXICAN FIXED RATE BONDS $728,105,147105,964,150 7.75% 12/14/171.09%B2PGD74
MEXICAN FIXED RATE BONDS $934,034,878140,065,800 7.25% 12/15/161.40%B1QJKS5
MEXICAN FIXED RATE BONDS $1,452,921,700223,461,510 8% 12/17/152.18%B0Y7SL3
MEXICAN UDIBONOS $37,308,7175,769,411 2.5% 12/10/200.06%B57K9Y4
MEXICAN UDIBONOS $49,746,5057,205,854 4% 06/13/190.07%B59ZFP0
MEXICAN UDIBONOS $77,983,90411,517,979 3.5% 12/14/170.12%B39TML3
MEXICAN UDIBONOS $90,713,12613,594,125 5% 06/16/160.14%B1KG639
MONETARY AUTHORITY OF SINGAPOR $61,029,87382,230,000 N/A 07/20/150.09%BTZ0M67
MONETARY AUTHORITY OF SINGAPOR $91,690,980123,630,000 N/A 08/21/150.14%BTZ0MR8
MONETARY AUTHORITY OF SINGAPOR $618,106,471832,660,000 N/A 07/10/150.93%BTZ0LF9
MONETARY AUTHORITY OF SINGAPOR $1,365,896,2111,839,790,000 N/A 07/03/152.05%Y6132GGM1
NOTA DO TESOURO NACIONAL NTNB $3,749,9634,429 6% 05/15/170.01%B39VBY5
NOTA DO TESOURO NACIONAL NTNB $32,830,14839,290 6% 08/15/200.05%B4L4D09
NOTA DO TESOURO NACIONAL NTNB $112,893,455133,230 6% 08/15/20500.17%P80551PG6
NOTA DO TESOURO NACIONAL NTNB $213,686,889252,192 6% 08/15/240.32%B1G0VN0
NOTA DO TESOURO NACIONAL NTNB $316,677,077379,926 6% 05/15/230.48%BKXH223
NOTA DO TESOURO NACIONAL NTNB $383,867,178458,561 6% 05/15/190.58%BKRCXK9
NOTA DO TESOURO NACIONAL NTNB $875,102,6581,050,004 6% 08/15/221.32%B7QMXZ4
NOTA DO TESOURO NACIONAL NTNF $53,992,058176,750 10.0818% 01/01/170.08%B1VRLR0
NOTA DO TESOURO NACIONAL NTNF $56,611,985195,750 10.0818% 01/01/210.09%B62L3V4
NOTA DO TESOURO NACIONAL NTNF $169,319,959569,840 10.0818% 01/01/190.25%B9LDZM7
NOTA DO TESOURO NACIONAL NTNF $211,027,979744,290 10.0818% 01/01/230.32%B4Q5YM6
PERU BOND SOBERANO $64,459,251184,399,000 7.84% 08/12/200.10%B0TP8N4
PHILIPPINE GOVERNMENT $10,715,483473,140,000 7% 01/27/160.02%B665ZV6
PHILIPPINE GOVERNMENT $14,572,297619,630,000 9.125% 09/04/160.02%B1MT4D2
PHILIPPINE GOVERNMENT $39,246,2881,756,700,000 4.625% 11/25/150.06%B4LHWV2
Page 6 of 9
7. Portfolio Holdings for Templeton Global Bond Fund as of June 30, 2015
Security Name Market Value
Shares/
Positions Held
Coupon
Rate
Maturity
Date
% of
TNA
Security
Identifier
PHILIPPINE GOVERNMENT $466,417,95521,153,300,000 1.625% 04/25/160.70%BBBSDB1
PHILIPPINE TREASURY BILL $12,607,892570,350,000 N/A 09/02/150.02%Y6972FVC1
PHILIPPINE TREASURY BILL $14,967,428679,160,000 N/A 11/04/150.02%BSLVGK9
PHILIPPINE TREASURY BILL $26,265,2081,199,320,000 N/A 03/02/160.04%BW38R69
PHILIPPINE TREASURY BILL $32,108,1461,449,270,000 N/A 07/08/150.05%EK3661098
PHILIPPINE TREASURY BILL $33,687,5161,522,570,000 N/A 08/05/150.05%BQ15TJ7
PHILIPPINE TREASURY BILL $34,731,8801,583,570,000 N/A 02/03/160.05%EK7235097
PHILIPPINE TREASURY BILL $43,374,6601,971,210,000 N/A 12/02/150.07%Y6972FVH0
PHILIPPINE TREASURY BILL $48,071,3052,178,340,000 N/A 10/07/150.07%EK5315479
POLAND GOVERNMENT $79,793,939285,830,000 4.75% 04/25/170.12%B7D6MY1
POLAND GOVERNMENT $154,177,063495,970,000 5.75% 09/23/220.23%7441947
POLAND GOVERNMENT $451,867,6951,721,975,000 2.01% 01/25/210.68%B4P06N7
POLAND GOVERNMENT $533,132,5432,005,988,000 2.01% 01/25/170.80%X8T0D6AT5
POLAND GOVERNMENT $674,546,4112,472,048,000 5% 04/25/161.01%B4QH8F3
POLAND GOVERNMENT $838,528,0133,039,400,000 4.75% 10/25/161.26%B764P21
POLAND GOVERNMENT $1,393,485,8935,168,683,000 6.25% 10/24/152.10%B039PM0
POLAND REPUBLIC OF $344,758,927297,700,000 6.375% 07/15/190.52%731011AR3
PORTUGAL REPUBLIC OF $7,544,3325,772,600 4.95% 10/25/230.01%B39RJP0
PORTUGAL REPUBLIC OF $19,633,38714,427,600 5.65% 02/15/240.03%B94V863
PORTUGAL REPUBLIC OF $967,736,560820,750,000 3.875% 02/15/301.45%BQQLM80
REPUBLIC OF HUNGARY $51,172,55641,781,000 3.875% 02/24/200.08%B06CGC3
REPUBLIC OF HUNGARY $90,293,46783,320,000 5.375% 03/25/240.14%445545AL0
REPUBLIC OF HUNGARY $110,161,26892,652,000 4.375% 07/04/170.17%B1P8L80
REPUBLIC OF HUNGARY $131,096,171125,727,000 4.125% 02/19/180.20%445545AG1
REPUBLIC OF HUNGARY $181,139,438143,730,000 5.75% 06/11/180.27%B39TPG9
REPUBLIC OF HUNGARY $232,135,142179,922,000 6% 01/11/190.35%B3SWTJ0
REPUBLIC OF HUNGARY $274,366,683252,890,000 5.375% 02/21/230.41%445545AH9
REPUBLIC OF HUNGARY $437,473,336390,004,000 6.25% 01/29/200.66%445545AD8
REPUBLIC OF HUNGARY $1,055,881,452927,200,000 6.375% 03/29/211.59%445545AE6
REPUBLIC OF PORTUGAL $603,155,752585,500,000 5.125% 10/15/240.91%737271AE6
SERBIA (REPUBLIC OF) $104,209,134100,490,000 5.25% 11/21/170.16%817477AC6
SERBIA (REPUBLIC OF) $193,283,631190,710,000 4.875% 02/25/200.29%817477AD4
SERBIA (REPUBLIC OF) $237,918,639211,710,000 7.25% 09/28/210.36%817477AB8
Page 7 of 9
8. Portfolio Holdings for Templeton Global Bond Fund as of June 30, 2015
Security Name Market Value
Shares/
Positions Held
Coupon
Rate
Maturity
Date
% of
TNA
Security
Identifier
SINGAPORE GOVERNMENT $243,997,691328,050,000 1.125% 04/01/160.37%Y7996FUC2
SLOVENIA (REPUBLIC OF) $442,661,390397,289,000 5.5% 10/26/220.67%831594AB2
SLOVENIA (REPUBLIC OF) $462,862,699408,080,000 5.85% 05/10/230.70%831594AD8
SRI LANKA GOVERNMENT BOND $3,620,146476,700,000 8% 01/01/170.01%Y2836MDM9
SRI LANKA GOVERNMENT BOND $4,145,787557,250,000 8% 11/01/190.01%B9BBZD2
SRI LANKA GOVERNMENT BOND $4,231,025557,250,000 8% 06/15/170.01%B7TC4P8
SRI LANKA GOVERNMENT BOND $5,898,839810,400,000 5.8% 07/15/170.01%B8K36Q2
SRI LANKA GOVERNMENT BOND $6,917,535907,610,000 8.25% 03/01/170.01%BLT1RS7
SRI LANKA GOVERNMENT BOND $8,376,4551,127,970,000 7.5% 08/15/180.01%B833595
SRI LANKA GOVERNMENT BOND $10,573,6591,421,400,000 6.4% 10/01/160.02%Y2836MBG4
SRI LANKA GOVERNMENT BOND $10,758,8781,288,300,000 11.2% 07/01/220.02%Y2029SFF6
SRI LANKA GOVERNMENT BOND $15,058,2031,975,710,000 8.5% 07/15/180.02%B7T58T9
SRI LANKA GOVERNMENT BOND $15,615,0352,094,100,000 6.4% 08/01/160.02%Y2835MY88
SRI LANKA GOVERNMENT BOND $17,794,4492,419,800,000 5.8% 01/15/170.03%Y2835M5K3
SRI LANKA GOVERNMENT BOND $19,325,4132,571,370,000 8.5% 11/01/150.03%BKZG2H3
SRI LANKA GOVERNMENT BOND $25,912,0933,443,800,000 11% 09/01/150.04%B4L4SJ3
SRI LANKA GOVERNMENT BOND $26,055,1303,488,190,000 6.5% 07/15/150.04%B5SR7Q2
SRI LANKA GOVERNMENT BOND $50,131,2366,671,840,000 8% 11/15/180.08%Y2835NCQ0
SRI LANKA GOVERNMENT BOND $56,091,4907,340,380,000 8.5% 04/01/180.08%B96X4J2
SRI LANKA GOVERNMENT BOND $57,480,2257,532,460,000 8.5% 06/01/180.09%Y2835NGF0
SRI LANKA GOVERNMENT BOND $59,802,2037,357,980,000 10.6% 07/01/190.09%BHZGQ47
SRI LANKA GOVERNMENT BOND $77,427,07910,254,020,000 9% 05/01/210.12%B8NX7D3
SRI LANKA GOVERNMENT BOND $113,997,52815,208,000,000 11% 08/01/150.17%Y2835MYP0
SRI LANKA GOVERNMENT BOND $150,052,12218,459,660,000 10.6% 09/15/190.23%Y2029SKF0
UKRAINE GOVERNMENT $5,551,87510,500,000 6.875% 09/23/150.01%B3LRJQ9
UKRAINE GOVERNMENT $29,975,93250,870,000 4.95% 10/13/150.05%B0ZL405
UKRAINE GOVERNMENT $41,182,49082,883,000 6.75% 11/14/170.06%B295N00
UKRAINE GOVERNMENT $67,510,750135,700,000 6.58% 11/21/160.10%903724AB8
UKRAINE GOVERNMENT $89,536,411181,290,000 7.75% 09/23/200.13%603674AA0
UKRAINE GOVERNMENT $143,920,330273,808,000 7.5% 04/17/230.22%903724AG7
UKRAINE GOVERNMENT $173,144,611349,346,000 6.25% 06/17/160.26%903724AC6
UKRAINE GOVERNMENT $292,766,093554,350,000 7.95% 02/23/210.44%126826AH9
UKRAINE GOVERNMENT $301,312,331572,565,000 7.8% 11/28/220.45%903724AF9
Page 8 of 9