SlideShare a Scribd company logo
MLS MARKET STATS AS OF JUNE 30
Average DOM-YTD    2008    2009     % CHG    Total Expired-YTD        2008       2009     % CHG
Nassau County      101      119     17.82%   Nassau County            3106       2956      -4.83%
Bellmore           105      105     0.00%    Bellmore                  77         43      -44.16%
East Meadow        105      112     6.67%    East Meadow               48         43      -10.42%
Elmont             119      119     0.00%    Elmont                   167        135      -19.16%
Farmingdale        124      103    -16.94%   Farmingdale               63         55      -12.70%
Hicksville         108      115     6.48%    Hicksville                69         66       -4.35%
Levittown          103      108     4.85%    Levittown                 93         54      -41.94%
Lido Beach         214      153    -28.50%   Lido Beach                7          12      71.43%
Long Beach         140      112    -20.00%   Long Beach                63         78      23.81%
Massapequa         100      105     5.00%    Massapequa               107        125      16.82%
Merrick            133      130     -2.26%   Merrick                   53         63      18.87%
Plainview          108      109     0.93%    Plainview                 51         47       -7.84%
Seaford            100      113     13.00%   Seaford                   37         22      -40.54%
Wantagh             99      97      -2.02%   Wantagh                   36         30      -16.67%

New Listings-YTD    2008    2009    % CHG    Total Active Listings    2008       2009     % CHG
Nassau County      11627   10553    -9.24%   Nassau County            9398       8,403    -10.59%
Bellmore            269      228   -15.24%   Bellmore                 192         161     -16.15%
East Meadow         286      203   -29.02%   East Meadow              181         138     -23.76%
Elmont              254      318    25.20%   Elmont                               285        N/A
Farmingdale         225      219    -2.67%   Farmingdale               163        140     -14.11%
Hicksville          208      272    30.77%   Hicksville                           165        N/A
Levittown           373      287   -23.06%   Levittown                 260        186     -28.46%
Lido Beach           20      34     70.00%   Lido Beach                            29        N/A
Long Beach          173      243    40.46%   Long Beach                           218        N/A
Massapequa          577      521    -9.71%   Massapequa                437        333     -23.80%
Merrick             204      277    35.78%   Merrick                              197        N/A
Plainview           184      233    26.63%   Plainview                            155        N/A
Seaford             157      162    3.18%    Seaford                   118        108      -8.47%
Wantagh             228      206    -9.65%   Wantagh                   134        114     -14.93%

Total Closed-YTD   2008    2009     % CHG    Avg. Sales Price-YTD      2008       2009    % CHG
Nassau County      3436    3004    -12.57%   Nassau County           $626,518   $498,768 -$127,750
Bellmore           111      82     -26.13%   Bellmore                $445,352   $407,322 -$38,030
East Meadow        102      74     -27.45%   East Meadow             $433,254   $396,298 -$36,956
Elmont              82      81      -1.22%   Elmont                  $359,586   $301,551 -$58,035
Farmingdale         79      80      1.27%    Farmingdale             $392,430   $377,352 -$15,078
Hicksville         105      101     -3.81%   Hicksville              $425,995   $371,212 -$54,783
Levittown          123      100    -18.70%   Levittown               $362,365   $325,387 -$36,978
Lido Beach          6        7      16.67%   Lido Beach              $853,750   $669,571 -$184,179
Long Beach          82      71     -13.41%   Long Beach              $528,733   $498,601 -$30,132
Massapequa         199      258     29.65%   Massapequa              $503,559   $446,632 -$56,927
Merrick            114      94     -17.54%   Merrick                 $550,786   $489,229 -$61,557
Plainview           81      74      -8.64%   Plainview               $529,169   $491,199 -$37,970
Seaford             50      54      8.00%    Seaford                 $445,433   $400,602 -$44,831
Wantagh            118      85     -27.97%   Wantagh                 $462,543   $418,000 -$44,543
MLS MARKET STATS AS OF JUNE 30


                                                           AVERAGE DAYS ON MARKET TREND
                       250


                       200

                       150
2009 - Year To Date


                       100

                        50


                          0

                       (50)
                                     East Meadow       Farmingdale          Levittown         Long Beach        Merrick           Seaford
                              Bellmore          Elmont           Hicksville          Lido Beach       Massapequa        Plainview         Wantagh

                                                                CLOSED SALES MARKET TREND
                       350

                       300

                       250

                       200
 2009 - Year To Date


                       150

                       100

                        50

                         0

                        -50

                       -100

                       -150
                                         East Meadow            Farmingdale                Levittown                Long Beach           Merrick               Seaford
                              Bellmore                 Elmont                 Hicksville               Lido Beach             Massapequa           Plainview             Wantagh


                                                        AVERAGE SALES PRICE MARKET TREND
                       $1,300,000
                       $1,200,000
                       $1,100,000
                       $1,000,000
                         $900,000
                         $800,000
                         $700,000
 2009 - Year To Date


                         $600,000
                         $500,000
                         $400,000
                         $300,000
                         $200,000
                         $100,000
                               $0
                         $100,000
                         $200,000
                         $300,000
                         $400,000
                         $500,000
                         $600,000
                                           East Meadow        Farmingdale           Levittown          Long Beach         Merrick           Seaford
                                    Bellmore           Elmont            Hicksville           Lido Beach       Massapequa         Plainview                              Wantagh
$0


  200
         $100,000

                     MLS MARKET STATS AS OF JUNE 30
         $200,000
         $300,000
         $400,000
         $500,000
         $600,000
                           East Meadow        Farmingdale           Levittown          Long Beach         Merrick           Seaford
                    Bellmore           Elmont            Hicksville           Lido Beach       Massapequa         Plainview           Wantagh


Average DOM-YTD                   2008        2009        % CHG             Total Expired-YTD                  2008         2009         % CHG
Nassau County                      101         119        17.82%            Nassau County                      3106         2956         -4.83%
Bellmore                           105         105         0.00%            Bellmore                            77           43          -44.16%
East Meadow                        105         112         6.67%            East Meadow                         48           43          -10.42%
Elmont                             119         119         0.00%            Elmont                             167           135         -19.16%
Farmingdale                        124         103        -16.94%           Farmingdale                         63           55          -12.70%
Hicksville                         108         115         6.48%            Hicksville                          69           66          -4.35%
Levittown                          103         108         4.85%            Levittown                           93           54          -41.94%
Massapequa                         100         105         5.00%            Massapequa                         107           125         16.82%
Merrick                            133         130         -2.26%           Merrick                             53           63          18.87%
Plainview                          108         109         0.93%            Plainview                           51           47          -7.84%
Seaford                            100         113        13.00%            Seaford                             37           22          -40.54%
Wantagh                            99           97         -2.02%           Wantagh                             36           30          -16.67%


New Listings-YTD                  2008        2009        % CHG             Total Active Listings              2008         2009         % CHG
Nassau County                     11627       10553       -9.24%            Nassau County                      9398         8403         -10.59%
Bellmore                           269         228        -15.24%           Bellmore                           192           161         -16.15%
East Meadow                        286         203        -29.02%           East Meadow                        181           138         -23.76%
Elmont                             254         318        25.20%            Elmont                               0           285           N/A
Farmingdale                        225         219         -2.67%           Farmingdale                        163           140         -14.11%
Hicksville                         208         272        30.77%            Hicksville                           0           165           N/A
Levittown                          373         287        -23.06%           Levittown                          260           186         -28.46%
Massapequa                         577         521         -9.71%           Massapequa                         437           333         -23.80%
Merrick                            204         277        35.78%            Merrick                              0           197           N/A
Plainview                          184         233        26.63%            Plainview                            0           155           N/A
Seaford                            157         162         3.18%            Seaford                            118           108         -8.47%
Wantagh                            228         206         -9.65%           Wantagh                            134           114         -14.93%


Total Closed-YTD                  2008        2009         % CHG            Avg. Sales Price-YTD              2008     2009    % CHG
Nassau County                     3436        3004        -12.57%           Nassau County                   $626,518 $498,768 -$127,750
Bellmore                           111          82        -26.13%           Bellmore                        $445,352 $407,322 -$38,030
East Meadow                        102          74        -27.45%           East Meadow                     $433,254 $396,298           -$36,956
Elmont                              82          81         -1.22%           Elmont                          $359,586 $301,551           -$58,035
Farmingdale                         79          80         1.27%            Farmingdale                     $392,430 $377,352           -$15,078
Hicksville                         105         101         -3.81%           Hicksville                      $425,995 $371,212           -$54,783
Levittown                          123         100        -18.70%           Levittown                       $362,365 $325,387           -$36,978
Massapequa                         199         258        29.65%            Massapequa                      $503,559 $446,632           -$56,927
Merrick                            114          94        -17.54%           Merrick                         $550,786 $489,229           -$61,557
Plainview                           81          74         -8.64%           Plainview                       $529,169 $491,199           -$37,970
Seaford                             50          54         8.00%            Seaford                         $445,433 $400,602           -$44,831
MLS MARKET STATS AS OF JUNE 30

Wantagh                                             118          85         -27.97%             Wantagh                         $462,543 $418,000          -$44,543

                                                        AVERAGE DAYS ON MARKET TREND
                        140

                        120

                        100
 2009 - Year To Date


                         80

                         60

                         40

                         20

                           0
                               Bellmore East Meadow Elmont Farmingdale Hicksville Levittown Massapequa Merrick                  Plainview    Seaford   Wantagh

                                                           CLOSED SALES MARKET TREND
                        350

                        300

                        250

                        200
  2009 - Year To Date


                        150

                        100

                         50

                          0

                         -50

                        -100

                        -150
                               Bellmore   East Meadow   Elmont   Farmingdale    Hicksville   Levittown   Massapequa   Merrick   Plainview    Seaford   Wantagh

                                                                 AVERAGE SALES PRICE MARKET TREND
                        $700,000

                        $600,000

                        $500,000

                        $400,000
  2009 - Year To Date


                        $300,000

                        $200,000

                        $100,000

                               $0

                        -$100,000

                        -$200,000
                                    Bellmore East Meadow Elmont       Farmingdale Hicksville   Levittown Massapequa Merrick      Plainview   Seaford   Wantagh
MLS MARKET STATS AS OF JUNE 30


 AVG DOM       Bellmore    East Meadow   Elmont      Farmingdale   Hicksville   Levittown
 2006 DOM         82             76        90             86          72            74
 2007 DOM        101            102       113            111         100            85
 2008 DOM        105            105       119            124         108           103
 2009 DOM        105            112        119           103          115          108
DIFFERENCE     28.05%        47.37%      32.22%        19.77%       59.72%       45.95%

               Bellmore    East Meadow    Elmont     Farmingdale   Hicksville   Levittown
2006 CLOSED      157            128         151          126          153          172
2007 CLOSED      131            115         103           86          148          173
2008 CLOSED      111            102         82            79          105          123
2009 CLOSED       82             74         81            80          101          100
DIFFERENCE        -75           -54         -70          -46          -52          -72

               Bellmore    East Meadow    Elmont     Farmingdale   Hicksville   Levittown
  2006 SP$     $526,393      $487,473    $433,508      $488,668    $457,002      $406,410
  2007 SP$     $496,564      $455,804    $428,392      $452,104    $436,853      $383,483
  2008 SP$     $445,352      $433,254    $359,586      $392,430    $425,995      $362,365
  2009 SP$     $407,322      $396,298    $301,551      $377,352    $371,212      $325,387
DIFFERENCE     -$119,071     -$91,175    -$131,957    -$111,316    -$85,790      -$81,023
MLS MARKET STATS AS OF JUNE 30


 AVG DOM       Bellmore    East Meadow   Elmont      Farmingdale   Hicksville   Levittown
 2006 DOM         82             76        90             86          72            74
 2007 DOM        101            102        113           111          100           85
 2008 DOM        105            105        119           124          108          103
 2009 DOM        105            112        119           103          115          108
DIFFERENCE     28.05%        47.37%      32.22%        19.77%       59.72%       45.95%

               Bellmore    East Meadow    Elmont     Farmingdale   Hicksville   Levittown
2006 CLOSED      157            128         151          126          153          172
2007 CLOSED      131            115         103           86          148          173
2008 CLOSED      111            102         82            79          105          123
2009 CLOSED       82             74         81            80          101          100
DIFFERENCE        -75           -54         -70          -46          -52          -72

               Bellmore    East Meadow    Elmont     Farmingdale   Hicksville   Levittown
  2006 SP$     $526,393      $487,473    $433,508      $488,668    $457,002      $406,410
  2007 SP$     $496,564      $455,804    $428,392      $452,104    $436,853      $383,483
  2008 SP$     $445,352      $433,254    $359,586      $392,430    $425,995      $362,365
  2009 SP$     $407,322      $396,298    $301,551      $377,352    $371,212      $325,387
DIFFERENCE     -$119,071     -$91,175    -$131,957    -$111,316    -$85,790      -$81,023
MLS MARKET STATS AS OF JUNE 30


Lido Beach   Long Beach   Massapequa   Merrick    Plainview   Seaford    Wantagh
    130          124          78          62          73         78        68
    146          124          99         119         100        108        90
    214          140         100         133         108        100        99
    153          112         105         130         109        113        97
  17.69%       -9.68%      34.62%      109.68%     49.32%     44.87%     42.65%

Lido Beach   Long Beach   Massapequa   Merrick    Plainview   Seaford    Wantagh
    11          106          286         204         106         83       124
     8          117          241         155         114         74       113
     6           82          199         114          81         50       118
     7           71          258         94           74         54        85
    -4          -35          -28        -110         -32        -29        -39

Lido Beach   Long Beach   Massapequa   Merrick    Plainview   Seaford    Wantagh
$1,172,288    $565,542     $539,934    $417,234   $572,558    $497,710   $508,540
 $728,750     $609,571     $521,131    $541,780   $566,485    $446,830   $490,170
 $853,750     $528,733     $503,559    $550,786   $529,169    $445,433   $462,543
 $669,571     $498,601     $446,632    $489,229   $491,199    $400,602   $418,000
 -$502,717    -$66,941     -$93,302     $71,995   -$81,359    -$97,108   -$90,540
MLS MARKET STATS AS OF JUNE 30


Massapequa    Merrick    Plainview   Seaford    Wantagh
    78           62          73        78         68
    99          119         100        108        90
   100          133         108        100        99
   105          130         109        113        97
 34.62%       109.68%     49.32%     44.87%     42.65%

Massapequa    Merrick    Plainview   Seaford    Wantagh
   286         204          106        83        124
   241         155          114        74        113
   199         114           81        50        118
   258          94           74        54         85
   -28         -110         -32        -29        -39

Massapequa    Merrick    Plainview   Seaford    Wantagh
 $539,934     $417,234   $572,558    $497,710   $508,540
 $521,131     $541,780   $566,485    $446,830   $490,170
 $503,559     $550,786   $529,169    $445,433   $462,543
 $446,632     $489,229   $491,199    $400,602   $418,000
 -$93,302     $71,995    -$81,359    -$97,108   -$90,540

More Related Content

What's hot

2011 Orange County Development Briefing
2011 Orange County Development Briefing2011 Orange County Development Briefing
2011 Orange County Development Briefing
The Chamber For a Greater Chapel Hill-Carrboro
 
Gsd 2009 83181 1 Nuevas Condiciones Kit M
Gsd 2009 83181 1 Nuevas Condiciones Kit MGsd 2009 83181 1 Nuevas Condiciones Kit M
Gsd 2009 83181 1 Nuevas Condiciones Kit Mluciana1010
 
Portfolio
PortfolioPortfolio
Portfolio
Armando Escabel
 
Land Feasibility Summary
Land Feasibility SummaryLand Feasibility Summary
Land Feasibility Summarystrutman61
 
MTM IX - Accounting Management Project Work
MTM IX - Accounting Management Project Work MTM IX - Accounting Management Project Work
MTM IX - Accounting Management Project Work MTM IULM
 

What's hot (6)

2011 Orange County Development Briefing
2011 Orange County Development Briefing2011 Orange County Development Briefing
2011 Orange County Development Briefing
 
Gsd 2009 83181 1 Nuevas Condiciones Kit M
Gsd 2009 83181 1 Nuevas Condiciones Kit MGsd 2009 83181 1 Nuevas Condiciones Kit M
Gsd 2009 83181 1 Nuevas Condiciones Kit M
 
Coches
CochesCoches
Coches
 
Portfolio
PortfolioPortfolio
Portfolio
 
Land Feasibility Summary
Land Feasibility SummaryLand Feasibility Summary
Land Feasibility Summary
 
MTM IX - Accounting Management Project Work
MTM IX - Accounting Management Project Work MTM IX - Accounting Management Project Work
MTM IX - Accounting Management Project Work
 

Similar to Form 2008 & 2009 Market Stats 06 Jun

Local Market Update April 2014 Honolulu Real Estate
Local Market Update April 2014 Honolulu Real EstateLocal Market Update April 2014 Honolulu Real Estate
Local Market Update April 2014 Honolulu Real Estate
Mark G. Howard, abr
 
Chicago Real Estate Market Data - Broken Down by City
Chicago Real Estate Market Data - Broken Down by CityChicago Real Estate Market Data - Broken Down by City
Chicago Real Estate Market Data - Broken Down by Citybethrepta
 
H W 2010 Q1 De 12 Mo
H W 2010 Q1 De 12 MoH W 2010 Q1 De 12 Mo
H W 2010 Q1 De 12 Mo
chipwags
 
H W 2010 Q3 De 12 Mo
H W 2010 Q3 De 12 MoH W 2010 Q3 De 12 Mo
H W 2010 Q3 De 12 Mochipwags
 
Wag Report 2009 Q4 De 12 Mo
Wag Report 2009 Q4 De 12 MoWag Report 2009 Q4 De 12 Mo
Wag Report 2009 Q4 De 12 Mo
chipwags
 
Austin Market Update January 2008
Austin Market Update January 2008Austin Market Update January 2008
Austin Market Update January 2008
Dee Patience
 
Hexter Fair Economic Forecast 021909 Allen
Hexter Fair Economic Forecast 021909 AllenHexter Fair Economic Forecast 021909 Allen
Hexter Fair Economic Forecast 021909 AllenSheriStinson
 
Reo Socal #S (8)
Reo Socal #S (8)Reo Socal #S (8)
Reo Socal #S (8)bdm4golf
 
One Coast, One Future
One Coast, One FutureOne Coast, One Future
One Coast, One Future
MetroCog
 
Hexter Fair Economic Forecast 012809
Hexter Fair Economic Forecast 012809Hexter Fair Economic Forecast 012809
Hexter Fair Economic Forecast 012809
Suzy Britz
 
2009 Economic Forecast by Hexter Fair
2009 Economic Forecast by Hexter Fair2009 Economic Forecast by Hexter Fair
2009 Economic Forecast by Hexter Fair
Suzy Britz
 
NJ Future population changes in built out municipalities 7-2012
NJ Future population changes in built out municipalities 7-2012NJ Future population changes in built out municipalities 7-2012
NJ Future population changes in built out municipalities 7-2012
New Jersey Future
 
May 2014 Multi-family Housing Activity Report – Boston, MA Real Estate
May 2014 Multi-family Housing Activity Report – Boston, MA Real EstateMay 2014 Multi-family Housing Activity Report – Boston, MA Real Estate
May 2014 Multi-family Housing Activity Report – Boston, MA Real Estate
Unit Realty Group
 
Chicagoland Quarterly Supply/Demand Report - 7/1/2011
Chicagoland Quarterly Supply/Demand Report - 7/1/2011Chicagoland Quarterly Supply/Demand Report - 7/1/2011
Chicagoland Quarterly Supply/Demand Report - 7/1/2011
chipwags
 
MARKETING OF FISH IN INDIA PRICE
MARKETING OF FISH IN INDIA PRICEMARKETING OF FISH IN INDIA PRICE
MARKETING OF FISH IN INDIA PRICEDEVIKA ANTHARJANAM
 
April 2013 Monthly Multi-family Housing Activity Report – Boston Real Estate
April 2013 Monthly Multi-family Housing Activity Report – Boston Real Estate April 2013 Monthly Multi-family Housing Activity Report – Boston Real Estate
April 2013 Monthly Multi-family Housing Activity Report – Boston Real Estate
Unit Realty Group
 
10.3 2016 investor presentation pea
10.3 2016 investor presentation   pea10.3 2016 investor presentation   pea
10.3 2016 investor presentation pea
FalcoCorporate
 
Boston Real Estate Report
Boston Real Estate ReportBoston Real Estate Report
Boston Real Estate Report
Joshua Stiles
 

Similar to Form 2008 & 2009 Market Stats 06 Jun (20)

Local Market Update April 2014 Honolulu Real Estate
Local Market Update April 2014 Honolulu Real EstateLocal Market Update April 2014 Honolulu Real Estate
Local Market Update April 2014 Honolulu Real Estate
 
Chicago Real Estate Market Data - Broken Down by City
Chicago Real Estate Market Data - Broken Down by CityChicago Real Estate Market Data - Broken Down by City
Chicago Real Estate Market Data - Broken Down by City
 
H W 2010 Q1 De 12 Mo
H W 2010 Q1 De 12 MoH W 2010 Q1 De 12 Mo
H W 2010 Q1 De 12 Mo
 
H W 2010 Q3 De 12 Mo
H W 2010 Q3 De 12 MoH W 2010 Q3 De 12 Mo
H W 2010 Q3 De 12 Mo
 
Wag Report 2009 Q4 De 12 Mo
Wag Report 2009 Q4 De 12 MoWag Report 2009 Q4 De 12 Mo
Wag Report 2009 Q4 De 12 Mo
 
Austin Market Update January 2008
Austin Market Update January 2008Austin Market Update January 2008
Austin Market Update January 2008
 
Hexter Fair Economic Forecast 021909 Allen
Hexter Fair Economic Forecast 021909 AllenHexter Fair Economic Forecast 021909 Allen
Hexter Fair Economic Forecast 021909 Allen
 
Reo Socal #S (8)
Reo Socal #S (8)Reo Socal #S (8)
Reo Socal #S (8)
 
Tmo Feb
Tmo FebTmo Feb
Tmo Feb
 
One Coast, One Future
One Coast, One FutureOne Coast, One Future
One Coast, One Future
 
Hexter Fair Economic Forecast 012809
Hexter Fair Economic Forecast 012809Hexter Fair Economic Forecast 012809
Hexter Fair Economic Forecast 012809
 
2009 Economic Forecast by Hexter Fair
2009 Economic Forecast by Hexter Fair2009 Economic Forecast by Hexter Fair
2009 Economic Forecast by Hexter Fair
 
NJ Future population changes in built out municipalities 7-2012
NJ Future population changes in built out municipalities 7-2012NJ Future population changes in built out municipalities 7-2012
NJ Future population changes in built out municipalities 7-2012
 
May 2014 Multi-family Housing Activity Report – Boston, MA Real Estate
May 2014 Multi-family Housing Activity Report – Boston, MA Real EstateMay 2014 Multi-family Housing Activity Report – Boston, MA Real Estate
May 2014 Multi-family Housing Activity Report – Boston, MA Real Estate
 
Chicagoland Quarterly Supply/Demand Report - 7/1/2011
Chicagoland Quarterly Supply/Demand Report - 7/1/2011Chicagoland Quarterly Supply/Demand Report - 7/1/2011
Chicagoland Quarterly Supply/Demand Report - 7/1/2011
 
MARKETING OF FISH IN INDIA PRICE
MARKETING OF FISH IN INDIA PRICEMARKETING OF FISH IN INDIA PRICE
MARKETING OF FISH IN INDIA PRICE
 
April 2013 Monthly Multi-family Housing Activity Report – Boston Real Estate
April 2013 Monthly Multi-family Housing Activity Report – Boston Real Estate April 2013 Monthly Multi-family Housing Activity Report – Boston Real Estate
April 2013 Monthly Multi-family Housing Activity Report – Boston Real Estate
 
10.3 2016 investor presentation pea
10.3 2016 investor presentation   pea10.3 2016 investor presentation   pea
10.3 2016 investor presentation pea
 
Jan Tmo
Jan TmoJan Tmo
Jan Tmo
 
Boston Real Estate Report
Boston Real Estate ReportBoston Real Estate Report
Boston Real Estate Report
 

Recently uploaded

Torun Center Residences Istanbul - Listing Turkey
Torun Center Residences Istanbul - Listing TurkeyTorun Center Residences Istanbul - Listing Turkey
Torun Center Residences Istanbul - Listing Turkey
Listing Turkey
 
SVN Live 6.3.24 Weekly Property Broadcast
SVN Live 6.3.24 Weekly Property BroadcastSVN Live 6.3.24 Weekly Property Broadcast
SVN Live 6.3.24 Weekly Property Broadcast
SVN International Corp.
 
Investing In The US As A Canadian… And How To Do It RIGHT!! (feat. Erwin Szet...
Investing In The US As A Canadian… And How To Do It RIGHT!! (feat. Erwin Szet...Investing In The US As A Canadian… And How To Do It RIGHT!! (feat. Erwin Szet...
Investing In The US As A Canadian… And How To Do It RIGHT!! (feat. Erwin Szet...
Volition Properties
 
How to keep your Home naturally Cool and Warm
How to keep your Home naturally Cool and WarmHow to keep your Home naturally Cool and Warm
How to keep your Home naturally Cool and Warm
Vinra Construction
 
Green Homes, Islamabad Presentation .pdf
Green Homes, Islamabad Presentation .pdfGreen Homes, Islamabad Presentation .pdf
Green Homes, Islamabad Presentation .pdf
ticktoktips
 
Simpolo Company Profile & Corporate Logo
Simpolo Company Profile & Corporate LogoSimpolo Company Profile & Corporate Logo
Simpolo Company Profile & Corporate Logo
simpolosparkteam
 
Killer Referans Bahcesehir Catalog Listing Turkey
Killer Referans Bahcesehir Catalog Listing TurkeyKiller Referans Bahcesehir Catalog Listing Turkey
Killer Referans Bahcesehir Catalog Listing Turkey
Listing Turkey
 
2BHK-3BHK NEW FLAT FOR SALE IN TUPUDANA,RANCHI.
2BHK-3BHK NEW FLAT FOR SALE IN TUPUDANA,RANCHI.2BHK-3BHK NEW FLAT FOR SALE IN TUPUDANA,RANCHI.
2BHK-3BHK NEW FLAT FOR SALE IN TUPUDANA,RANCHI.
aashiyanastardevelop
 
Biography and career about Lixin Azarmehr
Biography and career about Lixin AzarmehrBiography and career about Lixin Azarmehr
Biography and career about Lixin Azarmehr
Lixin Azarmehr
 
How to Scan Tenants in NYC - You Should Know!
How to Scan Tenants in NYC - You Should Know!How to Scan Tenants in NYC - You Should Know!
How to Scan Tenants in NYC - You Should Know!
BelgiumManagement
 
Hawthorn Module 1 Coverted to Slide Show - 04.06.2024.docx
Hawthorn Module 1 Coverted to Slide Show - 04.06.2024.docxHawthorn Module 1 Coverted to Slide Show - 04.06.2024.docx
Hawthorn Module 1 Coverted to Slide Show - 04.06.2024.docx
anothershaneroberts
 
One20 North Vancouver Floor Plans by Three Shores Development.
One20 North Vancouver Floor Plans by Three Shores Development.One20 North Vancouver Floor Plans by Three Shores Development.
One20 North Vancouver Floor Plans by Three Shores Development.
VickyAulakh1
 
Urbanrise Paradise on Earth - Unveiling Unprecedented Luxury in Exquisite Vil...
Urbanrise Paradise on Earth - Unveiling Unprecedented Luxury in Exquisite Vil...Urbanrise Paradise on Earth - Unveiling Unprecedented Luxury in Exquisite Vil...
Urbanrise Paradise on Earth - Unveiling Unprecedented Luxury in Exquisite Vil...
JagadishKR1
 
Architectural & Interior design portfolio.pdf
Architectural & Interior design portfolio.pdfArchitectural & Interior design portfolio.pdf
Architectural & Interior design portfolio.pdf
susantebinum
 
Omaxe Sports City Dwarka A Comprehensive Guide
Omaxe Sports City Dwarka A Comprehensive GuideOmaxe Sports City Dwarka A Comprehensive Guide
Omaxe Sports City Dwarka A Comprehensive Guide
omaxesportscitydwark
 
BricknBolt Understanding Load-Bearing Walls and Their Structural Support in H...
BricknBolt Understanding Load-Bearing Walls and Their Structural Support in H...BricknBolt Understanding Load-Bearing Walls and Their Structural Support in H...
BricknBolt Understanding Load-Bearing Walls and Their Structural Support in H...
BrickAndBolt
 
Optimizing Your MCA Lead Capture Process for Better Results
Optimizing Your MCA Lead Capture Process for Better ResultsOptimizing Your MCA Lead Capture Process for Better Results
Optimizing Your MCA Lead Capture Process for Better Results
Lead Generation Media
 
Rixos Tersane Istanbul Residences Brochure_May2024_ENG.pdf
Rixos Tersane Istanbul Residences Brochure_May2024_ENG.pdfRixos Tersane Istanbul Residences Brochure_May2024_ENG.pdf
Rixos Tersane Istanbul Residences Brochure_May2024_ENG.pdf
Listing Turkey
 
The KA Housing - Catalogue - Listing Turkey
The KA Housing - Catalogue - Listing TurkeyThe KA Housing - Catalogue - Listing Turkey
The KA Housing - Catalogue - Listing Turkey
Listing Turkey
 
Riverview City Loni Kalbhor Pune Brochure
Riverview City Loni Kalbhor Pune BrochureRiverview City Loni Kalbhor Pune Brochure
Riverview City Loni Kalbhor Pune Brochure
kishor21012022
 

Recently uploaded (20)

Torun Center Residences Istanbul - Listing Turkey
Torun Center Residences Istanbul - Listing TurkeyTorun Center Residences Istanbul - Listing Turkey
Torun Center Residences Istanbul - Listing Turkey
 
SVN Live 6.3.24 Weekly Property Broadcast
SVN Live 6.3.24 Weekly Property BroadcastSVN Live 6.3.24 Weekly Property Broadcast
SVN Live 6.3.24 Weekly Property Broadcast
 
Investing In The US As A Canadian… And How To Do It RIGHT!! (feat. Erwin Szet...
Investing In The US As A Canadian… And How To Do It RIGHT!! (feat. Erwin Szet...Investing In The US As A Canadian… And How To Do It RIGHT!! (feat. Erwin Szet...
Investing In The US As A Canadian… And How To Do It RIGHT!! (feat. Erwin Szet...
 
How to keep your Home naturally Cool and Warm
How to keep your Home naturally Cool and WarmHow to keep your Home naturally Cool and Warm
How to keep your Home naturally Cool and Warm
 
Green Homes, Islamabad Presentation .pdf
Green Homes, Islamabad Presentation .pdfGreen Homes, Islamabad Presentation .pdf
Green Homes, Islamabad Presentation .pdf
 
Simpolo Company Profile & Corporate Logo
Simpolo Company Profile & Corporate LogoSimpolo Company Profile & Corporate Logo
Simpolo Company Profile & Corporate Logo
 
Killer Referans Bahcesehir Catalog Listing Turkey
Killer Referans Bahcesehir Catalog Listing TurkeyKiller Referans Bahcesehir Catalog Listing Turkey
Killer Referans Bahcesehir Catalog Listing Turkey
 
2BHK-3BHK NEW FLAT FOR SALE IN TUPUDANA,RANCHI.
2BHK-3BHK NEW FLAT FOR SALE IN TUPUDANA,RANCHI.2BHK-3BHK NEW FLAT FOR SALE IN TUPUDANA,RANCHI.
2BHK-3BHK NEW FLAT FOR SALE IN TUPUDANA,RANCHI.
 
Biography and career about Lixin Azarmehr
Biography and career about Lixin AzarmehrBiography and career about Lixin Azarmehr
Biography and career about Lixin Azarmehr
 
How to Scan Tenants in NYC - You Should Know!
How to Scan Tenants in NYC - You Should Know!How to Scan Tenants in NYC - You Should Know!
How to Scan Tenants in NYC - You Should Know!
 
Hawthorn Module 1 Coverted to Slide Show - 04.06.2024.docx
Hawthorn Module 1 Coverted to Slide Show - 04.06.2024.docxHawthorn Module 1 Coverted to Slide Show - 04.06.2024.docx
Hawthorn Module 1 Coverted to Slide Show - 04.06.2024.docx
 
One20 North Vancouver Floor Plans by Three Shores Development.
One20 North Vancouver Floor Plans by Three Shores Development.One20 North Vancouver Floor Plans by Three Shores Development.
One20 North Vancouver Floor Plans by Three Shores Development.
 
Urbanrise Paradise on Earth - Unveiling Unprecedented Luxury in Exquisite Vil...
Urbanrise Paradise on Earth - Unveiling Unprecedented Luxury in Exquisite Vil...Urbanrise Paradise on Earth - Unveiling Unprecedented Luxury in Exquisite Vil...
Urbanrise Paradise on Earth - Unveiling Unprecedented Luxury in Exquisite Vil...
 
Architectural & Interior design portfolio.pdf
Architectural & Interior design portfolio.pdfArchitectural & Interior design portfolio.pdf
Architectural & Interior design portfolio.pdf
 
Omaxe Sports City Dwarka A Comprehensive Guide
Omaxe Sports City Dwarka A Comprehensive GuideOmaxe Sports City Dwarka A Comprehensive Guide
Omaxe Sports City Dwarka A Comprehensive Guide
 
BricknBolt Understanding Load-Bearing Walls and Their Structural Support in H...
BricknBolt Understanding Load-Bearing Walls and Their Structural Support in H...BricknBolt Understanding Load-Bearing Walls and Their Structural Support in H...
BricknBolt Understanding Load-Bearing Walls and Their Structural Support in H...
 
Optimizing Your MCA Lead Capture Process for Better Results
Optimizing Your MCA Lead Capture Process for Better ResultsOptimizing Your MCA Lead Capture Process for Better Results
Optimizing Your MCA Lead Capture Process for Better Results
 
Rixos Tersane Istanbul Residences Brochure_May2024_ENG.pdf
Rixos Tersane Istanbul Residences Brochure_May2024_ENG.pdfRixos Tersane Istanbul Residences Brochure_May2024_ENG.pdf
Rixos Tersane Istanbul Residences Brochure_May2024_ENG.pdf
 
The KA Housing - Catalogue - Listing Turkey
The KA Housing - Catalogue - Listing TurkeyThe KA Housing - Catalogue - Listing Turkey
The KA Housing - Catalogue - Listing Turkey
 
Riverview City Loni Kalbhor Pune Brochure
Riverview City Loni Kalbhor Pune BrochureRiverview City Loni Kalbhor Pune Brochure
Riverview City Loni Kalbhor Pune Brochure
 

Form 2008 & 2009 Market Stats 06 Jun

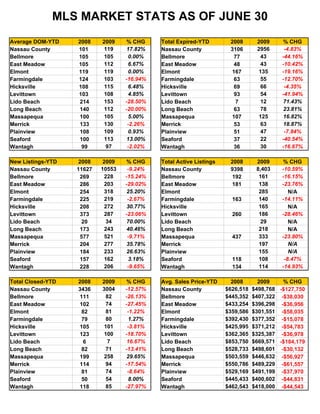
  • 1. MLS MARKET STATS AS OF JUNE 30 Average DOM-YTD 2008 2009 % CHG Total Expired-YTD 2008 2009 % CHG Nassau County 101 119 17.82% Nassau County 3106 2956 -4.83% Bellmore 105 105 0.00% Bellmore 77 43 -44.16% East Meadow 105 112 6.67% East Meadow 48 43 -10.42% Elmont 119 119 0.00% Elmont 167 135 -19.16% Farmingdale 124 103 -16.94% Farmingdale 63 55 -12.70% Hicksville 108 115 6.48% Hicksville 69 66 -4.35% Levittown 103 108 4.85% Levittown 93 54 -41.94% Lido Beach 214 153 -28.50% Lido Beach 7 12 71.43% Long Beach 140 112 -20.00% Long Beach 63 78 23.81% Massapequa 100 105 5.00% Massapequa 107 125 16.82% Merrick 133 130 -2.26% Merrick 53 63 18.87% Plainview 108 109 0.93% Plainview 51 47 -7.84% Seaford 100 113 13.00% Seaford 37 22 -40.54% Wantagh 99 97 -2.02% Wantagh 36 30 -16.67% New Listings-YTD 2008 2009 % CHG Total Active Listings 2008 2009 % CHG Nassau County 11627 10553 -9.24% Nassau County 9398 8,403 -10.59% Bellmore 269 228 -15.24% Bellmore 192 161 -16.15% East Meadow 286 203 -29.02% East Meadow 181 138 -23.76% Elmont 254 318 25.20% Elmont 285 N/A Farmingdale 225 219 -2.67% Farmingdale 163 140 -14.11% Hicksville 208 272 30.77% Hicksville 165 N/A Levittown 373 287 -23.06% Levittown 260 186 -28.46% Lido Beach 20 34 70.00% Lido Beach 29 N/A Long Beach 173 243 40.46% Long Beach 218 N/A Massapequa 577 521 -9.71% Massapequa 437 333 -23.80% Merrick 204 277 35.78% Merrick 197 N/A Plainview 184 233 26.63% Plainview 155 N/A Seaford 157 162 3.18% Seaford 118 108 -8.47% Wantagh 228 206 -9.65% Wantagh 134 114 -14.93% Total Closed-YTD 2008 2009 % CHG Avg. Sales Price-YTD 2008 2009 % CHG Nassau County 3436 3004 -12.57% Nassau County $626,518 $498,768 -$127,750 Bellmore 111 82 -26.13% Bellmore $445,352 $407,322 -$38,030 East Meadow 102 74 -27.45% East Meadow $433,254 $396,298 -$36,956 Elmont 82 81 -1.22% Elmont $359,586 $301,551 -$58,035 Farmingdale 79 80 1.27% Farmingdale $392,430 $377,352 -$15,078 Hicksville 105 101 -3.81% Hicksville $425,995 $371,212 -$54,783 Levittown 123 100 -18.70% Levittown $362,365 $325,387 -$36,978 Lido Beach 6 7 16.67% Lido Beach $853,750 $669,571 -$184,179 Long Beach 82 71 -13.41% Long Beach $528,733 $498,601 -$30,132 Massapequa 199 258 29.65% Massapequa $503,559 $446,632 -$56,927 Merrick 114 94 -17.54% Merrick $550,786 $489,229 -$61,557 Plainview 81 74 -8.64% Plainview $529,169 $491,199 -$37,970 Seaford 50 54 8.00% Seaford $445,433 $400,602 -$44,831 Wantagh 118 85 -27.97% Wantagh $462,543 $418,000 -$44,543
  • 2. MLS MARKET STATS AS OF JUNE 30 AVERAGE DAYS ON MARKET TREND 250 200 150 2009 - Year To Date 100 50 0 (50) East Meadow Farmingdale Levittown Long Beach Merrick Seaford Bellmore Elmont Hicksville Lido Beach Massapequa Plainview Wantagh CLOSED SALES MARKET TREND 350 300 250 200 2009 - Year To Date 150 100 50 0 -50 -100 -150 East Meadow Farmingdale Levittown Long Beach Merrick Seaford Bellmore Elmont Hicksville Lido Beach Massapequa Plainview Wantagh AVERAGE SALES PRICE MARKET TREND $1,300,000 $1,200,000 $1,100,000 $1,000,000 $900,000 $800,000 $700,000 2009 - Year To Date $600,000 $500,000 $400,000 $300,000 $200,000 $100,000 $0 $100,000 $200,000 $300,000 $400,000 $500,000 $600,000 East Meadow Farmingdale Levittown Long Beach Merrick Seaford Bellmore Elmont Hicksville Lido Beach Massapequa Plainview Wantagh
  • 3. $0 200 $100,000 MLS MARKET STATS AS OF JUNE 30 $200,000 $300,000 $400,000 $500,000 $600,000 East Meadow Farmingdale Levittown Long Beach Merrick Seaford Bellmore Elmont Hicksville Lido Beach Massapequa Plainview Wantagh Average DOM-YTD 2008 2009 % CHG Total Expired-YTD 2008 2009 % CHG Nassau County 101 119 17.82% Nassau County 3106 2956 -4.83% Bellmore 105 105 0.00% Bellmore 77 43 -44.16% East Meadow 105 112 6.67% East Meadow 48 43 -10.42% Elmont 119 119 0.00% Elmont 167 135 -19.16% Farmingdale 124 103 -16.94% Farmingdale 63 55 -12.70% Hicksville 108 115 6.48% Hicksville 69 66 -4.35% Levittown 103 108 4.85% Levittown 93 54 -41.94% Massapequa 100 105 5.00% Massapequa 107 125 16.82% Merrick 133 130 -2.26% Merrick 53 63 18.87% Plainview 108 109 0.93% Plainview 51 47 -7.84% Seaford 100 113 13.00% Seaford 37 22 -40.54% Wantagh 99 97 -2.02% Wantagh 36 30 -16.67% New Listings-YTD 2008 2009 % CHG Total Active Listings 2008 2009 % CHG Nassau County 11627 10553 -9.24% Nassau County 9398 8403 -10.59% Bellmore 269 228 -15.24% Bellmore 192 161 -16.15% East Meadow 286 203 -29.02% East Meadow 181 138 -23.76% Elmont 254 318 25.20% Elmont 0 285 N/A Farmingdale 225 219 -2.67% Farmingdale 163 140 -14.11% Hicksville 208 272 30.77% Hicksville 0 165 N/A Levittown 373 287 -23.06% Levittown 260 186 -28.46% Massapequa 577 521 -9.71% Massapequa 437 333 -23.80% Merrick 204 277 35.78% Merrick 0 197 N/A Plainview 184 233 26.63% Plainview 0 155 N/A Seaford 157 162 3.18% Seaford 118 108 -8.47% Wantagh 228 206 -9.65% Wantagh 134 114 -14.93% Total Closed-YTD 2008 2009 % CHG Avg. Sales Price-YTD 2008 2009 % CHG Nassau County 3436 3004 -12.57% Nassau County $626,518 $498,768 -$127,750 Bellmore 111 82 -26.13% Bellmore $445,352 $407,322 -$38,030 East Meadow 102 74 -27.45% East Meadow $433,254 $396,298 -$36,956 Elmont 82 81 -1.22% Elmont $359,586 $301,551 -$58,035 Farmingdale 79 80 1.27% Farmingdale $392,430 $377,352 -$15,078 Hicksville 105 101 -3.81% Hicksville $425,995 $371,212 -$54,783 Levittown 123 100 -18.70% Levittown $362,365 $325,387 -$36,978 Massapequa 199 258 29.65% Massapequa $503,559 $446,632 -$56,927 Merrick 114 94 -17.54% Merrick $550,786 $489,229 -$61,557 Plainview 81 74 -8.64% Plainview $529,169 $491,199 -$37,970 Seaford 50 54 8.00% Seaford $445,433 $400,602 -$44,831
  • 4. MLS MARKET STATS AS OF JUNE 30 Wantagh 118 85 -27.97% Wantagh $462,543 $418,000 -$44,543 AVERAGE DAYS ON MARKET TREND 140 120 100 2009 - Year To Date 80 60 40 20 0 Bellmore East Meadow Elmont Farmingdale Hicksville Levittown Massapequa Merrick Plainview Seaford Wantagh CLOSED SALES MARKET TREND 350 300 250 200 2009 - Year To Date 150 100 50 0 -50 -100 -150 Bellmore East Meadow Elmont Farmingdale Hicksville Levittown Massapequa Merrick Plainview Seaford Wantagh AVERAGE SALES PRICE MARKET TREND $700,000 $600,000 $500,000 $400,000 2009 - Year To Date $300,000 $200,000 $100,000 $0 -$100,000 -$200,000 Bellmore East Meadow Elmont Farmingdale Hicksville Levittown Massapequa Merrick Plainview Seaford Wantagh
  • 5. MLS MARKET STATS AS OF JUNE 30
  • 6. MLS MARKET STATS AS OF JUNE 30 AVG DOM Bellmore East Meadow Elmont Farmingdale Hicksville Levittown 2006 DOM 82 76 90 86 72 74 2007 DOM 101 102 113 111 100 85 2008 DOM 105 105 119 124 108 103 2009 DOM 105 112 119 103 115 108 DIFFERENCE 28.05% 47.37% 32.22% 19.77% 59.72% 45.95% Bellmore East Meadow Elmont Farmingdale Hicksville Levittown 2006 CLOSED 157 128 151 126 153 172 2007 CLOSED 131 115 103 86 148 173 2008 CLOSED 111 102 82 79 105 123 2009 CLOSED 82 74 81 80 101 100 DIFFERENCE -75 -54 -70 -46 -52 -72 Bellmore East Meadow Elmont Farmingdale Hicksville Levittown 2006 SP$ $526,393 $487,473 $433,508 $488,668 $457,002 $406,410 2007 SP$ $496,564 $455,804 $428,392 $452,104 $436,853 $383,483 2008 SP$ $445,352 $433,254 $359,586 $392,430 $425,995 $362,365 2009 SP$ $407,322 $396,298 $301,551 $377,352 $371,212 $325,387 DIFFERENCE -$119,071 -$91,175 -$131,957 -$111,316 -$85,790 -$81,023
  • 7. MLS MARKET STATS AS OF JUNE 30
  • 8. MLS MARKET STATS AS OF JUNE 30 AVG DOM Bellmore East Meadow Elmont Farmingdale Hicksville Levittown 2006 DOM 82 76 90 86 72 74 2007 DOM 101 102 113 111 100 85 2008 DOM 105 105 119 124 108 103 2009 DOM 105 112 119 103 115 108 DIFFERENCE 28.05% 47.37% 32.22% 19.77% 59.72% 45.95% Bellmore East Meadow Elmont Farmingdale Hicksville Levittown 2006 CLOSED 157 128 151 126 153 172 2007 CLOSED 131 115 103 86 148 173 2008 CLOSED 111 102 82 79 105 123 2009 CLOSED 82 74 81 80 101 100 DIFFERENCE -75 -54 -70 -46 -52 -72 Bellmore East Meadow Elmont Farmingdale Hicksville Levittown 2006 SP$ $526,393 $487,473 $433,508 $488,668 $457,002 $406,410 2007 SP$ $496,564 $455,804 $428,392 $452,104 $436,853 $383,483 2008 SP$ $445,352 $433,254 $359,586 $392,430 $425,995 $362,365 2009 SP$ $407,322 $396,298 $301,551 $377,352 $371,212 $325,387 DIFFERENCE -$119,071 -$91,175 -$131,957 -$111,316 -$85,790 -$81,023
  • 9. MLS MARKET STATS AS OF JUNE 30
  • 10. MLS MARKET STATS AS OF JUNE 30 Lido Beach Long Beach Massapequa Merrick Plainview Seaford Wantagh 130 124 78 62 73 78 68 146 124 99 119 100 108 90 214 140 100 133 108 100 99 153 112 105 130 109 113 97 17.69% -9.68% 34.62% 109.68% 49.32% 44.87% 42.65% Lido Beach Long Beach Massapequa Merrick Plainview Seaford Wantagh 11 106 286 204 106 83 124 8 117 241 155 114 74 113 6 82 199 114 81 50 118 7 71 258 94 74 54 85 -4 -35 -28 -110 -32 -29 -39 Lido Beach Long Beach Massapequa Merrick Plainview Seaford Wantagh $1,172,288 $565,542 $539,934 $417,234 $572,558 $497,710 $508,540 $728,750 $609,571 $521,131 $541,780 $566,485 $446,830 $490,170 $853,750 $528,733 $503,559 $550,786 $529,169 $445,433 $462,543 $669,571 $498,601 $446,632 $489,229 $491,199 $400,602 $418,000 -$502,717 -$66,941 -$93,302 $71,995 -$81,359 -$97,108 -$90,540
  • 11. MLS MARKET STATS AS OF JUNE 30
  • 12. MLS MARKET STATS AS OF JUNE 30 Massapequa Merrick Plainview Seaford Wantagh 78 62 73 78 68 99 119 100 108 90 100 133 108 100 99 105 130 109 113 97 34.62% 109.68% 49.32% 44.87% 42.65% Massapequa Merrick Plainview Seaford Wantagh 286 204 106 83 124 241 155 114 74 113 199 114 81 50 118 258 94 74 54 85 -28 -110 -32 -29 -39 Massapequa Merrick Plainview Seaford Wantagh $539,934 $417,234 $572,558 $497,710 $508,540 $521,131 $541,780 $566,485 $446,830 $490,170 $503,559 $550,786 $529,169 $445,433 $462,543 $446,632 $489,229 $491,199 $400,602 $418,000 -$93,302 $71,995 -$81,359 -$97,108 -$90,540