SlideShare a Scribd company logo
Economic Bulletin
                                                                                                          Q4 2012
At A Glance – Summary of Q4 highlights
EU food and drink industry evolution during Q4 2012 against major economic trends in the EU


                                                                              EVOLUTION
                                                                               OF MAIN
                                                                             AGRICULTURAL
                                                                             RAW MATERIAL
                                                                                PRICES


Note 1: Except for imports and exports data which represent evolution of the current quarter compared to the same
quarter of the previous year, all other changes are represented with respect to the previous quarter of the same year.
Note 2: Unless otherwise specified, EU refers to the EU 27 in the text.

Economic trends in the EU

A general overview of the EU economic environment is given by data and trends shown in the table below. This
provides the background against which the analysis for the food and drink sector is carried out in the following
sections of the economic bulletin.

Table 1: Economic trends in the EU in recent periods
                                    2011q4       2012q1         2012q2      2012q3     2012q4           2012q4
                                                          Quarterly variations                    Annual variations
                                                             (% change)*                            (% change)**
                                         Manufacturing sector (NACE Rev. 2)
Industrial production index           -1.1         -0.7           -0.8           0.4     -2.3             -3.3
                                                          All sectors
Private final consumption
                                      -0.3          0.1           -0.2           0.0     -0.2             -0.3
(volume)
                                   2012m8       2012m9         2012m10     2012m11     2012m12         2012m12
                                                          Monthly variations                      Annual variations
Retail trade volumes
                                                            (% change)*                             (% change)**
                                                                         All sectors
                                      0.3          -1.1           -0.7           0.3     -0.7             -2.0
                                                                 Food, drinks and Tobacco
                                      0.3          -0.2          -0.7          -0.3     -0.4              -1.2
* With respect to previous quarter/month
** With respect to the same period (either quarter or month) in the previous year
Source: Eurostat, March 2013


                                                                                                                 1/10
The EU manufacturing industrial production index decreased (2.3%) in Q4 of 2012. In the same period, private
consumption (volumes) registered a slight decrease compared to the previous quarter, i.e. -0.2%. The yearly
comparison shows that the industrial production index decreased markedly in Q4 of 2012 compared to the same
quarter of the previous year, i.e. by -3.3%. Private consumption also decreased compared to the change registered
in the same quarter of 2011, but to a far lesser extent, i.e. -0.3%.

The (all sectors) volume of retail trade decreased by 0.7% in December (compared to November 2012), while
retail trade in food, drinks and tobacco decreased by 0.4%. Among the Member States for which data are
available, total retail trade fell in twelve, rose in eight and remained stable in Finland. The largest decreases were
registered in Romania (-3.2%), Spain (-2.2%) and Slovenia (-2.1%), and the highest increases in Luxembourg
                                                     1
and Poland (both +2.2%) and Estonia (+1.9%).


FOOD AND DRINK INDUSTRY INDICATORS IN Q4 OF 2012

1. Food and drink industry output index decreased

Food and drink industry output (production) in the EU fell by 0.36% in Q4 of 2012 compared to the previous
quarter. This is in line with the negative trend experienced by the manufacturing production index in the same
period (see the above section: Economic trends in the EU).

Q4 of 2012 represented a quarter of mixed performances in terms of production at the Member State level. Austria
(+1.36%), Czech Republic (+0.49%) and Sweden (+0.20%) reached positive production index growth rates,
whereas Bulgaria (-2.84%), Spain (-1.35%) and Finland (-0.75%) remained on their negative trend of the previous
quarter. The best performers whose production index growth rates even exceeded the positive growth rates of the
previous quarter include Ireland (+7.31%), Estonia (+1.41%) and Germany (+0.72%).

Table 2: Industry production index, quarterly growth
                            2012 Q3/2012 Q2        2012 Q4/2012 Q3
Member State                  (% change)             (% change)
EU27                                       0.52                -0.36
Austria                                    -0.16               1.36
Belgium                                    1.36                0.42
Bulgaria                                   -1.62               -2.84
Czech Republic                             -0.37               0.49
Denmark                                    2.60                -1.07
Estonia                                    0.96                1.41
Finland                                    -1.47               -0.75
Germany                                    0.05                0.72
Greece                                     0.21                -3.20
Hungary                                    0.58                -3.27
Ireland                                    1.23                7.31
Italy                                      1.27                -2.31
Latvia                                     1.65                -1.63
Lithuania                                  4.11                0.30
Netherlands                                0.32                -0.03
Poland                                     1.44                0.90
Portugal                                   1.88                0.18
Spain                                      -0.74               -1.35
Sweden                                     -2.47               0.20
United Kingdom                             0.34                -2.95
Source: Eurostat, Short-Term Business Statistics, NACE Rev. 2, March 2013


1
    Eurostat news release, Euro indicators, 21/2013.


                                                                                                                 2/10
2. Evolution of main agricultural raw material prices

The following shows a mixed picture for raw material prices:

                                                                                                                                                                          Oils and oil crops
                                                           Grains                                      Dairy                                         Soybean                                               Rape
Cocoa       Coffee             Sugar              Corn/                 Soft                  WMP               SMP                     Oil              Bean                   Meal              Seed                  Oil           Palm
                                                  Maize                wheat                                                                                                                                                           oil


Source: FoodDrinkEurope compilation

Cocoa and coffee

Quarterly developments: After having experienced positive growth of 9.3% in Q3 of 2012, cocoa prices
decreased on average by 1.7% in Q4 of 2012. A similar negative trend was also experienced by coffee composite
prices which fell by 9.6% in Q4 of 2012 against the 1% drop of the previous quarter.

Year-on-year developments: The year-on-year comparison shows that, the New York cocoa market recorded a
0.71% decrease with respect to Q4 of 2011. However, coffee composite prices were significantly lower than their
level in the same quarter of 2011, i.e. by 28.1%.


                                                 Cocoa NY market price and coffee world price
                                                     (monthly averages, current price, $/t)
   6000

   5000

   4000

   3000

   2000

   1000

        0
                      Apr-07
                               Jul-07


                                                          Apr-08
                                                                   Jul-08


                                                                                              Apr-09
                                                                                                       Jul-09


                                                                                                                                   Apr-10
                                                                                                                                            Jul-10


                                                                                                                                                                       Apr-11
                                                                                                                                                                                Jul-11
                                                                                                                                                                                         Oct-11


                                                                                                                                                                                                           Apr-12
                                                                                                                                                                                                                    Jul-12
                                        Oct-07


                                                                            Oct-08


                                                                                                                Oct-09


                                                                                                                                                     Oct-10


                                                                                                                                                                                                                             Oct-12
             Jan-07


                                                 Jan-08


                                                                                     Jan-09


                                                                                                                          Jan-10


                                                                                                                                                              Jan-11


                                                                                                                                                                                                  Jan-12


                                                          Cocoa price in $/t                                             Coffee composite price in $/t
Source: International Cocoa Organisation (ICCO) and International Coffee Organisation (ICO), March 2013

Sugar

Quarterly developments: EU white sugar prices slightly increased (+2.0%) in Q4 of 2012. In the same quarter,
U.S. market price continued to decrease, i.e. by 19.4% compared to Q3 of 2012.

Year-on-year developments: On average, EU market price for white sugar was 12.4% higher in Q4 of 2012 than
the same quarter of the previous year whereas the U.S. market price was 37.4% lower than the average in Q4 of
2011. In comparison, the world sugar price was 12.6% lower than the average of the same quarter of 2011.


                                                                                                                                                                                                                                       3/10
White Sugar prices
                                                     (monthly averages, current prices, €/t)
   1200

   1000

    800

    600

    400

    200

         0
                             Jul


                                                         Jul


                                                                                     Jul


                                                                                                 Jan '10


                                                                                                                 Jul


                                                                                                                                                                          Jul
                       Apr


                                                   Apr


                                                                               Apr


                                                                                                           Apr


                                                                                                                                       Apr


                                                                                                                                                                    Apr
                                         Jan '08


                                                                     Jan '09


                                                                                                                             Jan '11


                                                                                                                                                          Jan '12
                                   Oct


                                                               Oct


                                                                                           Oct


                                                                                                                       Oct


                                                                                                                                                    Oct


                                                                                                                                                                                Oct
                                                                                                                                             July
             Jan '07


                                                         World price                                                         US market price
Source: European Commission – Circa (Regulations (EC) No 562/2005 Article 6(1) and 479/2010 Article 2), United States
Department of Agriculture, March 2013

Grains

Corn maize prices

Quarterly developments: Contrary to the positive trend of the previous two quarters, EU maize prices slightly
decreased in Q4 of 2012 (compared to Q3 of 2012), i.e. by 0.9%. U.S. maize prices also decreased in the same
period, i.e. by 7.1%, falling from the record price level of the previous quarter which experts claimed to be a result
of drought and rising industrial demand.

Year-on-year developments: On average, EU maize prices were 31.4% higher in Q4 of 2012 than the same
quarter of the previous year. Similarly but to a lesser extent, U.S. maize prices were 24.0% higher in Q4 of 2012
than in the same quarter of the previous year.

                                                       Corn/maize market prices
                                                   (monthly averages, current prices, €/t)
     300.00

     250.00

     200.00

     150.00

     100.00

      50.00
                       Oct-08
                       Apr-07
                        Jul-07
                       Oct-07

                       Apr-08
                        Jul-08


                       Apr-09
                        Jul-09
                       Oct-09

                       Apr-10
                        Jul-10
                       Oct-10

                       Apr-11
                        Jul-11
                       Oct-11

                       Apr-12
                        Jul-12
                       Oct-12
                       Jan-07


                       Jan-08


                       Jan-09


                       Jan-10


                       Jan-11


                       Jan-12


                                         DG Agri EU market price €/t                                                   FAO US market price €/t

Source: FAO and European Commission (DG Agri), March 2013


                                                                                                                                                                                      4/10
Soft wheat prices

Quarterly developments: Similarly to the previous quarter trend but with a slower pace, EU maize prices
continued to increase in Q4 of 2012 (compared to Q3 of the same year) i.e. by 6.6%. U.S. maize prices decreased
during the same period i.e. by 2.3%.

Year-on-year developments: On average, EU maize prices were 33.9% higher in Q4 of 2012 than the same
quarter of the previous year. Similarly, U.S. soft wheat prices were 40.3% higher in Q3 of 2012 than in the same
quarter of the previous year.

                                                                      Soft wheat market prices
                                                                 (monthly averages, current prices, €/t)
 300.00


 250.00


 200.00


 150.00


 100.00


  50.00
                                                                                                                                                  Oct-10
                   Apr-07
                            Jul-07
                                     Oct-07


                                                        Apr-08
                                                                 Jul-08
                                                                          Oct-08


                                                                                            Apr-09
                                                                                                     Jul-09
                                                                                                              Oct-09


                                                                                                                                Apr-10
                                                                                                                                         Jul-10


                                                                                                                                                                    Apr-11
                                                                                                                                                                             Jul-11
                                                                                                                                                                                      Oct-11


                                                                                                                                                                                                        Apr-12
                                                                                                                                                                                                                 Jul-12
                                                                                                                                                                                                                          Oct-12
          Jan-07


                                               Jan-08


                                                                                   Jan-09


                                                                                                                       Jan-10


                                                                                                                                                           Jan-11


                                                                                                                                                                                               Jan-12


                                              DG Agri EU market price €/t                                                                   FAO US market price €/t
Source: FAO and European Commission (DG Agri), March 2013

Dairy

Skimmed Milk Powder (SMP)

Quarterly developments: Similarly to the previous quarter trend but with a slower pace, EU SMP prices continued
to increase in Q4 of 2012 (compared to Q3 of the same year) i.e. by 11.8%. Moreover, for the first time since Q3 of
2009, average EU prices in Q4 of 2012 were higher than world market prices.

Year-on-year developments: The yearly comparison shows that, on average, EU SMP prices were 15.1% higher
in Q4 of 2012 than the same period in 2011.


                                                                                                                                                                                                                                   5/10
SMP
                                                  (monthly averages, current prices, €/t)
 4500
 4000
                                                                                                                                                                  Q4 2012
 3500
                                                                  Q3 2009
 3000
 2500
 2000
 1500
 1000
  500
     0
                         Jul


                                                      Jul


                                                                                  Jul


                                                                                                              Jul


                                                                                                                                           Jul


                                                                                                                                                                       Jul
                   Apr


                                                Apr


                                                                            Apr


                                                                                                        Apr


                                                                                                                                     Apr


                                                                                                                                                                 Apr
                                Oct


                                                            Oct


                                                                                        Oct


                                                                                                                     Oct


                                                                                                                                                 Oct


                                                                                                                                                                             Oct
         Jan '07


                                      Jan '08


                                                                  Jan '09


                                                                                              Jan '10


                                                                                                                           Jan '11


                                                                                                                                                       Jan '12
                    FAO €/t World market price                                                                      CLAL €/t EU market price
                    CIRCA €/t EU market price                                                                       R. 1234/07 €/t EU reference price

Source: FAO, CLAL consultancy (discontinued after January 2011 to the benefit of the European Commission source),
European Commission – Circa (Regulations (EC) No 562/2005 Article 6(1) and 479/2010 Article 2), March 2013

Whole Milk Powder (WMP)

Quarterly developments: Generally higher than world market prices since Q3 of 2010, EU WMP average prices
continued to increase in Q4 of 2012, i.e. by 9.6% from the previous quarter.

Year-on-year developments: The yearly comparison shows that, on average, EU WMP prices remained fairly
stable (- 0.1%) in Q4 of 2012 compared to the same quarter of 2011.


                                                                           WMP
                                                            (monthly averages, current prices, €/t)
  4000


  3500


  3000


  2500


  2000


  1500


  1000
             Jan '08


                 Jul


                 Jul


                 Jul


                 Jul


                 Jul
                Sep


                Sep


                Sep


                Sep


                Sep
                Mar


             Jan '09
               May


                Mar


             Jan '10
               May


                Mar


             Jan '11
               May


                Mar


             Jan '12
               May


                Mar
               May
                Nov


                Nov


                Nov


                Nov


                Nov


                               World market price                             CLAL €/t EU market price                                      CIRCA €/t EU market price

Source: FAO, CLAL consultancy (discontinued after January 2011 to the benefit of the European Commission source),
European Commission – Circa (Regulations (EC) No 562/2005 Article 6(1) and 479/2010 Article 2), March 2013


                                                                                                                                                                                   6/10
Oils and oil crops

Quarterly developments: In Q4 of 2012 oils and oils crops prices experienced a general decrease. The decrease
in prices was most pronounced for Palm oil and Soybeans with a price decline of 18.5% and 10.1%, respectively.
Moreover, after having significantly increased during the previous quarter, prices of Soybean meal (+29.3%) started
to decrease in Q4 of 2012, i.e. by 6.9%.

Year-on-year developments: The yearly comparison shows that in Q4 of 2012 only Soybean meal, Soybeans and
Rapeseed prices were significantly higher than in the same quarter of 2011: by 64.6%, 23.7% and 4.7%
respectively. On the contrary Palm oil, Rape oil and Soybean oil were 21.0%, 5.8% and 4.6% lower in Q4 of 2012
than the same period of the previous year.


                                                                                       Oils and oilcrop prices
                                                                                 (monthly averages, current prices $/t)
1800
1600
1400
1200
1000
 800
 600
 400
 200
    0
                                                                                                         Apr-09
                   Apr-07
                              Jul-07
                                        Oct-07


                                                             Apr-08
                                                                        Jul-08
                                                                                  Oct-08


                                                                                                                     Jul-09
                                                                                                                                  Oct-09


                                                                                                                                                             Apr-10
                                                                                                                                                                       Jul-10
                                                                                                                                                                                  Oct-10


                                                                                                                                                                                                               Apr-11
                                                                                                                                                                                                                             Jul-11
                                                                                                                                                                                                                                          Oct-11


                                                                                                                                                                                                                                                                   Apr-12
                                                                                                                                                                                                                                                                               Jul-12
                                                                                                                                                                                                                                                                                          Oct-12
        Jan-07


                                                  Jan-08


                                                                                             Jan-09


                                                                                                                                               Jan-10


                                                                                                                                                                                                 Jan-11


                                                                                                                                                                                                                                                       Jan-12

                                  World Bank Soybean oil $/t                                                                                                                     World Bank Soybeans $/t
                                  World Bank Soybean meal $/t                                                                                                                    World Bank Palm oil $/t

Source: World Bank and FAO, March 2013

3. Price developments in the food supply chain

Consumer prices (1.34%), producer prices (1.31%) and inflation (0.83%) all grew on average in Q4 of 2012.


                                        EU27: Price developments in the food supply chain
145.0
140.0
135.0
130.0
125.0
120.0
115.0
110.0
105.0
100.0
                    2007M04


                                                                                                                                                                                                     2011M04
         2007M01


                              2007M07
                                        2007M10
                                                  2008M01
                                                             2008M04
                                                                       2008M07
                                                                                 2008M10
                                                                                           2009M01
                                                                                                      2009M04
                                                                                                                  2009M07
                                                                                                                              2009M10
                                                                                                                                           2010M01
                                                                                                                                                        2010M04
                                                                                                                                                                  2010M07
                                                                                                                                                                            2010M10
                                                                                                                                                                                       2011M01


                                                                                                                                                                                                                   2011M07
                                                                                                                                                                                                                                2011M10
                                                                                                                                                                                                                                             2012M01
                                                                                                                                                                                                                                                         2012M04
                                                                                                                                                                                                                                                                     2012M07
                                                                                                                                                                                                                                                                                2012M10


                                                            Agricultural Commodity Price                                                                                                            Producer Price

Source: Eurostat (Food supply chain monitor), March 2013


                                                                                                                                                                                                                                                                                                   7/10
4. Slight increase in employment index in the EU food and drink industry

After having experienced a slight decrease in Q2 and Q3, the labour input index for the food and drink industry
increased (+0.28%) in Q4 of 2012. This is contrary to the performance shown by the (total) manufacturing sector
whose employment index decreased by 0.31% in the same period.

When looking at the industry breakdown, the food sector employment index increased by 0.1%, whereas the
beverages industry employment index increased by 1.02% in comparison with the previous quarter.


                  Labour input index (2010=100) : food and drink industry trends
                                 compared to total manufacturing
 110

 105

 100

   95

   90

   85

   80
        2010Q1


                           2010Q2


                                              2010Q3


                                                                 2010Q4


                                                                                      2011Q1


                                                                                                           2011Q2


                                                                                                                                  2011Q3


                                                                                                                                                         2011Q4


                                                                                                                                                                               2012Q1


                                                                                                                                                                                                   2012Q2


                                                                                                                                                                                                                      2012Q3


                                                                                                                                                                                                                                         2012Q4
                 Manufacturing                                            Manufacture of food products                                                                             Manufacture of beverages

Source: Eurostat (SBS), Nace Rev. 2, seasonally adjusted data, March 2013.

5. Food and drink industry turnover continued to increase

The food and drink industry’s turnover index increased by 0.88% in Q4 of 2012 compared to the previous quarter.


                                                                EU27: Turnover index (2010 = 100)
 115.00

 110.00

 105.00

 100.00

   95.00

   90.00
                                                                                                                                                                                                                      2012Q1
                  2007Q1
                            2007Q2
                                     2007Q3
                                              2007Q4
                                                       2008Q1
                                                                2008Q2
                                                                           2008Q3
                                                                                    2008Q4
                                                                                               2009Q1
                                                                                                        2009Q2
                                                                                                                    2009Q3
                                                                                                                             2009Q4
                                                                                                                                       2010Q1
                                                                                                                                                2010Q2
                                                                                                                                                             2010Q3
                                                                                                                                                                      2010Q4
                                                                                                                                                                                 2011Q1
                                                                                                                                                                                          2011Q2
                                                                                                                                                                                                    2011Q3
                                                                                                                                                                                                             2011Q4


                                                                                                                                                                                                                               2012Q2
                                                                                                                                                                                                                                        2012Q3
                                                                                                                                                                                                                                                  2012Q4


                                                                Manufacture of food products and beverages

Source: Eurostat (SBS), seasonally adjusted data, March 2013


                                                                                                                                                                                                                                                           8/10
6. Imported food prices increased in Q4 of 2012

Imported food prices registered a slight increase in Q4 of 2012, up to 0.49% from the previous quarter.


                                               Food and drink import price index (2010 = 100)

115.00
110.00
105.00
100.00
 95.00
 90.00
 85.00
 80.00
                                                                                                                                 2010Q2
           2007Q1
                    2007Q2
                             2007Q3
                                      2007Q4
                                               2008Q1
                                                         2008Q2
                                                                  2008Q3
                                                                           2008Q4
                                                                                    2009Q1
                                                                                             2009Q2
                                                                                                      2009Q3
                                                                                                               2009Q4
                                                                                                                        2010Q1


                                                                                                                                           2010Q3
                                                                                                                                                    2010Q4
                                                                                                                                                             2011Q1
                                                                                                                                                                      2011Q2
                                                                                                                                                                               2011Q3
                                                                                                                                                                                        2011Q4
                                                                                                                                                                                                 2012Q1
                                                                                                                                                                                                          2012Q2
                                                                                                                                                                                                                   2012Q3
                                                                                                                                                                                                                            2012Q4
                                                                                                               Euro area

Source: Eurostat (SBS), March 2013

Exchange rates

In Q4 of 2012, the euro has appreciated against most major non-EU currencies in an environment of low volatility.

The table below gives details for the euro appreciation against the currencies of major trading partners.

Table 3: Evolution of quarterly average exchange rates
                                                                                                                    Q4 2012/ Q3 2012
         1 EUR=                                         2012 Q3                     2012 Q4
                                                                                                                           %
Australian Dollar                                         1.20                          1.25                                         3.73
Canadian Dollar                                           1.24                          1.29                                         3.24
Brazilian Real                                            2.54                          2.67                                         5.17
Swiss Franc                                               1.20                          1.21                                         0.37
Chinese Yuan Renminbi                                     7.94                          8.10                                         2.05
Japanese Yen                                             98.30                       105.12                                          6.94
New Zealand Dollar                                        1.55                          1.58                                         1.87
United States Dollar                                      1.25                          1.30                                         3.72
Pound Sterling                                            0.79                          0.81                                              2.0
Source: ECB, bilateral exchange rates, March 2013


                                                                                                                                                                                                                                     9/10
7. Trade: Both imports and exports increased in Q4 of 2012 year-on-year

The EU trade balance in food and drink products continued to improve during the Q4 of 2012 compared to the
same period of 2011. The export surplus amounted to nearly €6.5 billion, which marks an increase of €1.5 billion
year-on-year.


Imports Q4 of 2012                                            Exports Q4 of 2012
Total food and drink imports amounted to 17.1                 Total food and drink exports amounted to €23.6
billion, i.e. 3.5% more compared to the previous              billion, i.e. 9.6% more compared to the same period
year. However, a real import increase in terms of             of 2011. Similar to Q3 of 2012, the value of exported
quantity and value was observed for only a limited            drinks increased proportionately more than export of
group of alcoholic and soft drinks, and grain mill and        other foodstuffs. Nonetheless, the year-on-year export
starch products. For a number of foodstuffs, the import       growth registered for fish products, oils and fats and
growth in terms of value was linked to the price factor,      spirits was also very positive (+30.2%, 21%, 20%
while the imported quantity was in fact lower than a          respectively) and matched with a similar trend in terms
year ago. Finally, some products registered a real            of exported quantities. Finally, other food and drink
import reduction both in terms of volume and value,           products contributed also to the growth in export value,
e.g. dairy (-11.8% in value and -13.4% in volume), fruit      despite witnessing a double-digit volume reduction. A
and vegetables (-7% in value and -14.4% in volume),           single-digit volume reduction was registered for wines,
and less significantly, spirits and cider.                    beer and meat products.


                    Trade balance in € million
                                                      Q4
                                             2011            2012
Total of Food and Drink                         4,996           6,482
Meat products                                   1,059           1,306
Fish and sea food products                     -3,339          -2,959
Processed fruit and vegetables                   -853            -591
Oils and fats                                  -2,694          -3,171
Dairy products                                  2,081           2,124
Grain mill and starch products                    347             311
Bakery & farinaceous products                     699             814
Other food products                             2,130           2,310
Prepared animal feed                              508             586
Drinks                                          4,983           5,714


FoodDrinkEurope - represents the European food and drink industry - the leading industrial sector and major EU employer and
exporter. FoodDrinkEurope’s role is to represent the food and drink industry’s interests, at the level of both European and
international institutions. FoodDrinkEurope’s membership consists of 24 national federations and 3 observers, 25 European
sector associations and 18 major food and drink companies.

For further information, please contact:
Lisa McCooey, Communications Director / Deputy Director General. Tel: + 32 2 508 10 24 -
l.mccooey@fooddrinkeurope.eu


                                                                                                                    10/10

More Related Content

Similar to FoodDrinkEurope: Economic Bulletin Q4 2012

OECD Interim Economic outlook - March 28 2013
OECD Interim Economic outlook - March 28 2013OECD Interim Economic outlook - March 28 2013
OECD Interim Economic outlook - March 28 2013
OECD - Organisation for Economic Co-operation and Development
 
Is a credit crunch threatening the financing of the economy (BFF 12 june 2012)
Is a credit crunch threatening the financing of the economy (BFF 12 june 2012)Is a credit crunch threatening the financing of the economy (BFF 12 june 2012)
Is a credit crunch threatening the financing of the economy (BFF 12 june 2012)Cfinancing
 
summary_dec_2021.doc
summary_dec_2021.docsummary_dec_2021.doc
summary_dec_2021.doc
nagasrinivasa rao n
 
Economic indicators - Economic Monthly Overvies November 2012
Economic indicators - Economic Monthly Overvies November 2012Economic indicators - Economic Monthly Overvies November 2012
Economic indicators - Economic Monthly Overvies November 2012
SappiHouston
 
Tender Price Inflation Forecasts 2 Q 2011 (2)
Tender Price Inflation Forecasts 2 Q 2011 (2)Tender Price Inflation Forecasts 2 Q 2011 (2)
Tender Price Inflation Forecasts 2 Q 2011 (2)
derekfarrow
 
Volume of retail trade down by 0.2% in both euro area and EU28
Volume of retail trade down by 0.2% in both euro area and EU28Volume of retail trade down by 0.2% in both euro area and EU28
Volume of retail trade down by 0.2% in both euro area and EU28
Giuseppe Fumagalli
 
Palestra: Global Economic Perspectives From Crisis to Recovery - José Antônio...
Palestra: Global Economic Perspectives From Crisis to Recovery - José Antônio...Palestra: Global Economic Perspectives From Crisis to Recovery - José Antônio...
Palestra: Global Economic Perspectives From Crisis to Recovery - José Antônio...
ExpoGestão
 
Pine Economic Calendar: High speed monetary policy
Pine Economic Calendar: High speed monetary policyPine Economic Calendar: High speed monetary policy
Pine Economic Calendar: High speed monetary policyBanco Pine
 
Economy at a glance... November 2022.pdf
Economy at a glance... November 2022.pdfEconomy at a glance... November 2022.pdf
Economy at a glance... November 2022.pdf
Círculo de Empresarios
 
Kemira financial statements bulletin 2012
Kemira financial statements bulletin 2012Kemira financial statements bulletin 2012
Kemira financial statements bulletin 2012
Kemira Oyj
 
The economic outlook for the sector - Andrew Sentance
The economic outlook for the sector - Andrew SentanceThe economic outlook for the sector - Andrew Sentance
The economic outlook for the sector - Andrew Sentance
CFG
 
The contribution of regions to the productivity of nations - Oliveira Martins...
The contribution of regions to the productivity of nations - Oliveira Martins...The contribution of regions to the productivity of nations - Oliveira Martins...
The contribution of regions to the productivity of nations - Oliveira Martins...
OECD CFE
 
Economic indicators December 2012 - part 1
Economic indicators December 2012 - part 1Economic indicators December 2012 - part 1
Economic indicators December 2012 - part 1
SappiHouston
 
Deutsche EuroShop | Company Presentation | 06/21
Deutsche EuroShop | Company Presentation | 06/21Deutsche EuroShop | Company Presentation | 06/21
Deutsche EuroShop | Company Presentation | 06/21
Deutsche EuroShop AG
 
Показники інфляції в Євросоюзі та зоні євро в січні 2017 року
Показники інфляції в Євросоюзі та зоні євро в січні 2017 рокуПоказники інфляції в Євросоюзі та зоні євро в січні 2017 року
Показники інфляції в Євросоюзі та зоні євро в січні 2017 року
tsnua
 
BCE Boletin agosto 2012
BCE Boletin agosto 2012BCE Boletin agosto 2012
BCE Boletin agosto 2012ManfredNolte
 
Q1 2013 Results
Q1 2013 ResultsQ1 2013 Results
Q1 2013 Results
acciona
 
Eurostatinflation2 17042019-ap-en
Eurostatinflation2 17042019-ap-enEurostatinflation2 17042019-ap-en
Eurostatinflation2 17042019-ap-en
Paperjam_redaction
 

Similar to FoodDrinkEurope: Economic Bulletin Q4 2012 (20)

OECD Interim Economic outlook - March 28 2013
OECD Interim Economic outlook - March 28 2013OECD Interim Economic outlook - March 28 2013
OECD Interim Economic outlook - March 28 2013
 
Is a credit crunch threatening the financing of the economy (BFF 12 june 2012)
Is a credit crunch threatening the financing of the economy (BFF 12 june 2012)Is a credit crunch threatening the financing of the economy (BFF 12 june 2012)
Is a credit crunch threatening the financing of the economy (BFF 12 june 2012)
 
summary_dec_2021.doc
summary_dec_2021.docsummary_dec_2021.doc
summary_dec_2021.doc
 
Economic indicators - Economic Monthly Overvies November 2012
Economic indicators - Economic Monthly Overvies November 2012Economic indicators - Economic Monthly Overvies November 2012
Economic indicators - Economic Monthly Overvies November 2012
 
Tender Price Inflation Forecasts 2 Q 2011 (2)
Tender Price Inflation Forecasts 2 Q 2011 (2)Tender Price Inflation Forecasts 2 Q 2011 (2)
Tender Price Inflation Forecasts 2 Q 2011 (2)
 
Volume of retail trade down by 0.2% in both euro area and EU28
Volume of retail trade down by 0.2% in both euro area and EU28Volume of retail trade down by 0.2% in both euro area and EU28
Volume of retail trade down by 0.2% in both euro area and EU28
 
OCDE, Previsiones
OCDE, PrevisionesOCDE, Previsiones
OCDE, Previsiones
 
Palestra: Global Economic Perspectives From Crisis to Recovery - José Antônio...
Palestra: Global Economic Perspectives From Crisis to Recovery - José Antônio...Palestra: Global Economic Perspectives From Crisis to Recovery - José Antônio...
Palestra: Global Economic Perspectives From Crisis to Recovery - José Antônio...
 
Pine Economic Calendar: High speed monetary policy
Pine Economic Calendar: High speed monetary policyPine Economic Calendar: High speed monetary policy
Pine Economic Calendar: High speed monetary policy
 
Economy at a glance... November 2022.pdf
Economy at a glance... November 2022.pdfEconomy at a glance... November 2022.pdf
Economy at a glance... November 2022.pdf
 
Kemira financial statements bulletin 2012
Kemira financial statements bulletin 2012Kemira financial statements bulletin 2012
Kemira financial statements bulletin 2012
 
The economic outlook for the sector - Andrew Sentance
The economic outlook for the sector - Andrew SentanceThe economic outlook for the sector - Andrew Sentance
The economic outlook for the sector - Andrew Sentance
 
The contribution of regions to the productivity of nations - Oliveira Martins...
The contribution of regions to the productivity of nations - Oliveira Martins...The contribution of regions to the productivity of nations - Oliveira Martins...
The contribution of regions to the productivity of nations - Oliveira Martins...
 
Economic indicators December 2012 - part 1
Economic indicators December 2012 - part 1Economic indicators December 2012 - part 1
Economic indicators December 2012 - part 1
 
Deutsche EuroShop | Company Presentation | 06/21
Deutsche EuroShop | Company Presentation | 06/21Deutsche EuroShop | Company Presentation | 06/21
Deutsche EuroShop | Company Presentation | 06/21
 
Показники інфляції в Євросоюзі та зоні євро в січні 2017 року
Показники інфляції в Євросоюзі та зоні євро в січні 2017 рокуПоказники інфляції в Євросоюзі та зоні євро в січні 2017 року
Показники інфляції в Євросоюзі та зоні євро в січні 2017 року
 
Business... at a glance mach 2020
Business... at a glance mach 2020Business... at a glance mach 2020
Business... at a glance mach 2020
 
BCE Boletin agosto 2012
BCE Boletin agosto 2012BCE Boletin agosto 2012
BCE Boletin agosto 2012
 
Q1 2013 Results
Q1 2013 ResultsQ1 2013 Results
Q1 2013 Results
 
Eurostatinflation2 17042019-ap-en
Eurostatinflation2 17042019-ap-enEurostatinflation2 17042019-ap-en
Eurostatinflation2 17042019-ap-en
 

More from FIAB

Ecotrophelia España 2018
Ecotrophelia España 2018Ecotrophelia España 2018
Ecotrophelia España 2018
FIAB
 
Programa Seminario regulación y autorregulación FIAB-AUTOCONTROL
Programa Seminario regulación y autorregulación FIAB-AUTOCONTROLPrograma Seminario regulación y autorregulación FIAB-AUTOCONTROL
Programa Seminario regulación y autorregulación FIAB-AUTOCONTROL
FIAB
 
Eficiencia energética para las pymes agroalimentarias - Sevilla
Eficiencia energética para las pymes agroalimentarias - SevillaEficiencia energética para las pymes agroalimentarias - Sevilla
Eficiencia energética para las pymes agroalimentarias - Sevilla
FIAB
 
EU-Merci - Cuestionario Asociaciones
EU-Merci - Cuestionario AsociacionesEU-Merci - Cuestionario Asociaciones
EU-Merci - Cuestionario Asociaciones
FIAB
 
EU-MERCI - Cuestionario Empresas
EU-MERCI - Cuestionario EmpresasEU-MERCI - Cuestionario Empresas
EU-MERCI - Cuestionario Empresas
FIAB
 
EU-MERCI Cuestionario ESCOS
EU-MERCI Cuestionario ESCOSEU-MERCI Cuestionario ESCOS
EU-MERCI Cuestionario ESCOS
FIAB
 
IV Madrid Food&Drink Summit 2016
IV Madrid Food&Drink Summit 2016IV Madrid Food&Drink Summit 2016
IV Madrid Food&Drink Summit 2016
FIAB
 
Jornada EPA - Mª Isabel Prieto
Jornada EPA - Mª Isabel PrietoJornada EPA - Mª Isabel Prieto
Jornada EPA - Mª Isabel Prieto
FIAB
 
Jornada EPA - Virginia Navarro
Jornada EPA - Virginia NavarroJornada EPA - Virginia Navarro
Jornada EPA - Virginia Navarro
FIAB
 
Jornada EPA - Maria Dolores Vázquez
Jornada EPA - Maria Dolores VázquezJornada EPA - Maria Dolores Vázquez
Jornada EPA - Maria Dolores Vázquez
FIAB
 
Jornada EPA - Miquel Bonet
Jornada EPA - Miquel BonetJornada EPA - Miquel Bonet
Jornada EPA - Miquel Bonet
FIAB
 
Curso Eficiencia Energética en Sistemas de Vapor Industriales
Curso Eficiencia Energética en Sistemas de Vapor IndustrialesCurso Eficiencia Energética en Sistemas de Vapor Industriales
Curso Eficiencia Energética en Sistemas de Vapor Industriales
FIAB
 
Curso Eficiencia Energética en Sistemas de Vapor Industriales
Curso Eficiencia Energética en Sistemas de Vapor IndustrialesCurso Eficiencia Energética en Sistemas de Vapor Industriales
Curso Eficiencia Energética en Sistemas de Vapor Industriales
FIAB
 
II ALIBETOPIAS 2016
II ALIBETOPIAS 2016II ALIBETOPIAS 2016
II ALIBETOPIAS 2016
FIAB
 
Eficiencia en la gestión de recursos
Eficiencia en la gestión de recursos Eficiencia en la gestión de recursos
Eficiencia en la gestión de recursos
FIAB
 
¿Ser o parecer? Camino hacia empresas sostenibles en el sector de la alimenta...
¿Ser o parecer? Camino hacia empresas sostenibles en el sector de la alimenta...¿Ser o parecer? Camino hacia empresas sostenibles en el sector de la alimenta...
¿Ser o parecer? Camino hacia empresas sostenibles en el sector de la alimenta...
FIAB
 
El clima del futuro. Escenarios y adaptación
El clima del futuro. Escenarios y adaptaciónEl clima del futuro. Escenarios y adaptación
El clima del futuro. Escenarios y adaptación
FIAB
 
Agenda internacional en cambio climático e implicaciones para el sector
Agenda internacional en cambio climático e implicaciones para el sector Agenda internacional en cambio climático e implicaciones para el sector
Agenda internacional en cambio climático e implicaciones para el sector
FIAB
 
Inscripción Envifood 2016
Inscripción Envifood 2016Inscripción Envifood 2016
Inscripción Envifood 2016
FIAB
 
Envifood Meeting Point 2016
Envifood Meeting Point 2016Envifood Meeting Point 2016
Envifood Meeting Point 2016
FIAB
 

More from FIAB (20)

Ecotrophelia España 2018
Ecotrophelia España 2018Ecotrophelia España 2018
Ecotrophelia España 2018
 
Programa Seminario regulación y autorregulación FIAB-AUTOCONTROL
Programa Seminario regulación y autorregulación FIAB-AUTOCONTROLPrograma Seminario regulación y autorregulación FIAB-AUTOCONTROL
Programa Seminario regulación y autorregulación FIAB-AUTOCONTROL
 
Eficiencia energética para las pymes agroalimentarias - Sevilla
Eficiencia energética para las pymes agroalimentarias - SevillaEficiencia energética para las pymes agroalimentarias - Sevilla
Eficiencia energética para las pymes agroalimentarias - Sevilla
 
EU-Merci - Cuestionario Asociaciones
EU-Merci - Cuestionario AsociacionesEU-Merci - Cuestionario Asociaciones
EU-Merci - Cuestionario Asociaciones
 
EU-MERCI - Cuestionario Empresas
EU-MERCI - Cuestionario EmpresasEU-MERCI - Cuestionario Empresas
EU-MERCI - Cuestionario Empresas
 
EU-MERCI Cuestionario ESCOS
EU-MERCI Cuestionario ESCOSEU-MERCI Cuestionario ESCOS
EU-MERCI Cuestionario ESCOS
 
IV Madrid Food&Drink Summit 2016
IV Madrid Food&Drink Summit 2016IV Madrid Food&Drink Summit 2016
IV Madrid Food&Drink Summit 2016
 
Jornada EPA - Mª Isabel Prieto
Jornada EPA - Mª Isabel PrietoJornada EPA - Mª Isabel Prieto
Jornada EPA - Mª Isabel Prieto
 
Jornada EPA - Virginia Navarro
Jornada EPA - Virginia NavarroJornada EPA - Virginia Navarro
Jornada EPA - Virginia Navarro
 
Jornada EPA - Maria Dolores Vázquez
Jornada EPA - Maria Dolores VázquezJornada EPA - Maria Dolores Vázquez
Jornada EPA - Maria Dolores Vázquez
 
Jornada EPA - Miquel Bonet
Jornada EPA - Miquel BonetJornada EPA - Miquel Bonet
Jornada EPA - Miquel Bonet
 
Curso Eficiencia Energética en Sistemas de Vapor Industriales
Curso Eficiencia Energética en Sistemas de Vapor IndustrialesCurso Eficiencia Energética en Sistemas de Vapor Industriales
Curso Eficiencia Energética en Sistemas de Vapor Industriales
 
Curso Eficiencia Energética en Sistemas de Vapor Industriales
Curso Eficiencia Energética en Sistemas de Vapor IndustrialesCurso Eficiencia Energética en Sistemas de Vapor Industriales
Curso Eficiencia Energética en Sistemas de Vapor Industriales
 
II ALIBETOPIAS 2016
II ALIBETOPIAS 2016II ALIBETOPIAS 2016
II ALIBETOPIAS 2016
 
Eficiencia en la gestión de recursos
Eficiencia en la gestión de recursos Eficiencia en la gestión de recursos
Eficiencia en la gestión de recursos
 
¿Ser o parecer? Camino hacia empresas sostenibles en el sector de la alimenta...
¿Ser o parecer? Camino hacia empresas sostenibles en el sector de la alimenta...¿Ser o parecer? Camino hacia empresas sostenibles en el sector de la alimenta...
¿Ser o parecer? Camino hacia empresas sostenibles en el sector de la alimenta...
 
El clima del futuro. Escenarios y adaptación
El clima del futuro. Escenarios y adaptaciónEl clima del futuro. Escenarios y adaptación
El clima del futuro. Escenarios y adaptación
 
Agenda internacional en cambio climático e implicaciones para el sector
Agenda internacional en cambio climático e implicaciones para el sector Agenda internacional en cambio climático e implicaciones para el sector
Agenda internacional en cambio climático e implicaciones para el sector
 
Inscripción Envifood 2016
Inscripción Envifood 2016Inscripción Envifood 2016
Inscripción Envifood 2016
 
Envifood Meeting Point 2016
Envifood Meeting Point 2016Envifood Meeting Point 2016
Envifood Meeting Point 2016
 

FoodDrinkEurope: Economic Bulletin Q4 2012

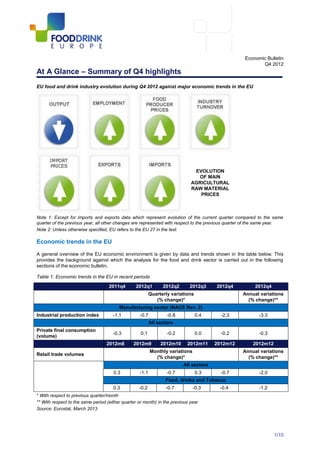
  • 1. Economic Bulletin Q4 2012 At A Glance – Summary of Q4 highlights EU food and drink industry evolution during Q4 2012 against major economic trends in the EU EVOLUTION OF MAIN AGRICULTURAL RAW MATERIAL PRICES Note 1: Except for imports and exports data which represent evolution of the current quarter compared to the same quarter of the previous year, all other changes are represented with respect to the previous quarter of the same year. Note 2: Unless otherwise specified, EU refers to the EU 27 in the text. Economic trends in the EU A general overview of the EU economic environment is given by data and trends shown in the table below. This provides the background against which the analysis for the food and drink sector is carried out in the following sections of the economic bulletin. Table 1: Economic trends in the EU in recent periods 2011q4 2012q1 2012q2 2012q3 2012q4 2012q4 Quarterly variations Annual variations (% change)* (% change)** Manufacturing sector (NACE Rev. 2) Industrial production index -1.1 -0.7 -0.8 0.4 -2.3 -3.3 All sectors Private final consumption -0.3 0.1 -0.2 0.0 -0.2 -0.3 (volume) 2012m8 2012m9 2012m10 2012m11 2012m12 2012m12 Monthly variations Annual variations Retail trade volumes (% change)* (% change)** All sectors 0.3 -1.1 -0.7 0.3 -0.7 -2.0 Food, drinks and Tobacco 0.3 -0.2 -0.7 -0.3 -0.4 -1.2 * With respect to previous quarter/month ** With respect to the same period (either quarter or month) in the previous year Source: Eurostat, March 2013 1/10
  • 2. The EU manufacturing industrial production index decreased (2.3%) in Q4 of 2012. In the same period, private consumption (volumes) registered a slight decrease compared to the previous quarter, i.e. -0.2%. The yearly comparison shows that the industrial production index decreased markedly in Q4 of 2012 compared to the same quarter of the previous year, i.e. by -3.3%. Private consumption also decreased compared to the change registered in the same quarter of 2011, but to a far lesser extent, i.e. -0.3%. The (all sectors) volume of retail trade decreased by 0.7% in December (compared to November 2012), while retail trade in food, drinks and tobacco decreased by 0.4%. Among the Member States for which data are available, total retail trade fell in twelve, rose in eight and remained stable in Finland. The largest decreases were registered in Romania (-3.2%), Spain (-2.2%) and Slovenia (-2.1%), and the highest increases in Luxembourg 1 and Poland (both +2.2%) and Estonia (+1.9%). FOOD AND DRINK INDUSTRY INDICATORS IN Q4 OF 2012 1. Food and drink industry output index decreased Food and drink industry output (production) in the EU fell by 0.36% in Q4 of 2012 compared to the previous quarter. This is in line with the negative trend experienced by the manufacturing production index in the same period (see the above section: Economic trends in the EU). Q4 of 2012 represented a quarter of mixed performances in terms of production at the Member State level. Austria (+1.36%), Czech Republic (+0.49%) and Sweden (+0.20%) reached positive production index growth rates, whereas Bulgaria (-2.84%), Spain (-1.35%) and Finland (-0.75%) remained on their negative trend of the previous quarter. The best performers whose production index growth rates even exceeded the positive growth rates of the previous quarter include Ireland (+7.31%), Estonia (+1.41%) and Germany (+0.72%). Table 2: Industry production index, quarterly growth 2012 Q3/2012 Q2 2012 Q4/2012 Q3 Member State (% change) (% change) EU27 0.52 -0.36 Austria -0.16 1.36 Belgium 1.36 0.42 Bulgaria -1.62 -2.84 Czech Republic -0.37 0.49 Denmark 2.60 -1.07 Estonia 0.96 1.41 Finland -1.47 -0.75 Germany 0.05 0.72 Greece 0.21 -3.20 Hungary 0.58 -3.27 Ireland 1.23 7.31 Italy 1.27 -2.31 Latvia 1.65 -1.63 Lithuania 4.11 0.30 Netherlands 0.32 -0.03 Poland 1.44 0.90 Portugal 1.88 0.18 Spain -0.74 -1.35 Sweden -2.47 0.20 United Kingdom 0.34 -2.95 Source: Eurostat, Short-Term Business Statistics, NACE Rev. 2, March 2013 1 Eurostat news release, Euro indicators, 21/2013. 2/10
  • 3. 2. Evolution of main agricultural raw material prices The following shows a mixed picture for raw material prices: Oils and oil crops Grains Dairy Soybean Rape Cocoa Coffee Sugar Corn/ Soft WMP SMP Oil Bean Meal Seed Oil Palm Maize wheat oil Source: FoodDrinkEurope compilation Cocoa and coffee Quarterly developments: After having experienced positive growth of 9.3% in Q3 of 2012, cocoa prices decreased on average by 1.7% in Q4 of 2012. A similar negative trend was also experienced by coffee composite prices which fell by 9.6% in Q4 of 2012 against the 1% drop of the previous quarter. Year-on-year developments: The year-on-year comparison shows that, the New York cocoa market recorded a 0.71% decrease with respect to Q4 of 2011. However, coffee composite prices were significantly lower than their level in the same quarter of 2011, i.e. by 28.1%. Cocoa NY market price and coffee world price (monthly averages, current price, $/t) 6000 5000 4000 3000 2000 1000 0 Apr-07 Jul-07 Apr-08 Jul-08 Apr-09 Jul-09 Apr-10 Jul-10 Apr-11 Jul-11 Oct-11 Apr-12 Jul-12 Oct-07 Oct-08 Oct-09 Oct-10 Oct-12 Jan-07 Jan-08 Jan-09 Jan-10 Jan-11 Jan-12 Cocoa price in $/t Coffee composite price in $/t Source: International Cocoa Organisation (ICCO) and International Coffee Organisation (ICO), March 2013 Sugar Quarterly developments: EU white sugar prices slightly increased (+2.0%) in Q4 of 2012. In the same quarter, U.S. market price continued to decrease, i.e. by 19.4% compared to Q3 of 2012. Year-on-year developments: On average, EU market price for white sugar was 12.4% higher in Q4 of 2012 than the same quarter of the previous year whereas the U.S. market price was 37.4% lower than the average in Q4 of 2011. In comparison, the world sugar price was 12.6% lower than the average of the same quarter of 2011. 3/10
  • 4. White Sugar prices (monthly averages, current prices, €/t) 1200 1000 800 600 400 200 0 Jul Jul Jul Jan '10 Jul Jul Apr Apr Apr Apr Apr Apr Jan '08 Jan '09 Jan '11 Jan '12 Oct Oct Oct Oct Oct Oct July Jan '07 World price US market price Source: European Commission – Circa (Regulations (EC) No 562/2005 Article 6(1) and 479/2010 Article 2), United States Department of Agriculture, March 2013 Grains Corn maize prices Quarterly developments: Contrary to the positive trend of the previous two quarters, EU maize prices slightly decreased in Q4 of 2012 (compared to Q3 of 2012), i.e. by 0.9%. U.S. maize prices also decreased in the same period, i.e. by 7.1%, falling from the record price level of the previous quarter which experts claimed to be a result of drought and rising industrial demand. Year-on-year developments: On average, EU maize prices were 31.4% higher in Q4 of 2012 than the same quarter of the previous year. Similarly but to a lesser extent, U.S. maize prices were 24.0% higher in Q4 of 2012 than in the same quarter of the previous year. Corn/maize market prices (monthly averages, current prices, €/t) 300.00 250.00 200.00 150.00 100.00 50.00 Oct-08 Apr-07 Jul-07 Oct-07 Apr-08 Jul-08 Apr-09 Jul-09 Oct-09 Apr-10 Jul-10 Oct-10 Apr-11 Jul-11 Oct-11 Apr-12 Jul-12 Oct-12 Jan-07 Jan-08 Jan-09 Jan-10 Jan-11 Jan-12 DG Agri EU market price €/t FAO US market price €/t Source: FAO and European Commission (DG Agri), March 2013 4/10
  • 5. Soft wheat prices Quarterly developments: Similarly to the previous quarter trend but with a slower pace, EU maize prices continued to increase in Q4 of 2012 (compared to Q3 of the same year) i.e. by 6.6%. U.S. maize prices decreased during the same period i.e. by 2.3%. Year-on-year developments: On average, EU maize prices were 33.9% higher in Q4 of 2012 than the same quarter of the previous year. Similarly, U.S. soft wheat prices were 40.3% higher in Q3 of 2012 than in the same quarter of the previous year. Soft wheat market prices (monthly averages, current prices, €/t) 300.00 250.00 200.00 150.00 100.00 50.00 Oct-10 Apr-07 Jul-07 Oct-07 Apr-08 Jul-08 Oct-08 Apr-09 Jul-09 Oct-09 Apr-10 Jul-10 Apr-11 Jul-11 Oct-11 Apr-12 Jul-12 Oct-12 Jan-07 Jan-08 Jan-09 Jan-10 Jan-11 Jan-12 DG Agri EU market price €/t FAO US market price €/t Source: FAO and European Commission (DG Agri), March 2013 Dairy Skimmed Milk Powder (SMP) Quarterly developments: Similarly to the previous quarter trend but with a slower pace, EU SMP prices continued to increase in Q4 of 2012 (compared to Q3 of the same year) i.e. by 11.8%. Moreover, for the first time since Q3 of 2009, average EU prices in Q4 of 2012 were higher than world market prices. Year-on-year developments: The yearly comparison shows that, on average, EU SMP prices were 15.1% higher in Q4 of 2012 than the same period in 2011. 5/10
  • 6. SMP (monthly averages, current prices, €/t) 4500 4000 Q4 2012 3500 Q3 2009 3000 2500 2000 1500 1000 500 0 Jul Jul Jul Jul Jul Jul Apr Apr Apr Apr Apr Apr Oct Oct Oct Oct Oct Oct Jan '07 Jan '08 Jan '09 Jan '10 Jan '11 Jan '12 FAO €/t World market price CLAL €/t EU market price CIRCA €/t EU market price R. 1234/07 €/t EU reference price Source: FAO, CLAL consultancy (discontinued after January 2011 to the benefit of the European Commission source), European Commission – Circa (Regulations (EC) No 562/2005 Article 6(1) and 479/2010 Article 2), March 2013 Whole Milk Powder (WMP) Quarterly developments: Generally higher than world market prices since Q3 of 2010, EU WMP average prices continued to increase in Q4 of 2012, i.e. by 9.6% from the previous quarter. Year-on-year developments: The yearly comparison shows that, on average, EU WMP prices remained fairly stable (- 0.1%) in Q4 of 2012 compared to the same quarter of 2011. WMP (monthly averages, current prices, €/t) 4000 3500 3000 2500 2000 1500 1000 Jan '08 Jul Jul Jul Jul Jul Sep Sep Sep Sep Sep Mar Jan '09 May Mar Jan '10 May Mar Jan '11 May Mar Jan '12 May Mar May Nov Nov Nov Nov Nov World market price CLAL €/t EU market price CIRCA €/t EU market price Source: FAO, CLAL consultancy (discontinued after January 2011 to the benefit of the European Commission source), European Commission – Circa (Regulations (EC) No 562/2005 Article 6(1) and 479/2010 Article 2), March 2013 6/10
  • 7. Oils and oil crops Quarterly developments: In Q4 of 2012 oils and oils crops prices experienced a general decrease. The decrease in prices was most pronounced for Palm oil and Soybeans with a price decline of 18.5% and 10.1%, respectively. Moreover, after having significantly increased during the previous quarter, prices of Soybean meal (+29.3%) started to decrease in Q4 of 2012, i.e. by 6.9%. Year-on-year developments: The yearly comparison shows that in Q4 of 2012 only Soybean meal, Soybeans and Rapeseed prices were significantly higher than in the same quarter of 2011: by 64.6%, 23.7% and 4.7% respectively. On the contrary Palm oil, Rape oil and Soybean oil were 21.0%, 5.8% and 4.6% lower in Q4 of 2012 than the same period of the previous year. Oils and oilcrop prices (monthly averages, current prices $/t) 1800 1600 1400 1200 1000 800 600 400 200 0 Apr-09 Apr-07 Jul-07 Oct-07 Apr-08 Jul-08 Oct-08 Jul-09 Oct-09 Apr-10 Jul-10 Oct-10 Apr-11 Jul-11 Oct-11 Apr-12 Jul-12 Oct-12 Jan-07 Jan-08 Jan-09 Jan-10 Jan-11 Jan-12 World Bank Soybean oil $/t World Bank Soybeans $/t World Bank Soybean meal $/t World Bank Palm oil $/t Source: World Bank and FAO, March 2013 3. Price developments in the food supply chain Consumer prices (1.34%), producer prices (1.31%) and inflation (0.83%) all grew on average in Q4 of 2012. EU27: Price developments in the food supply chain 145.0 140.0 135.0 130.0 125.0 120.0 115.0 110.0 105.0 100.0 2007M04 2011M04 2007M01 2007M07 2007M10 2008M01 2008M04 2008M07 2008M10 2009M01 2009M04 2009M07 2009M10 2010M01 2010M04 2010M07 2010M10 2011M01 2011M07 2011M10 2012M01 2012M04 2012M07 2012M10 Agricultural Commodity Price Producer Price Source: Eurostat (Food supply chain monitor), March 2013 7/10
  • 8. 4. Slight increase in employment index in the EU food and drink industry After having experienced a slight decrease in Q2 and Q3, the labour input index for the food and drink industry increased (+0.28%) in Q4 of 2012. This is contrary to the performance shown by the (total) manufacturing sector whose employment index decreased by 0.31% in the same period. When looking at the industry breakdown, the food sector employment index increased by 0.1%, whereas the beverages industry employment index increased by 1.02% in comparison with the previous quarter. Labour input index (2010=100) : food and drink industry trends compared to total manufacturing 110 105 100 95 90 85 80 2010Q1 2010Q2 2010Q3 2010Q4 2011Q1 2011Q2 2011Q3 2011Q4 2012Q1 2012Q2 2012Q3 2012Q4 Manufacturing Manufacture of food products Manufacture of beverages Source: Eurostat (SBS), Nace Rev. 2, seasonally adjusted data, March 2013. 5. Food and drink industry turnover continued to increase The food and drink industry’s turnover index increased by 0.88% in Q4 of 2012 compared to the previous quarter. EU27: Turnover index (2010 = 100) 115.00 110.00 105.00 100.00 95.00 90.00 2012Q1 2007Q1 2007Q2 2007Q3 2007Q4 2008Q1 2008Q2 2008Q3 2008Q4 2009Q1 2009Q2 2009Q3 2009Q4 2010Q1 2010Q2 2010Q3 2010Q4 2011Q1 2011Q2 2011Q3 2011Q4 2012Q2 2012Q3 2012Q4 Manufacture of food products and beverages Source: Eurostat (SBS), seasonally adjusted data, March 2013 8/10
  • 9. 6. Imported food prices increased in Q4 of 2012 Imported food prices registered a slight increase in Q4 of 2012, up to 0.49% from the previous quarter. Food and drink import price index (2010 = 100) 115.00 110.00 105.00 100.00 95.00 90.00 85.00 80.00 2010Q2 2007Q1 2007Q2 2007Q3 2007Q4 2008Q1 2008Q2 2008Q3 2008Q4 2009Q1 2009Q2 2009Q3 2009Q4 2010Q1 2010Q3 2010Q4 2011Q1 2011Q2 2011Q3 2011Q4 2012Q1 2012Q2 2012Q3 2012Q4 Euro area Source: Eurostat (SBS), March 2013 Exchange rates In Q4 of 2012, the euro has appreciated against most major non-EU currencies in an environment of low volatility. The table below gives details for the euro appreciation against the currencies of major trading partners. Table 3: Evolution of quarterly average exchange rates Q4 2012/ Q3 2012 1 EUR= 2012 Q3 2012 Q4 % Australian Dollar 1.20 1.25 3.73 Canadian Dollar 1.24 1.29 3.24 Brazilian Real 2.54 2.67 5.17 Swiss Franc 1.20 1.21 0.37 Chinese Yuan Renminbi 7.94 8.10 2.05 Japanese Yen 98.30 105.12 6.94 New Zealand Dollar 1.55 1.58 1.87 United States Dollar 1.25 1.30 3.72 Pound Sterling 0.79 0.81 2.0 Source: ECB, bilateral exchange rates, March 2013 9/10
  • 10. 7. Trade: Both imports and exports increased in Q4 of 2012 year-on-year The EU trade balance in food and drink products continued to improve during the Q4 of 2012 compared to the same period of 2011. The export surplus amounted to nearly €6.5 billion, which marks an increase of €1.5 billion year-on-year. Imports Q4 of 2012 Exports Q4 of 2012 Total food and drink imports amounted to 17.1 Total food and drink exports amounted to €23.6 billion, i.e. 3.5% more compared to the previous billion, i.e. 9.6% more compared to the same period year. However, a real import increase in terms of of 2011. Similar to Q3 of 2012, the value of exported quantity and value was observed for only a limited drinks increased proportionately more than export of group of alcoholic and soft drinks, and grain mill and other foodstuffs. Nonetheless, the year-on-year export starch products. For a number of foodstuffs, the import growth registered for fish products, oils and fats and growth in terms of value was linked to the price factor, spirits was also very positive (+30.2%, 21%, 20% while the imported quantity was in fact lower than a respectively) and matched with a similar trend in terms year ago. Finally, some products registered a real of exported quantities. Finally, other food and drink import reduction both in terms of volume and value, products contributed also to the growth in export value, e.g. dairy (-11.8% in value and -13.4% in volume), fruit despite witnessing a double-digit volume reduction. A and vegetables (-7% in value and -14.4% in volume), single-digit volume reduction was registered for wines, and less significantly, spirits and cider. beer and meat products. Trade balance in € million Q4 2011 2012 Total of Food and Drink 4,996 6,482 Meat products 1,059 1,306 Fish and sea food products -3,339 -2,959 Processed fruit and vegetables -853 -591 Oils and fats -2,694 -3,171 Dairy products 2,081 2,124 Grain mill and starch products 347 311 Bakery & farinaceous products 699 814 Other food products 2,130 2,310 Prepared animal feed 508 586 Drinks 4,983 5,714 FoodDrinkEurope - represents the European food and drink industry - the leading industrial sector and major EU employer and exporter. FoodDrinkEurope’s role is to represent the food and drink industry’s interests, at the level of both European and international institutions. FoodDrinkEurope’s membership consists of 24 national federations and 3 observers, 25 European sector associations and 18 major food and drink companies. For further information, please contact: Lisa McCooey, Communications Director / Deputy Director General. Tel: + 32 2 508 10 24 - l.mccooey@fooddrinkeurope.eu 10/10