
Recommended
Recommended
More Related Content
What's hot
What's hot (11)
Similar to Eurostatinflation2 17042019-ap-en
Similar to Eurostatinflation2 17042019-ap-en (20)
More from Paperjam_redaction
More from Paperjam_redaction (20)
Recently uploaded
Recently uploaded (20)
Eurostatinflation2 17042019-ap-en
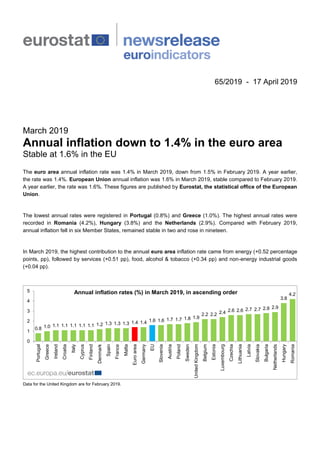
- 1. 65/2019 - 17 April 2019 March 2019 Annual inflation down to 1.4% in the euro area Stable at 1.6% in the EU The euro area annual inflation rate was 1.4% in March 2019, down from 1.5% in February 2019. A year earlier, the rate was 1.4%. European Union annual inflation was 1.6% in March 2019, stable compared to February 2019. A year earlier, the rate was 1.6%. These figures are published by Eurostat, the statistical office of the European Union. The lowest annual rates were registered in Portugal (0.8%) and Greece (1.0%). The highest annual rates were recorded in Romania (4.2%), Hungary (3.8%) and the Netherlands (2.9%). Compared with February 2019, annual inflation fell in six Member States, remained stable in two and rose in nineteen. In March 2019, the highest contribution to the annual euro area inflation rate came from energy (+0.52 percentage points, pp), followed by services (+0.51 pp), food, alcohol & tobacco (+0.34 pp) and non-energy industrial goods (+0.04 pp). Data for the United Kingdom are for February 2019. 0.8 1.0 1.1 1.1 1.1 1.1 1.1 1.2 1.3 1.3 1.3 1.4 1.4 1.6 1.6 1.7 1.7 1.8 1.9 2.2 2.2 2.4 2.6 2.6 2.7 2.7 2.8 2.9 3.8 4.2 0 1 2 3 4 5 Portugal Greece Ireland Croatia Italy Cyprus Finland Denmark Spain France Malta Euroarea Germany EU Slovenia Austria Poland Sweden UnitedKingdom Belgium Estonia Luxembourg Czechia Lithuania Latvia Slovakia Bulgaria Netherlands Hungary RomaniaAnnual inflation rates (%) in March 2019, in ascending order
- 2. Inflation rates (%) measured by the HICP Annual rate Monthly rate Mar 18 Oct 18 Nov 18 Dec 18 Jan 19 Feb 19 Mar 19 Mar 19 Euro area 1.4 2.3 1.9 1.5 1.4 1.5 1.4 1.0 EU 1.6 2.3 2.0 1.6 1.5 1.6 1.6 0.8 Belgium 1.5 3.2 2.9 2.2 1.8 2.0 2.2 0.2 Bulgaria 1.9 3.6 3.0 2.3 2.3 2.4 2.8 0.2 Czechia 1.6 2.0 1.6 1.6 2.0 2.4 2.6 0.2 Denmark 0.4 0.7 0.7 0.7 1.2 1.1 1.2 0.1 Germany 1.7 2.6 2.2 1.7 1.7 1.7 1.4 0.5 Estonia 2.9 4.5 3.2 3.3 2.8 1.9 2.2 0.4 Ireland 0.5 1.1 0.8 0.8 0.8 0.7 1.1 0.8 Greece 0.2 1.8 1.1 0.6 0.5 0.8 1.0 1.4 Spain 1.3 2.3 1.7 1.2 1.0 1.1 1.3 1.4 France 1.7 2.5 2.2 1.9 1.4 1.6 1.3 0.9 Croatia 1.2 1.7 1.3 1.0 0.6 0.8 1.1 0.8 Italy 0.9 1.7 1.6 1.2 0.9 1.1 1.1 2.3 Cyprus -0.4 1.9 1.6 1.0 2.1 0.8 1.1 1.1 Latvia 2.3 3.2 2.9 2.5 2.9 2.8 2.7 1.1 Lithuania 2.5 2.8 2.4 1.8 1.6 2.0 2.6 0.9 Luxembourg 1.1 2.8 2.6 1.9 1.6 2.1 2.4 0.3 Hungary 2.0 3.9 3.2 2.8 2.8 3.2 3.8 0.7 Malta 1.3 2.1 1.4 1.2 1.0 1.3 1.3 1.0 Netherlands 1.0 1.9 1.8 1.8 2.0 2.6 2.9 0.5 Austria 2.0 2.4 2.3 1.7 1.7 1.4 1.7 1.1 Poland 0.7 1.5 1.1 0.9 0.6 1.3 1.7 0.4 Portugal 0.8 0.8 0.9 0.6 0.6 0.9 0.8 2.1 Romania 4.0 4.2 3.2 3.0 3.2 4.0 4.2 0.5 Slovenia 1.5 2.3 2.1 1.4 1.2 1.3 1.6 0.7 Slovakia 2.5 2.5 2.0 1.9 2.2 2.3 2.7 0.7 Finland 0.9 1.7 1.4 1.3 1.2 1.3 1.1 0.1 Sweden 2.0 2.4 2.1 2.2 2.0 1.9 1.8 0.2 United Kingdom 2.5 2.4 2.3 2.1 1.8 1.9 : : Iceland 0.3 0.9 1.5 2.0 1.8 1.0 1.3 1.0 Norway 2.2 3.6 3.8 3.9 3.6 3.4 3.2 0.1 Switzerland 0.7 1.1 1.0 0.8 0.7 0.7 0.7 0.3 : not available The source dataset is available here. -1 0 1 2 3 4 Mar Jun Sep Dec Mar Jun Sep Dec Mar Jun Sep Dec Mar Jun Sep Dec Mar Jun Sep Dec Mar Jun Sep Dec Mar Jun Sep Dec Mar Jun Sep Dec Mar Jun Sep Dec Mar Jun Sep Dec Mar 2009 2010 2011 2012 2013 2014 2015 2016 2017 2018 2019 Euro area EU Annual inflation rate (%)
- 3. Euro area inflation rate (%), selected aggregates Weight (‰) Annual rate Monthly rate 2019 Mar 18 Oct 18 Nov 18 Dec 18 Jan 19 Feb 19 Mar 19 Mar 19 All-items HICP 1000.0 1.4 2.3 1.9 1.5 1.4 1.5 1.4 1.0 All-items excluding: > energy 898.7 1.3 1.4 1.2 1.1 1.3 1.3 1.0 1.0 > energy, unprocessed food 854.0 1.3 1.3 1.1 1.1 1.2 1.2 1.0 1.2 > energy, food, alcohol & tobacco 708.5 1.1 1.2 0.9 0.9 1.1 1.0 0.8 1.3 > energy, seasonal food 873.5 1.4 1.3 1.1 1.1 1.2 1.2 1.0 1.1 > tobacco 977.4 1.3 2.2 1.8 1.4 1.3 1.4 1.3 1.0 Food, alcohol & tobacco 190.2 2.1 2.2 1.9 1.8 1.8 2.3 1.8 0.0 > processed food, alcohol & tobacco 145.4 2.4 2.1 2.0 1.7 1.8 2.1 2.0 0.5 > unprocessed food 44.7 1.2 2.4 1.8 1.8 1.8 2.9 1.1 -1.5 Energy 101.3 2.1 10.8 9.1 5.5 2.7 3.6 5.3 0.8 Non-energy industrial goods 263.8 0.1 0.2 0.2 0.2 0.3 0.4 0.1 3.0 Services 444.7 1.7 1.7 1.4 1.3 1.6 1.4 1.1 0.4 Contributions to the euro area annual inflation rate (pp), selected aggregates Contributions Mar 18 Oct 18 Nov 18 Dec 18 Jan 19 Feb 19 Mar 19 Food, alcohol & tobacco 0.41 0.42 0.38 0.34 0.36 0.44 0.34 > processed food, alcohol & tobacco 0.36 0.31 0.30 0.26 0.27 0.31 0.29 > unprocessed food 0.06 0.11 0.08 0.08 0.08 0.13 0.05 Energy 0.20 1.02 0.88 0.53 0.26 0.35 0.52 Non-energy industrial goods 0.03 0.07 0.06 0.06 0.08 0.09 0.04 Services 0.75 0.77 0.60 0.59 0.70 0.61 0.51 The full dataset is available in the Eurostat online database. Geographical coverage The euro area consists of Belgium, Germany, Estonia, Ireland, Greece, Spain, France, Italy, Cyprus, Latvia, Lithuania, Luxembourg, Malta, the Netherlands, Austria, Portugal, Slovenia, Slovakia and Finland. The European Union includes Belgium, Bulgaria, Czechia, Denmark, Germany, Estonia, Ireland, Greece, Spain, France, Croatia, Italy, Cyprus, Latvia, Lithuania, Luxembourg, Hungary, Malta, the Netherlands, Austria, Poland, Portugal, Romania, Slovenia, Slovakia, Finland, Sweden and the United Kingdom. The euro area and European Union data refer to the respective country compositions at a specific point in time. New Member States are integrated into the aggregates using a chain index formula. Data for the United Kingdom for March 2019 were not available in time for publication. Due to this fact, the EU totals have been calculated using Eurostat estimates. Methods and definitions The annual rate measures the change of the Harmonised Indices of Consumer Prices (HICP) between a month and the same month of the previous year, and the monthly rate compares the indices between the two latest months. A contribution shows how much of the annual inflation rate comes from a particular component of the HICP. The contributions are calculated according to a method which ensures their additivity (allowing for rounding). Revisions and timetable A flash estimate of euro area inflation is issued at the end of each reference month. The euro area flash estimate for March 2019, published on 1 April 2019, was 1.4%. The next flash estimate of euro area inflation with data for April 2019 is scheduled for 3 May 2019.
- 4. For more information Eurostat website section on inflation Eurostat database section on inflation Eurostat Statistics Explained article on inflation in the euro area Eurostat metadata on inflation Eurostat €-indicators release calendar Issued by: Eurostat Press Office Baiba GRANDOVSKA Tel: +352-4301-33 444 eurostat-pressoffice@ec.europa.eu For further information on methodology: Svetoslava PAVLOVA Tel: +352-4301-34 406 estat-hicp@ec.europa.eu EurostatStatistics ec.europa.eu/eurostat/ @EU_Eurostat Media requests: Eurostat media support / Tel: +352-4301-33 408 / eurostat-mediasupport@ec.europa.eu