EXPERIMENT-8
AIM OF THEEXPERIMENT-
Using MATLAB generate a carrier and a modulating signal.Modulate the carrier using FM.Show the
waveform in time domain and analyze it in frequency domain.Repeat the simulation for modulating
signal being sine,square and sawtooth signals.
SOFTWARE REQUIRED-
MATLAB
PROGRAM CODE-
1)(FM OF SINE WAVE)
clc;
clear all;
close all;
t=0:0.00001:0.1;
Em=1;
Ec=2;
b=50;
fm=50;
fc=1000;
k=10000;
% Ploting Baseband signal waveform
x=Em*cos(2*pi*fm*t);
subplot(5,1,1)
plot(x)
xlabel('Time')
ylabel('Amplitude')
grid on
title('Baseband signal waveform')
% Ploting Carrier signal waveform
y=Ec*cos(2*pi*fc*t);
subplot(5,1,2)
plot(y)
xlabel('Time')
2.
ylabel('Amplitude')
grid on
title('Carrier signalwaveform')
% Ploting Wideband Frequency modulated waveform
z=Ec*cos((2*pi*fc*t)+b*sin(2*pi*fm*t));
subplot(5,1,3)
plot(z)
xlabel('Time')
ylabel('Amplitude')
grid on
title('Frequency modulated waveform')
%Ploting NBFM
r=Ec*cos(2*pi*fc*t)-Ec*k*((Em/2*pi*fm)*sin(2*pi*fm*t)).*sin(2*pi*fc*t)
subplot(5,1,4)
plot(r)
3.
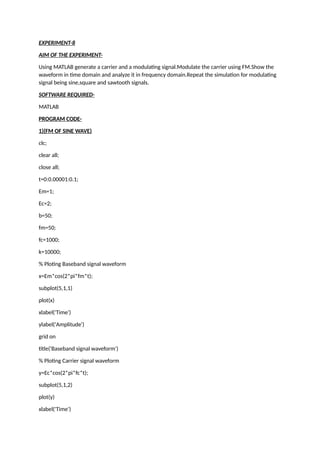
0 2000 40006000 8000 10000 12000
Time
-1
0
1
Amplitude
Baseband signal waveform
0 2000 4000 6000 8000 10000 12000
Time
-2
0
2
Amplitude
Carrier signal waveform
0 2000 4000 6000 8000 10000 12000
Time
-2
0
2
Amplitude
Frequency modulated waveform
0 2000 4000 6000 8000 10000 12000
-2
0
2
106
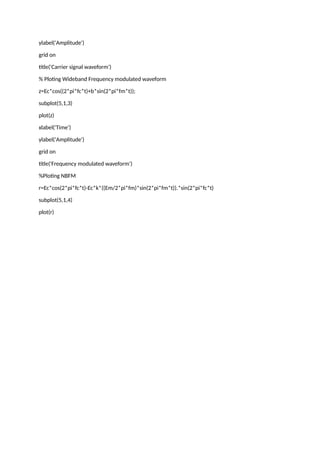
2)(FM OF SAWTOOTH WAVE)
clc;
clear all;
close all;
t=0:0.00001:0.1;
Em=1;
Ec=2;
b=50;
fm=50;
fc=1000;
k=10000;
% Ploting Baseband signal waveform
x=Em*sawtooth(2*pi*fm*t);
subplot(4,1,1)
4.
plot(x)
xlabel('Time')
ylabel('Amplitude')
grid on
title('Baseband signalwaveform')
% Ploting Carrier signal waveform
y=Ec*cos(2*pi*fc*t);
subplot(4,1,2)
plot(y)
xlabel('Time')
ylabel('Amplitude')
grid on
title('Carrier signal waveform')
% Ploting Wideband Frequency modulated waveform
z=Ec*cos((2*pi*fc*t)+b*sawtooth(2*pi*fm*t));
subplot(4,1,3)
plot(z)
xlabel('Time')
ylabel('Amplitude')
grid on
title('Frequency modulated waveform')
%Ploting Spectrum of FM
w=abs(fft(z));
subplot(4,1,4)
plot(w)
xlabel('Frequency')
ylabel('Amplitude')
grid on
title('Spectrum of FM')
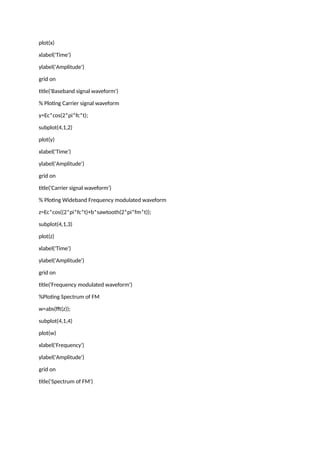
5.
0 2000 40006000 8000 10000 12000
Time
-1
0
1
Amplitude
Baseband signal waveform
0 2000 4000 6000 8000 10000 12000
Time
-2
0
2
Amplitude
Carrier signal waveform
0 2000 4000 6000 8000 10000 12000
Time
-2
0
2
Amplitude
Frequency modulated waveform
0 2000 4000 6000 8000 10000 12000
Frequency
0
5000
10000
Amplitude
Spectrum of FM
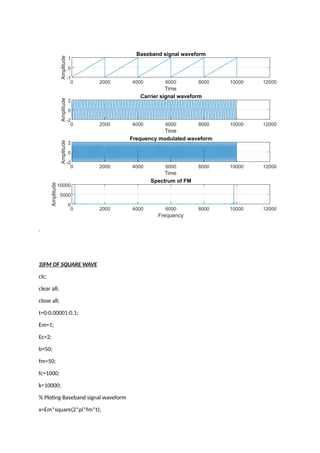
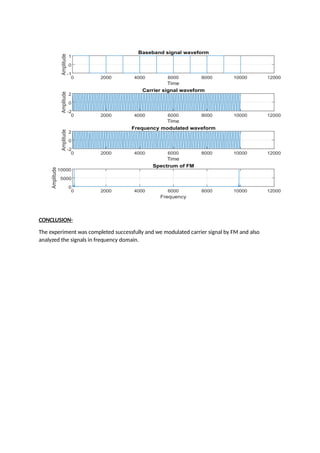
3)FM OF SQUARE WAVE
clc;
clear all;
close all;
t=0:0.00001:0.1;
Em=1;
Ec=2;
b=50;
fm=50;
fc=1000;
k=10000;
% Ploting Baseband signal waveform
x=Em*square(2*pi*fm*t);
6.
subplot(4,1,1)
plot(x)
xlabel('Time')
ylabel('Amplitude')
grid on
title('Baseband signalwaveform')
% Ploting Carrier signal waveform
y=Ec*cos(2*pi*fc*t);
subplot(4,1,2)
plot(y)
xlabel('Time')
ylabel('Amplitude')
grid on
title('Carrier signal waveform')
% Ploting Wideband Frequency modulated waveform
z=Ec*cos((2*pi*fc*t)+b*square(2*pi*fm*t));
subplot(4,1,3)
plot(z)
xlabel('Time')
ylabel('Amplitude')
grid on
title('Frequency modulated waveform')
%Ploting Spectrum of FM
w=abs(fft(z));
subplot(4,1,4)
plot(w)
xlabel('Frequency')
ylabel('Amplitude')
grid on
title('Spectrum of FM')
7.
0 2000 40006000 8000 10000 12000
Time
-1
0
1
Amplitude
Baseband signal waveform
0 2000 4000 6000 8000 10000 12000
Time
-2
0
2
Amplitude
Carrier signal waveform
0 2000 4000 6000 8000 10000 12000
Time
-2
0
2
Amplitude
Frequency modulated waveform
0 2000 4000 6000 8000 10000 12000
Frequency
0
5000
10000
Amplitude
Spectrum of FM
CONCLUSION-
The experiment was completed successfully and we modulated carrier signal by FM and also
analyzed the signals in frequency domain.