Downloaded 407 times


![Thanks! Web | http://ryancoleman.ca Email | [email_address] VizThink | http://vizthink.com I’ll make the deck, as well as links to suggested follow-up reading available at: http://ryancoleman.ca/fitc09 Twitter | @ryancoleman](https://image.slidesharecdn.com/fitc2009excitingdatass-090428131415-phpapp01/75/Designing-for-Visual-Efficiency-FITC09-113-2048.jpg)

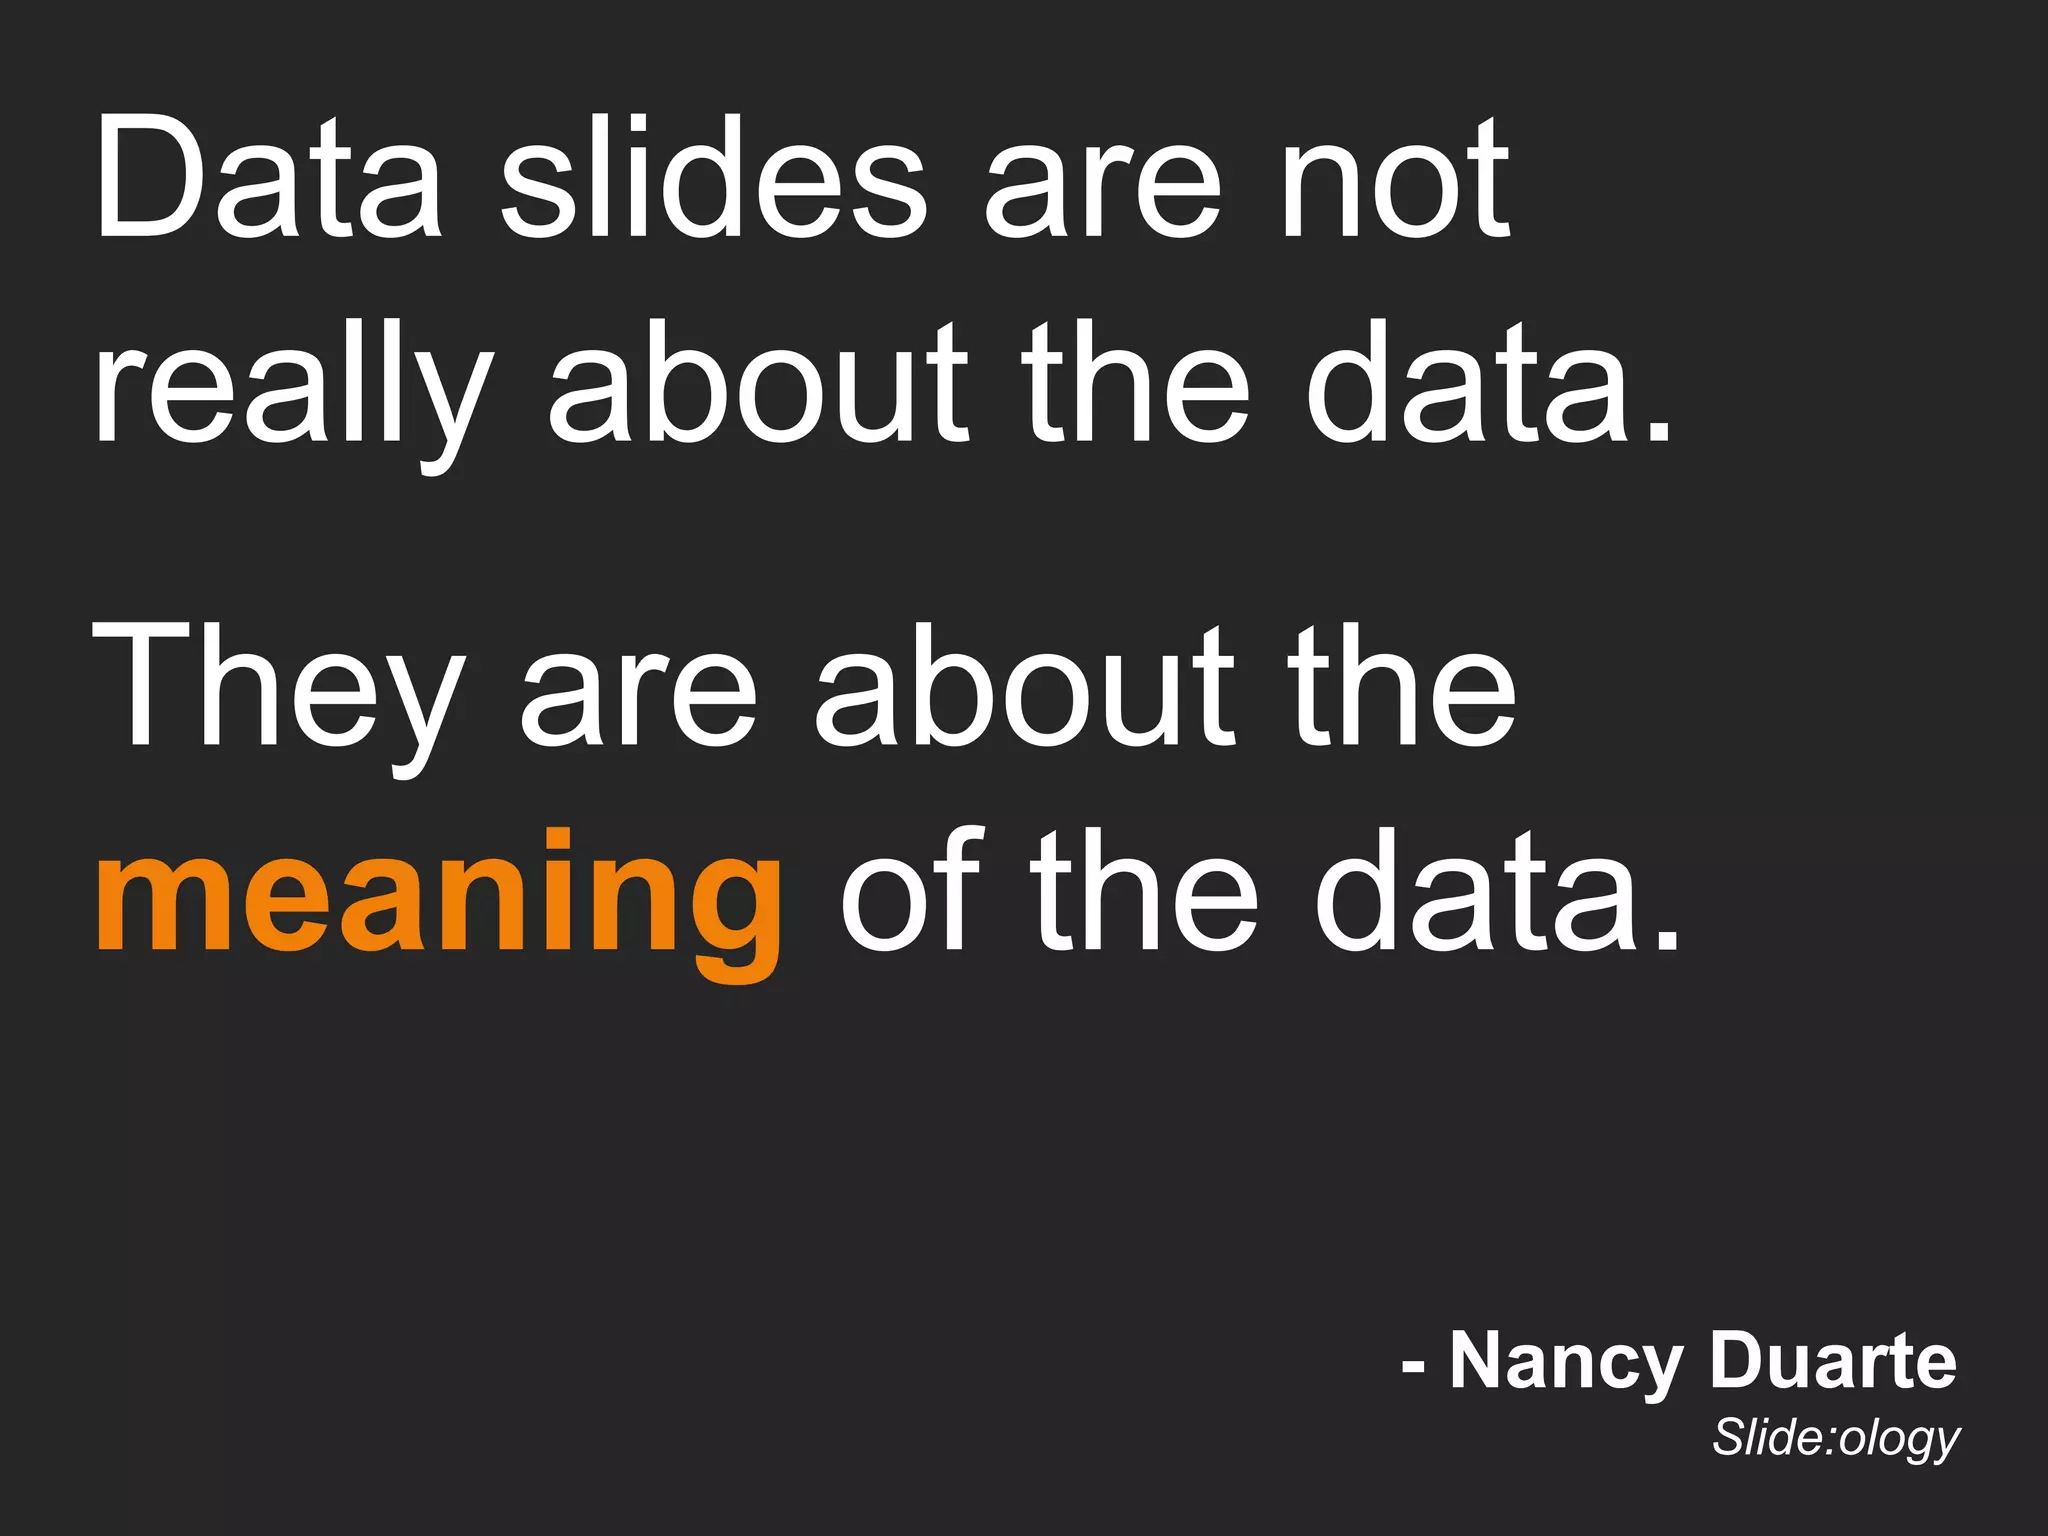
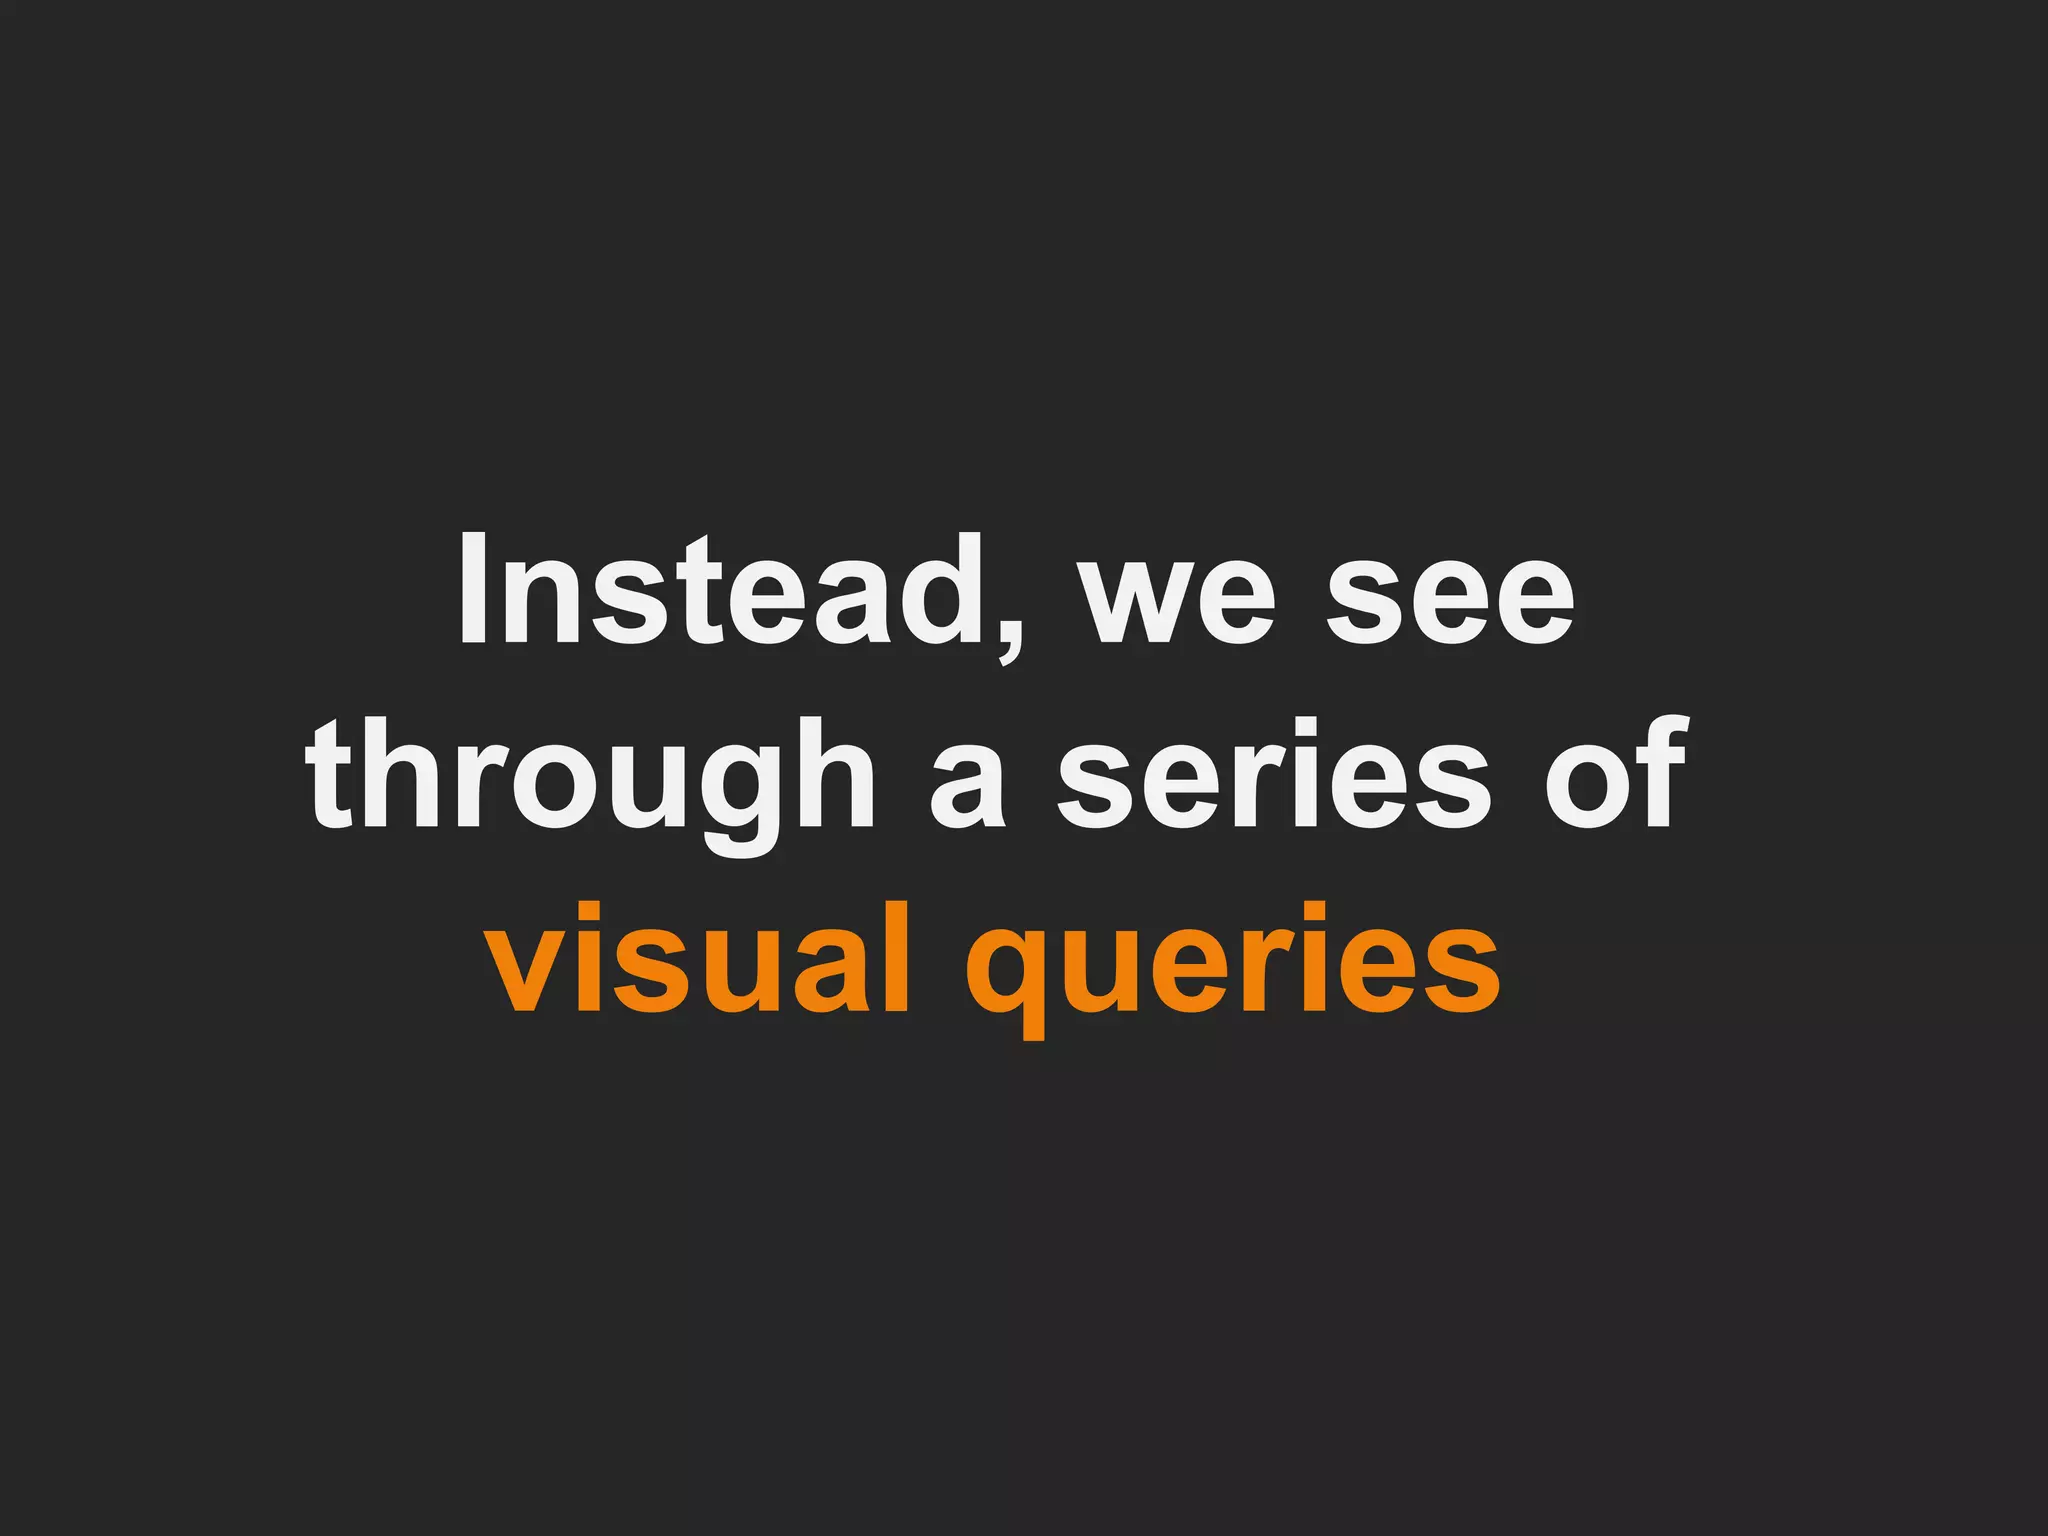
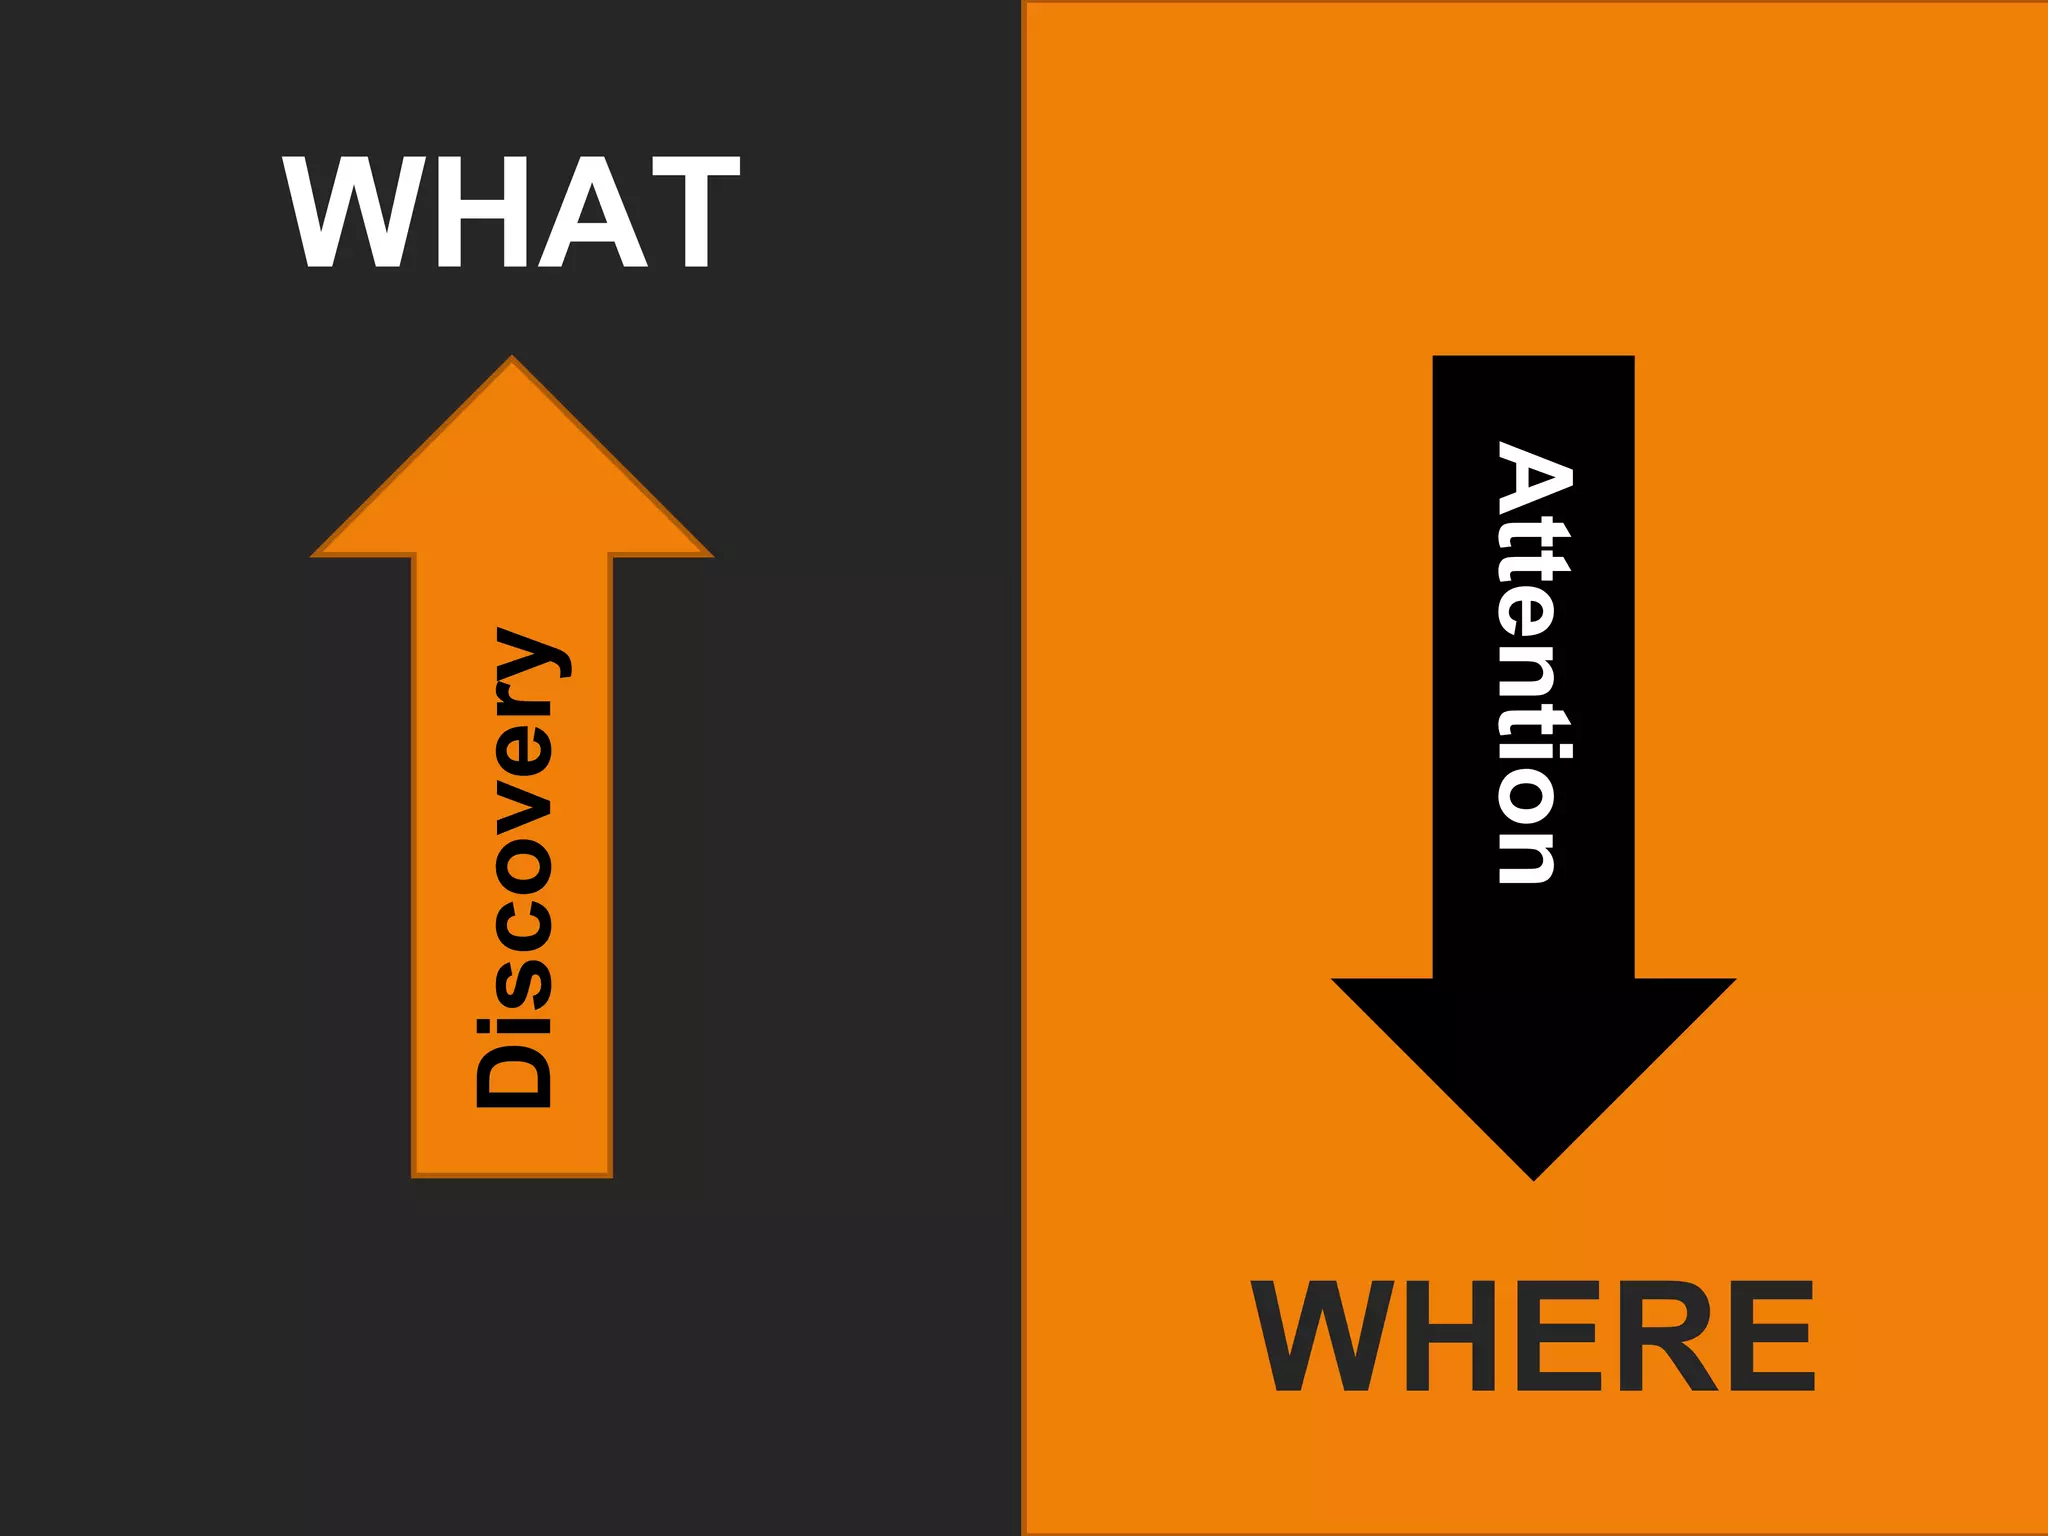
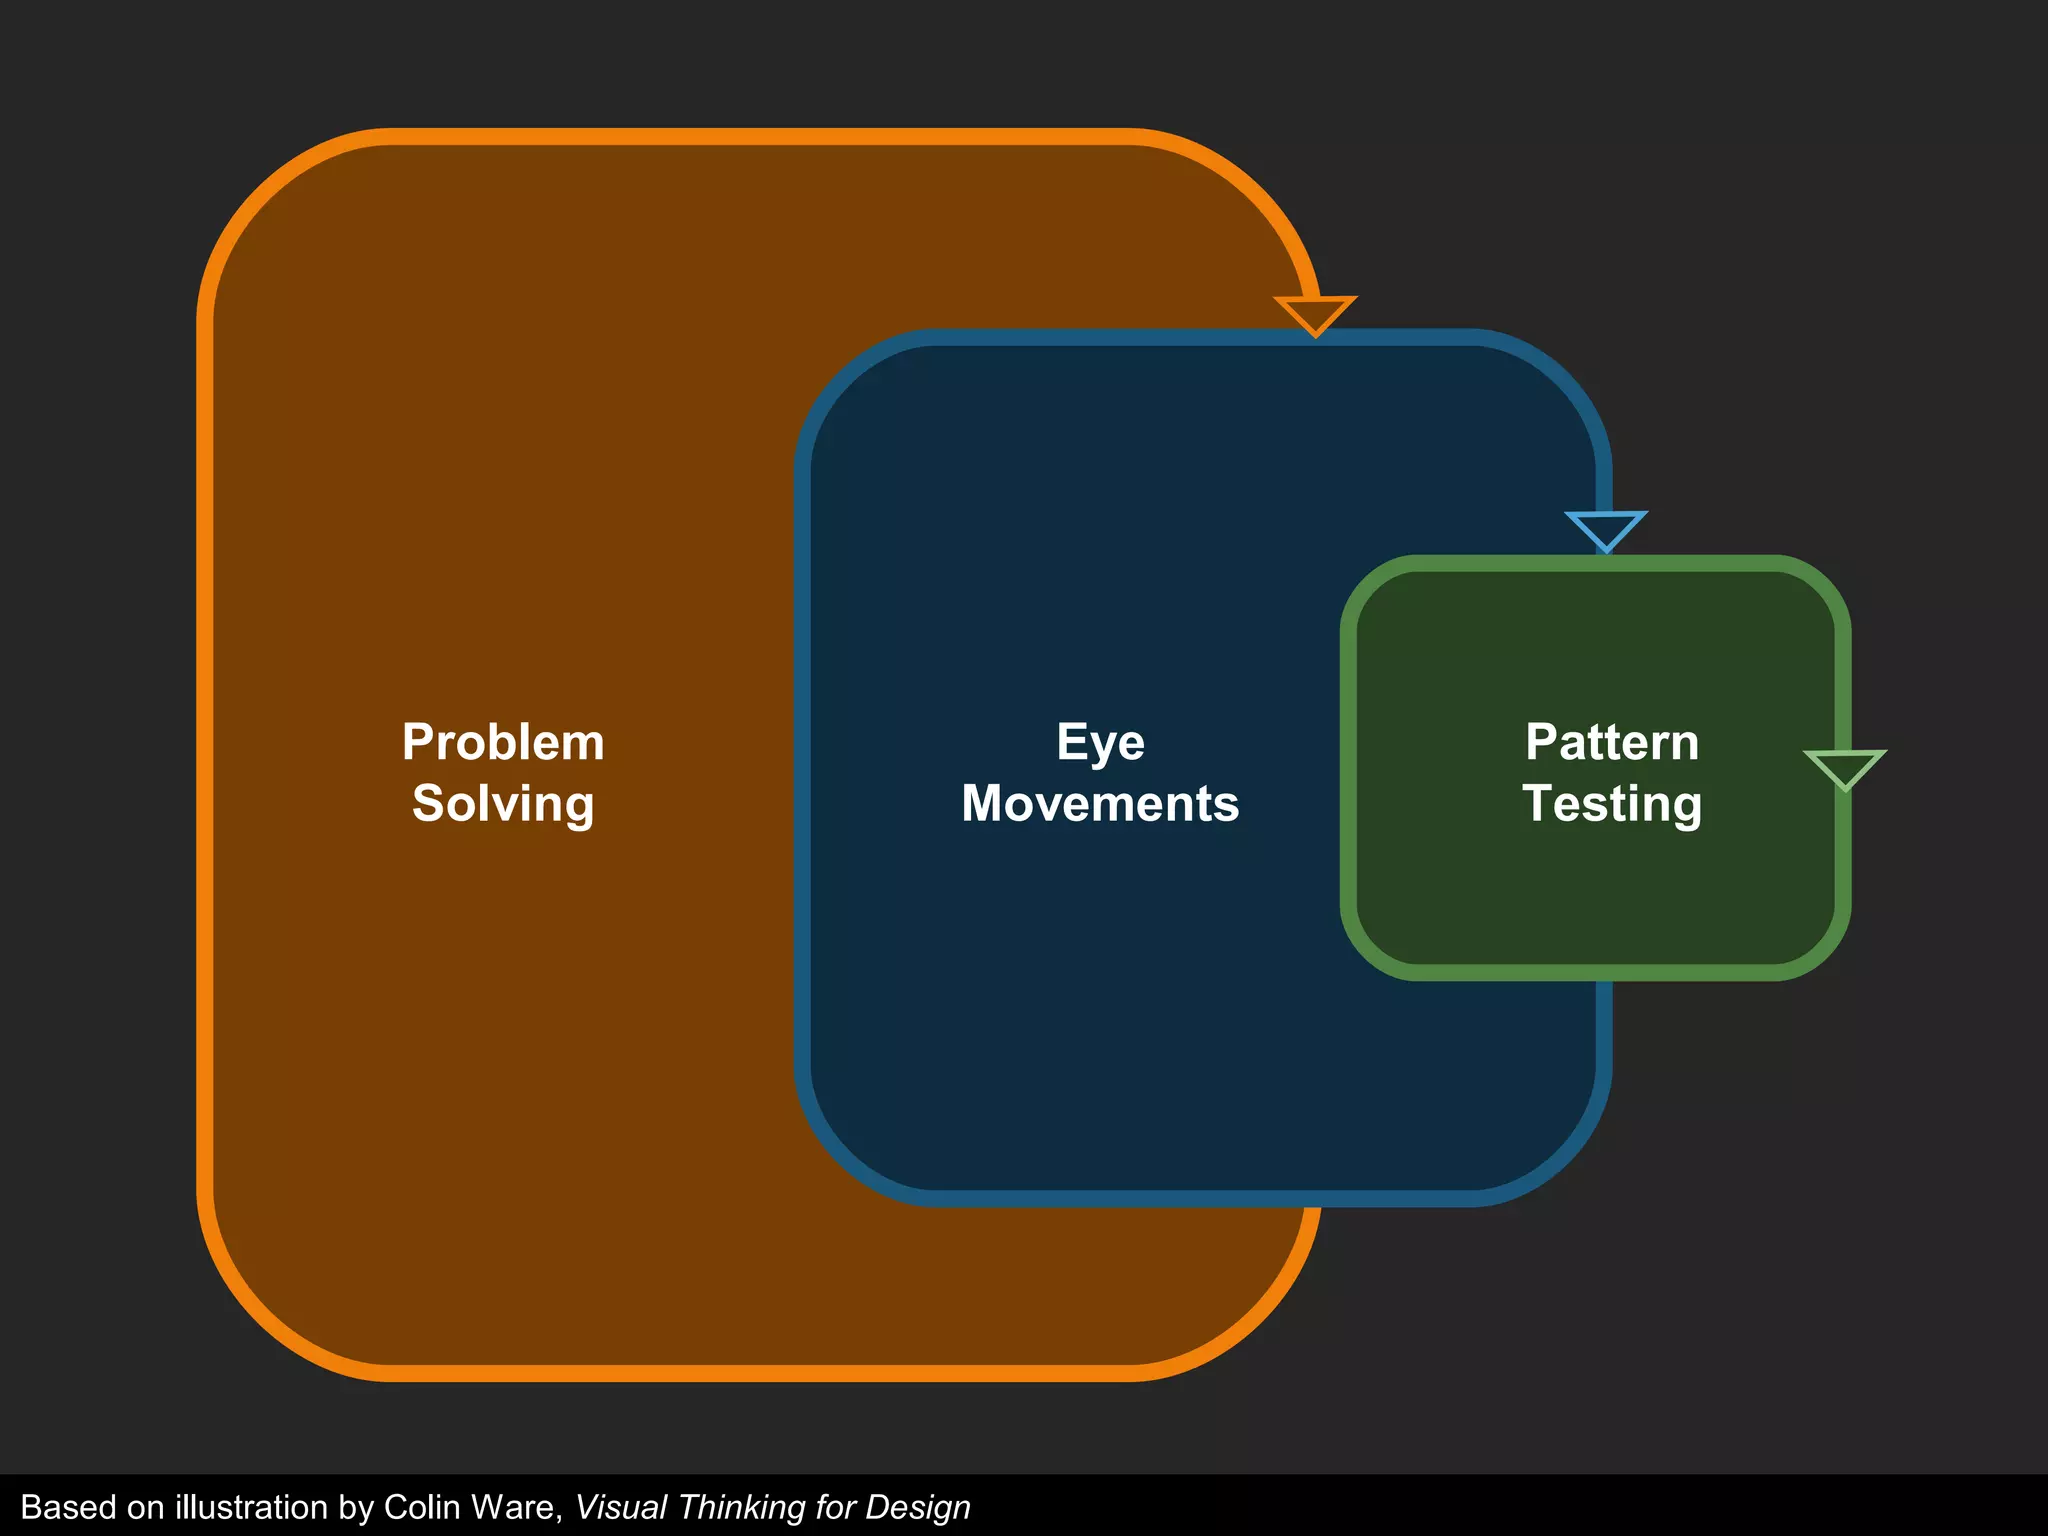
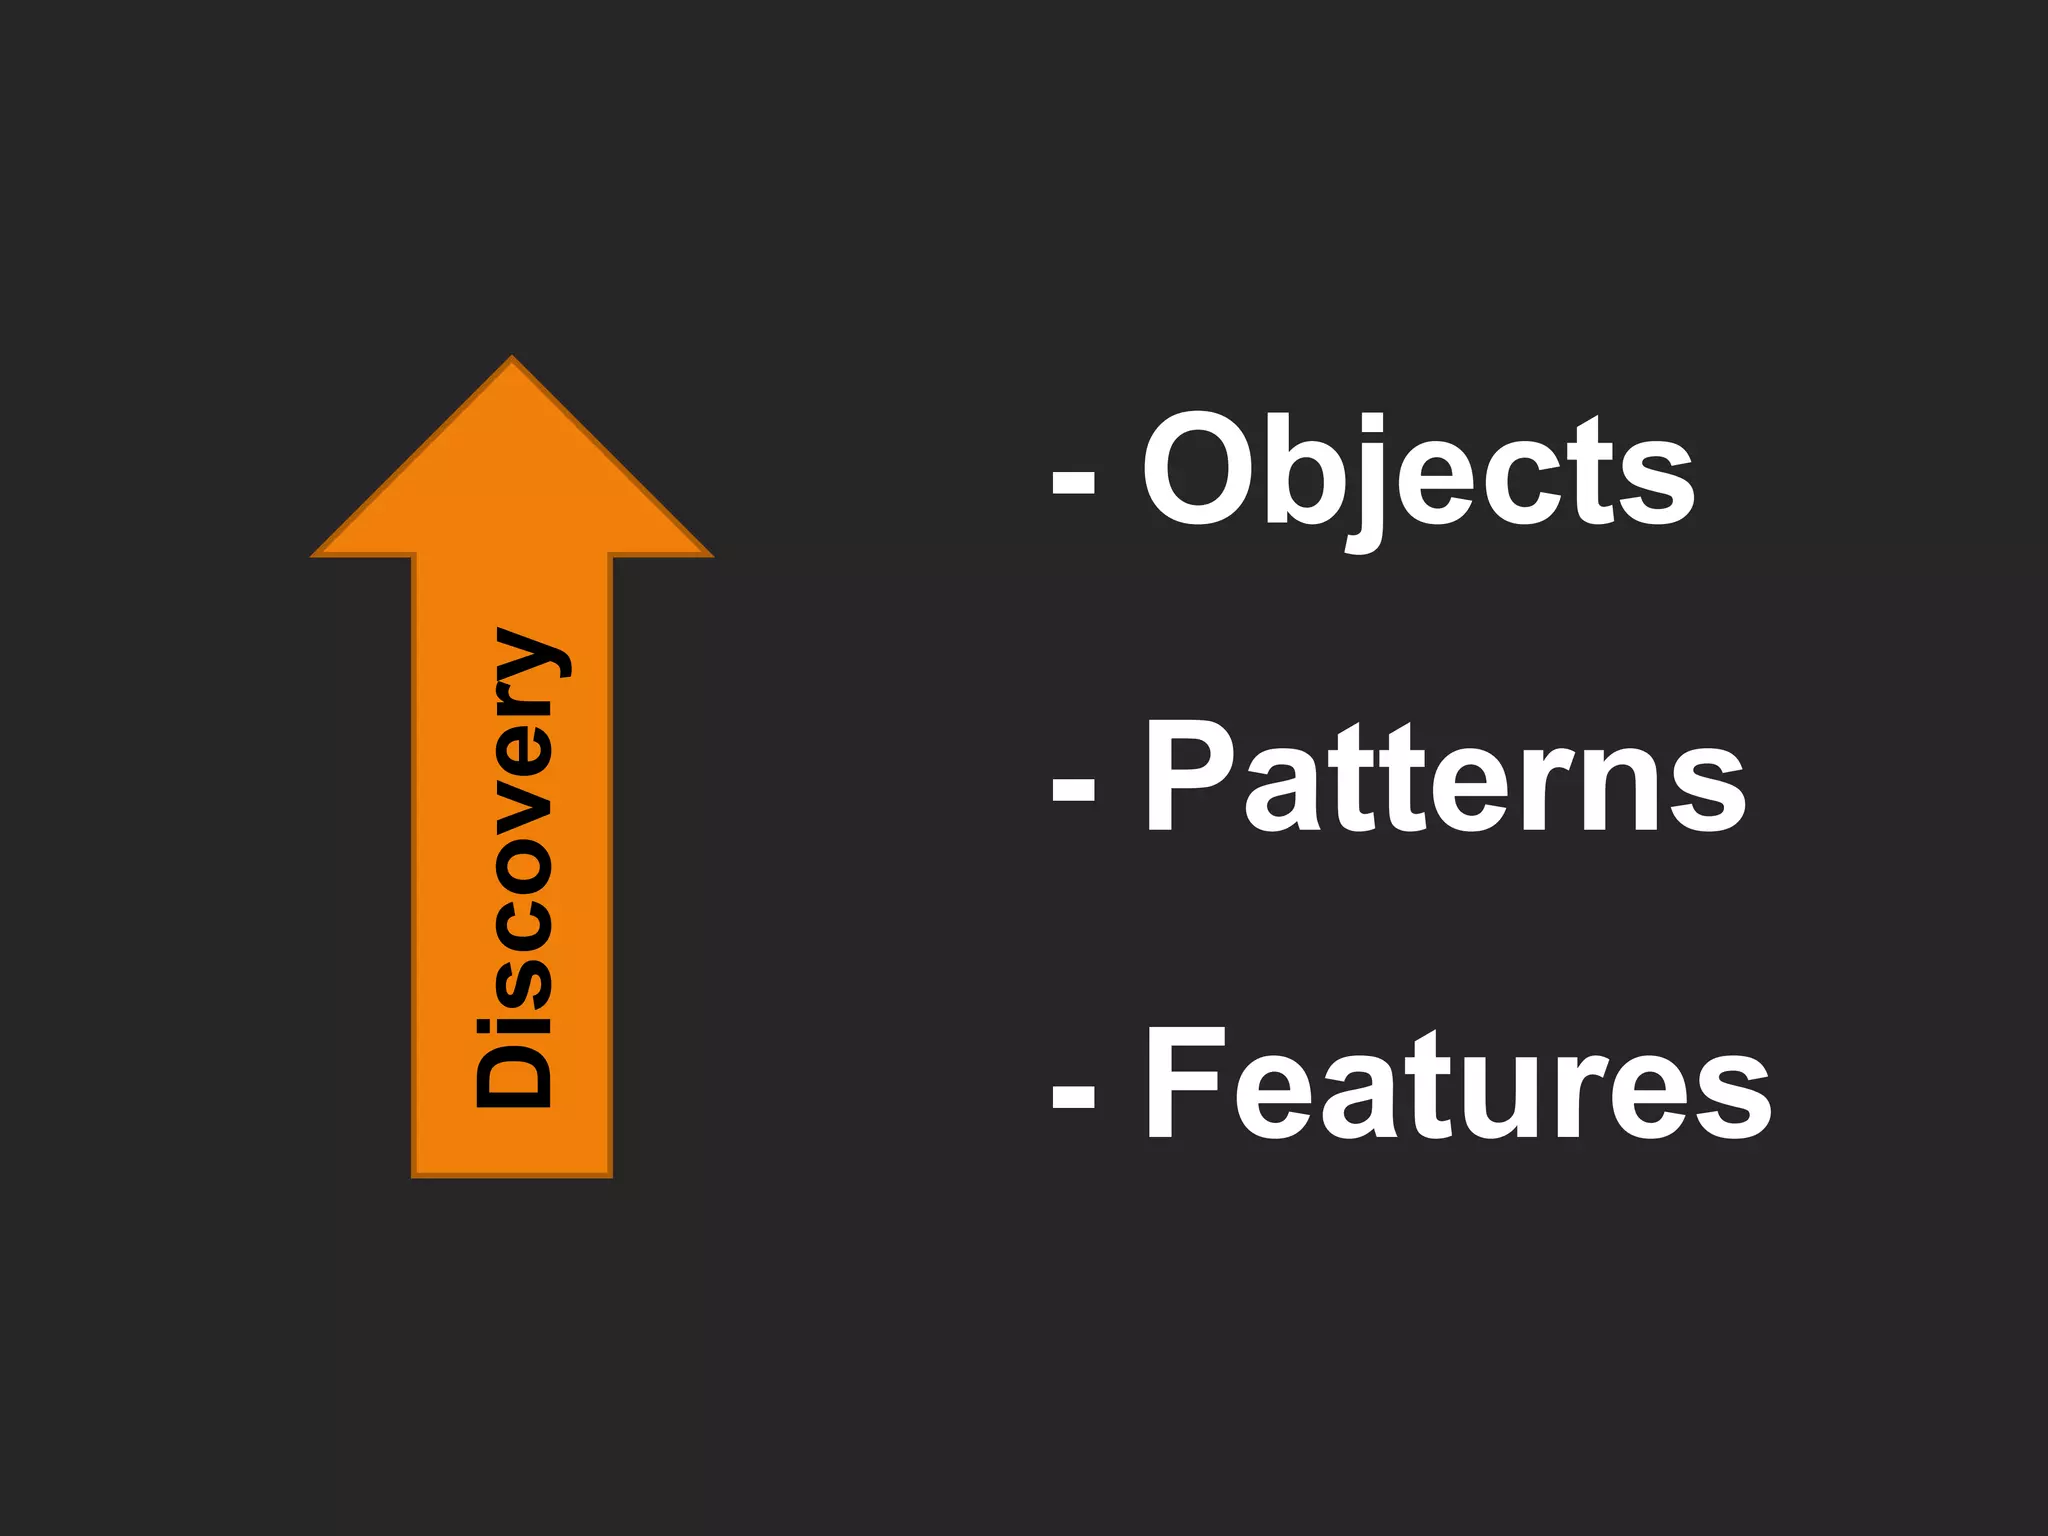
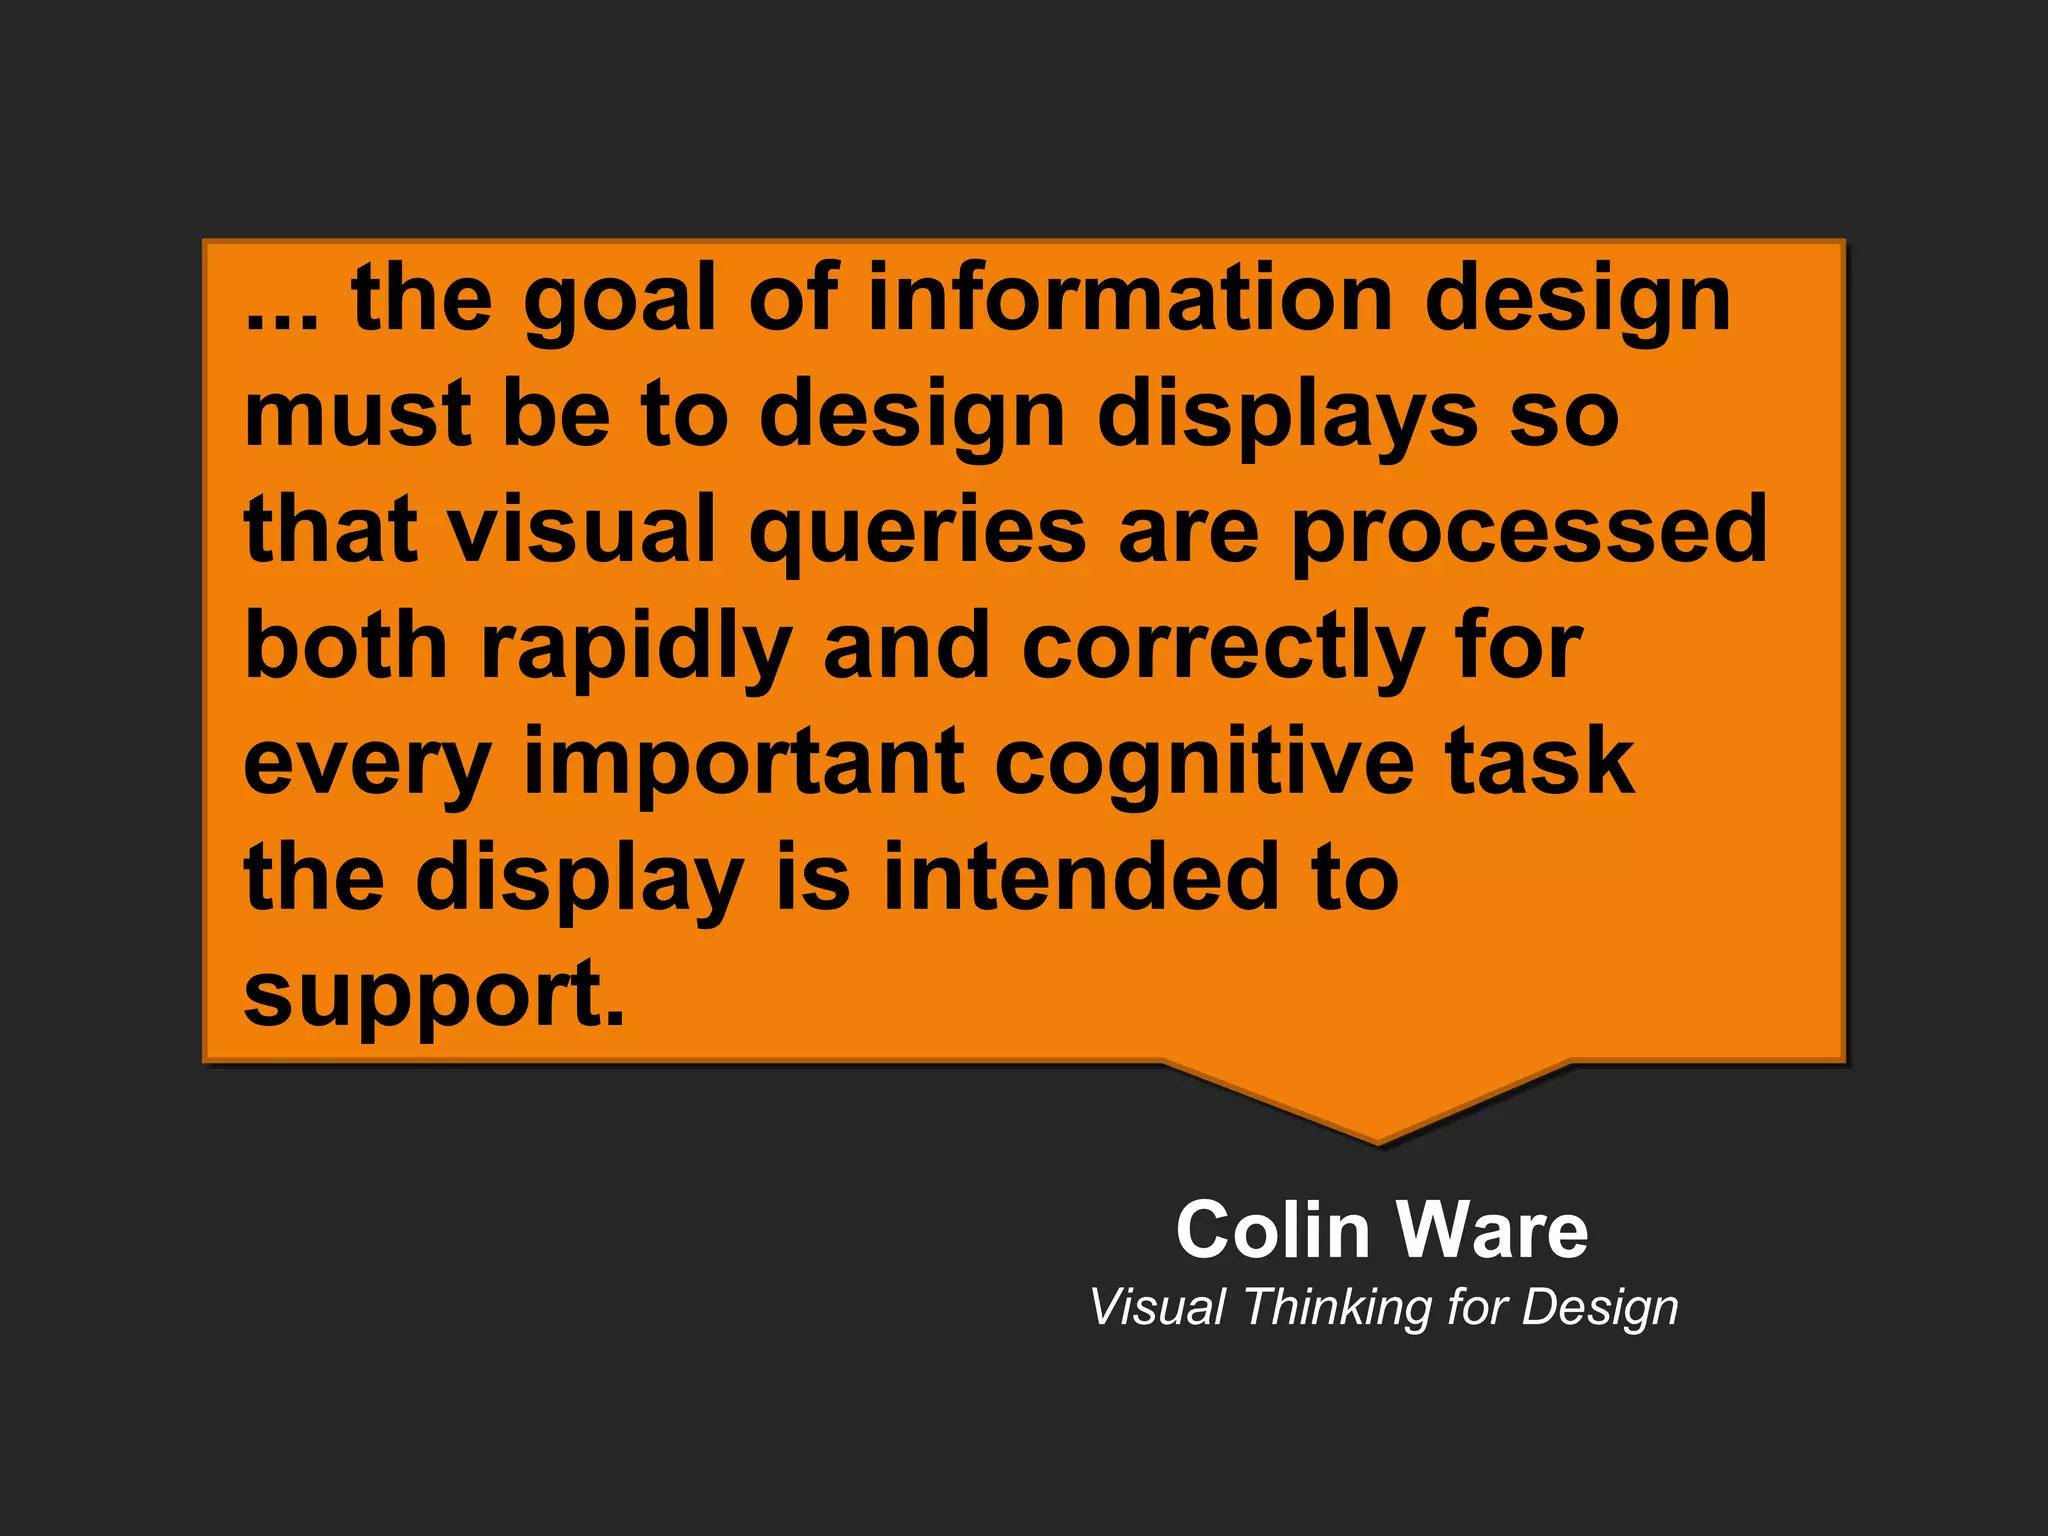
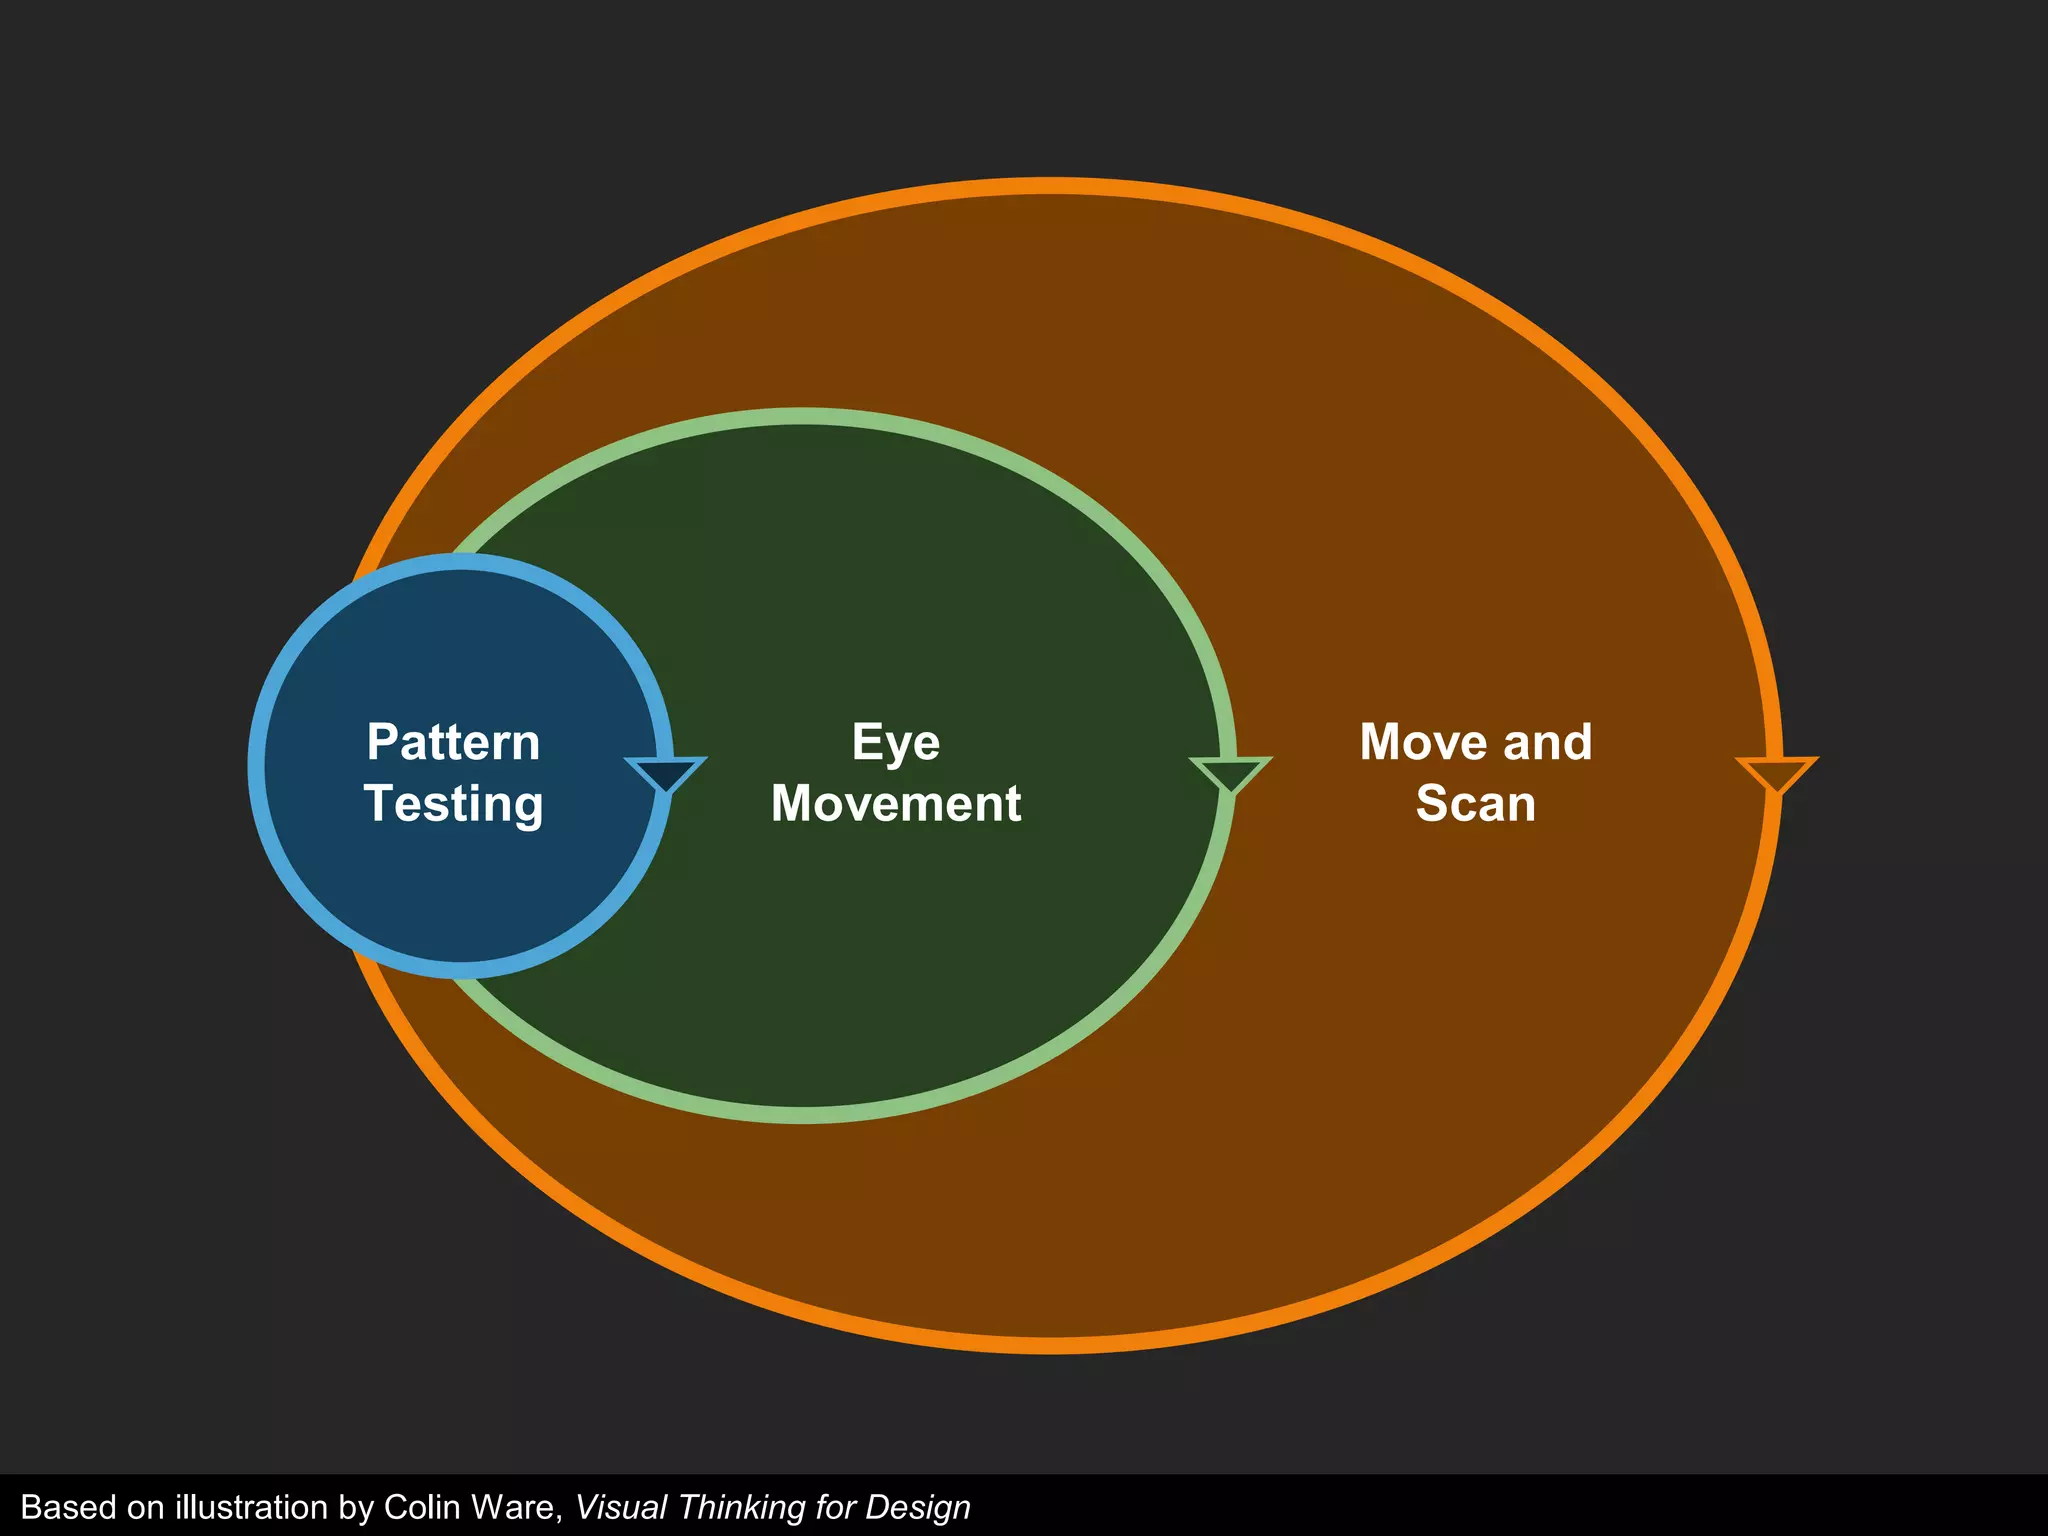
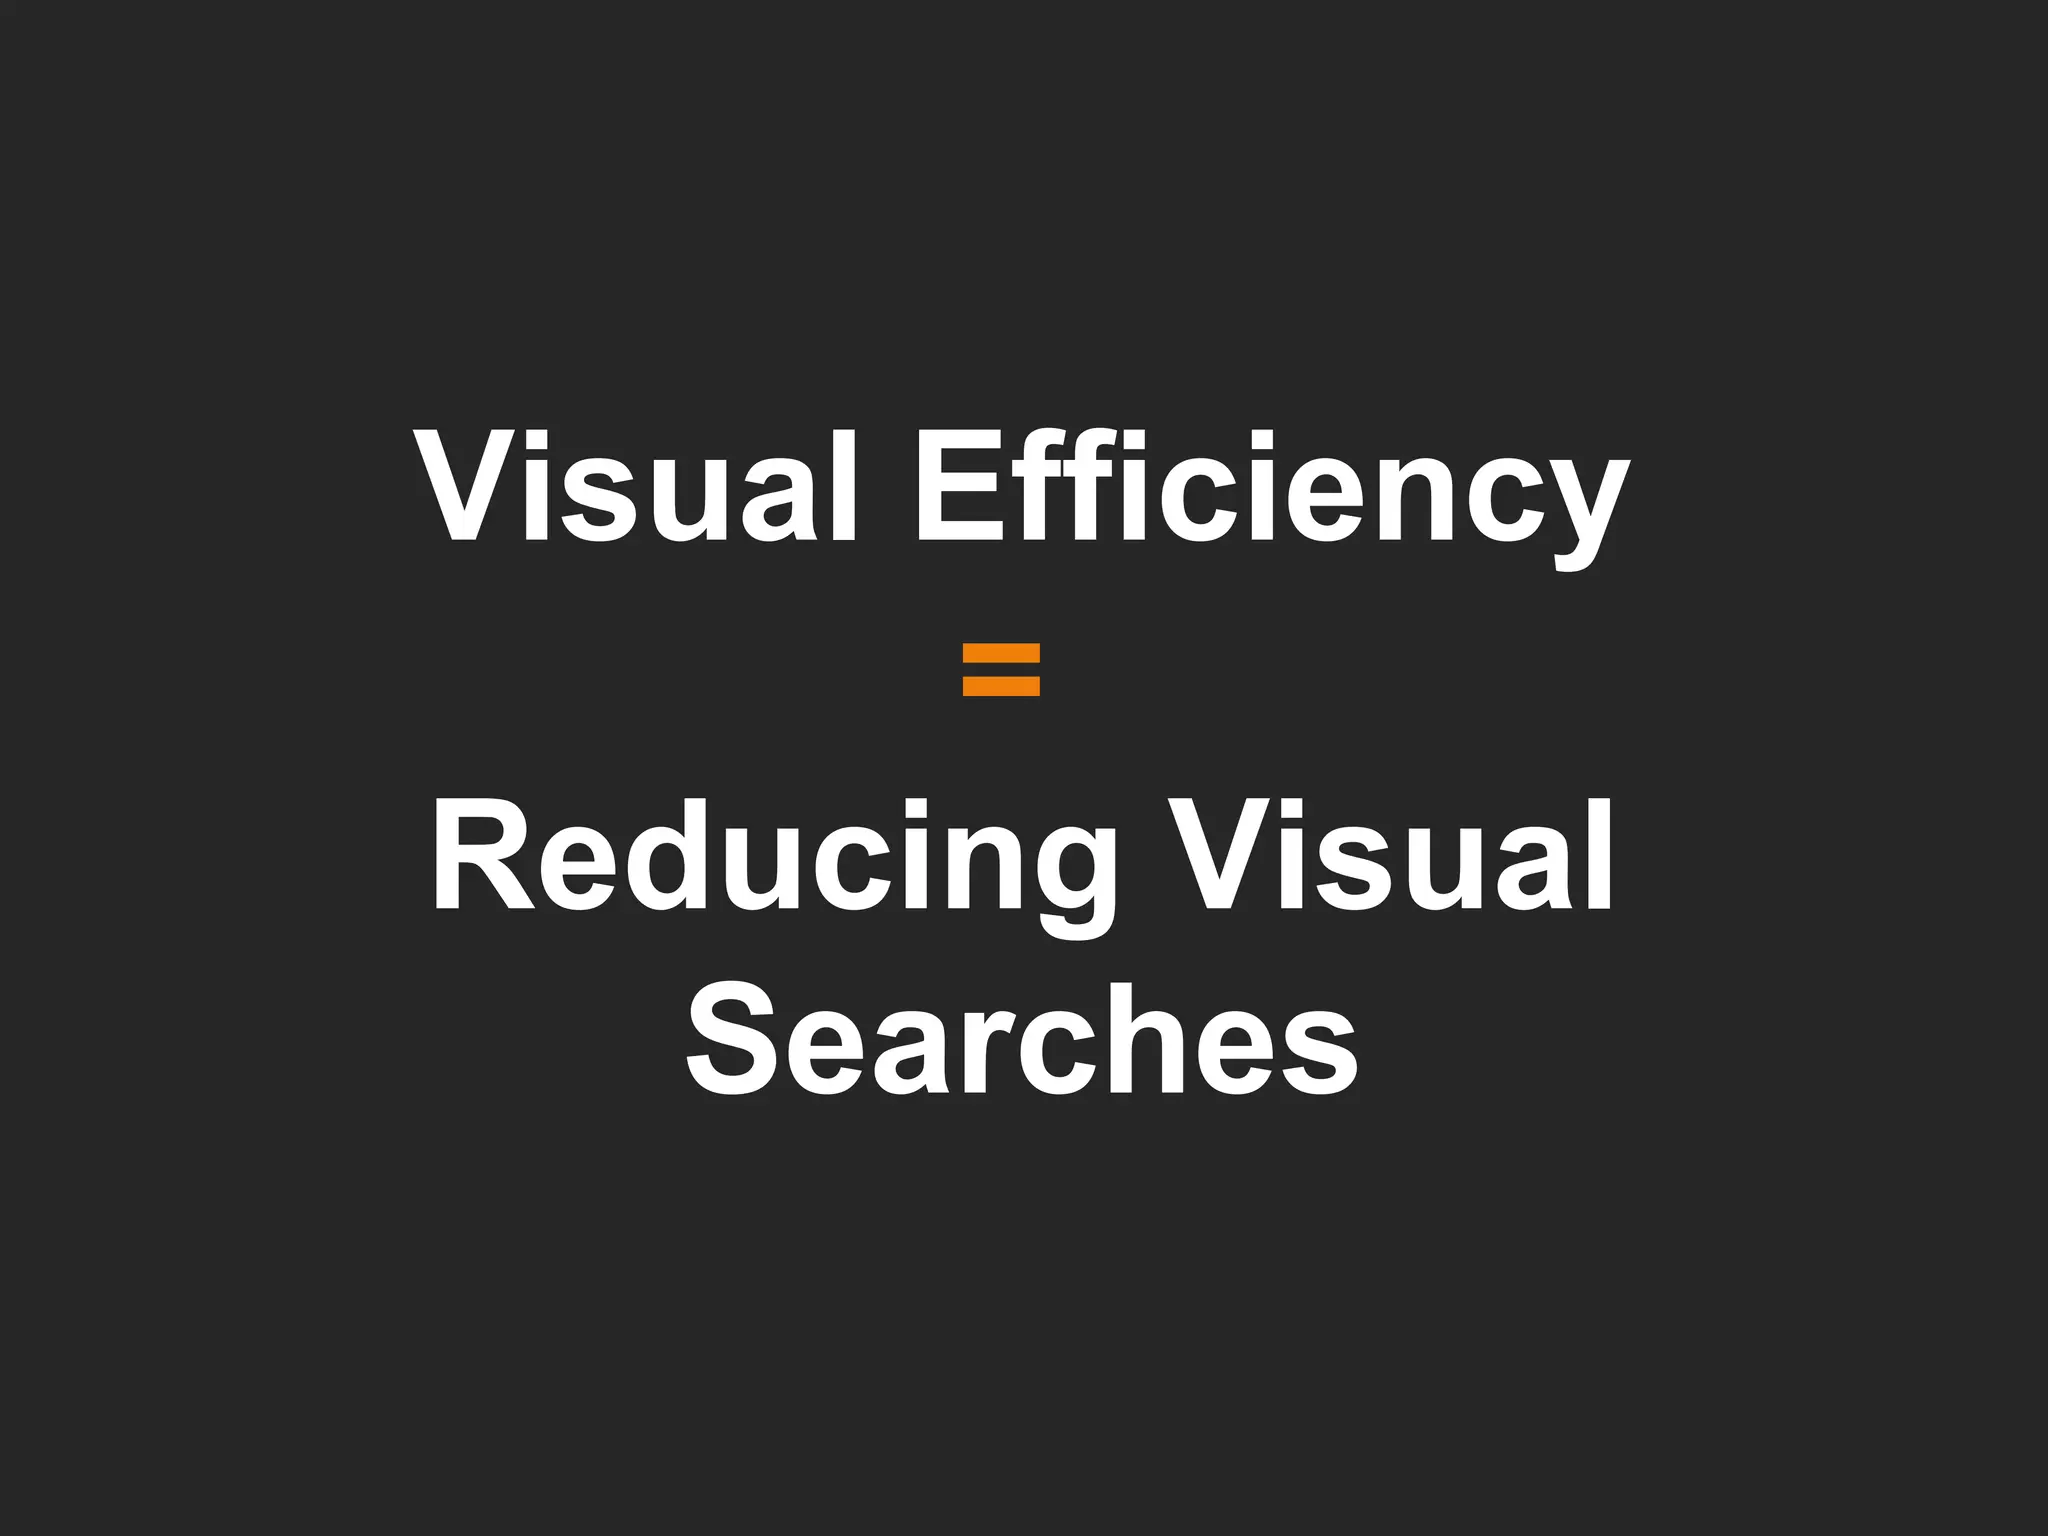
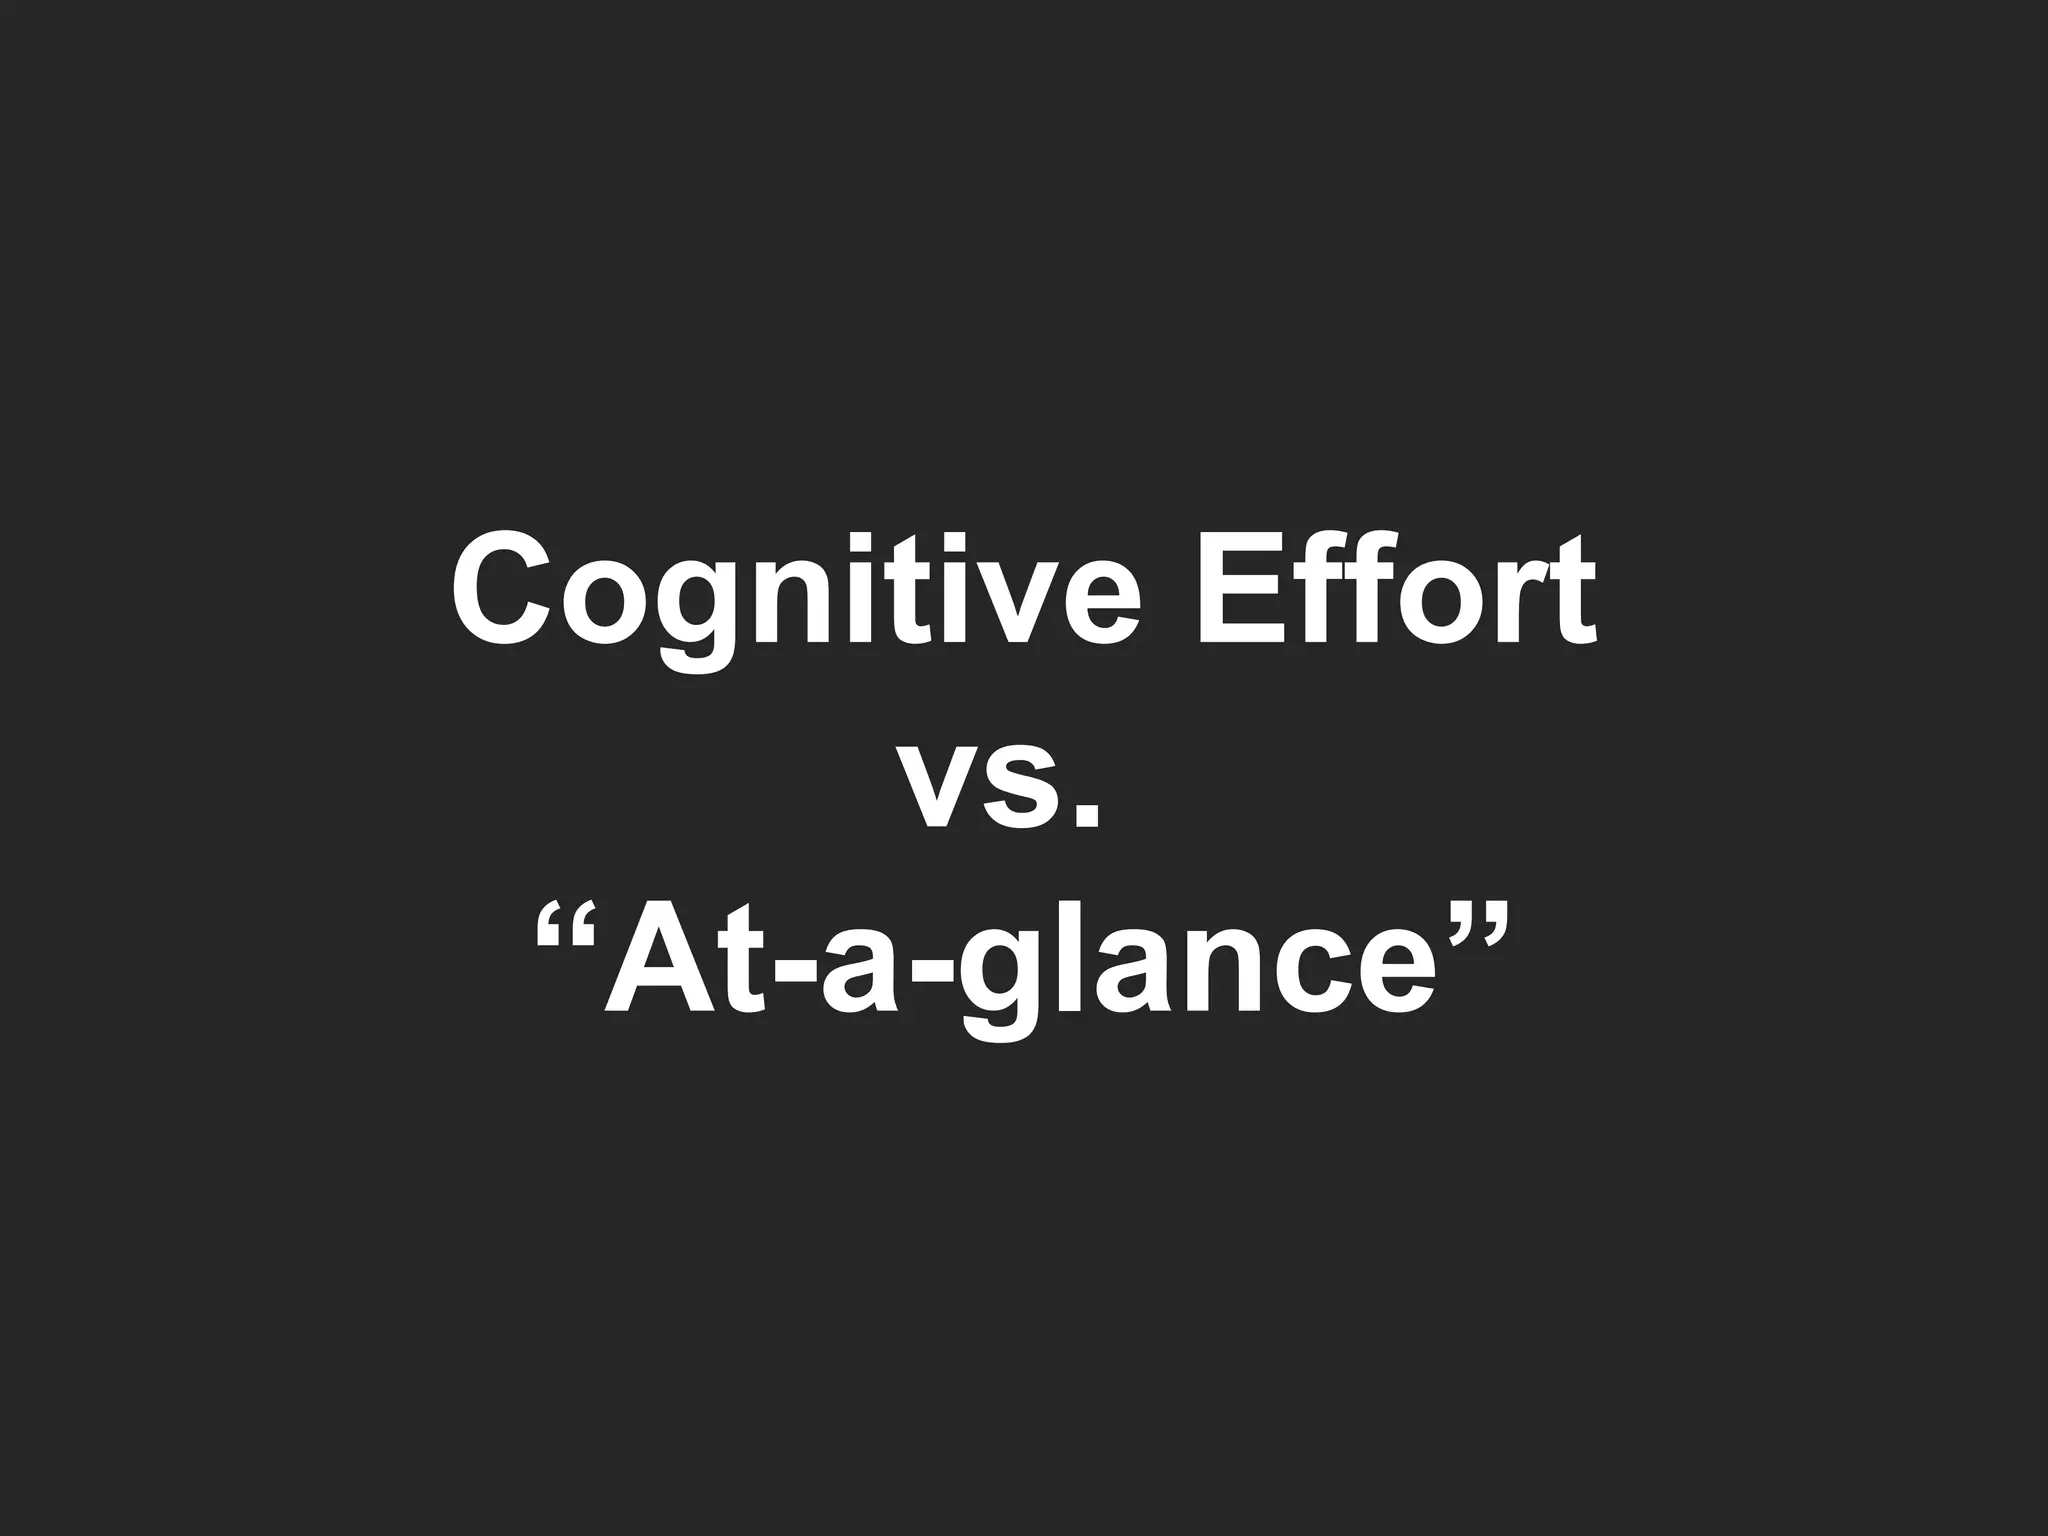
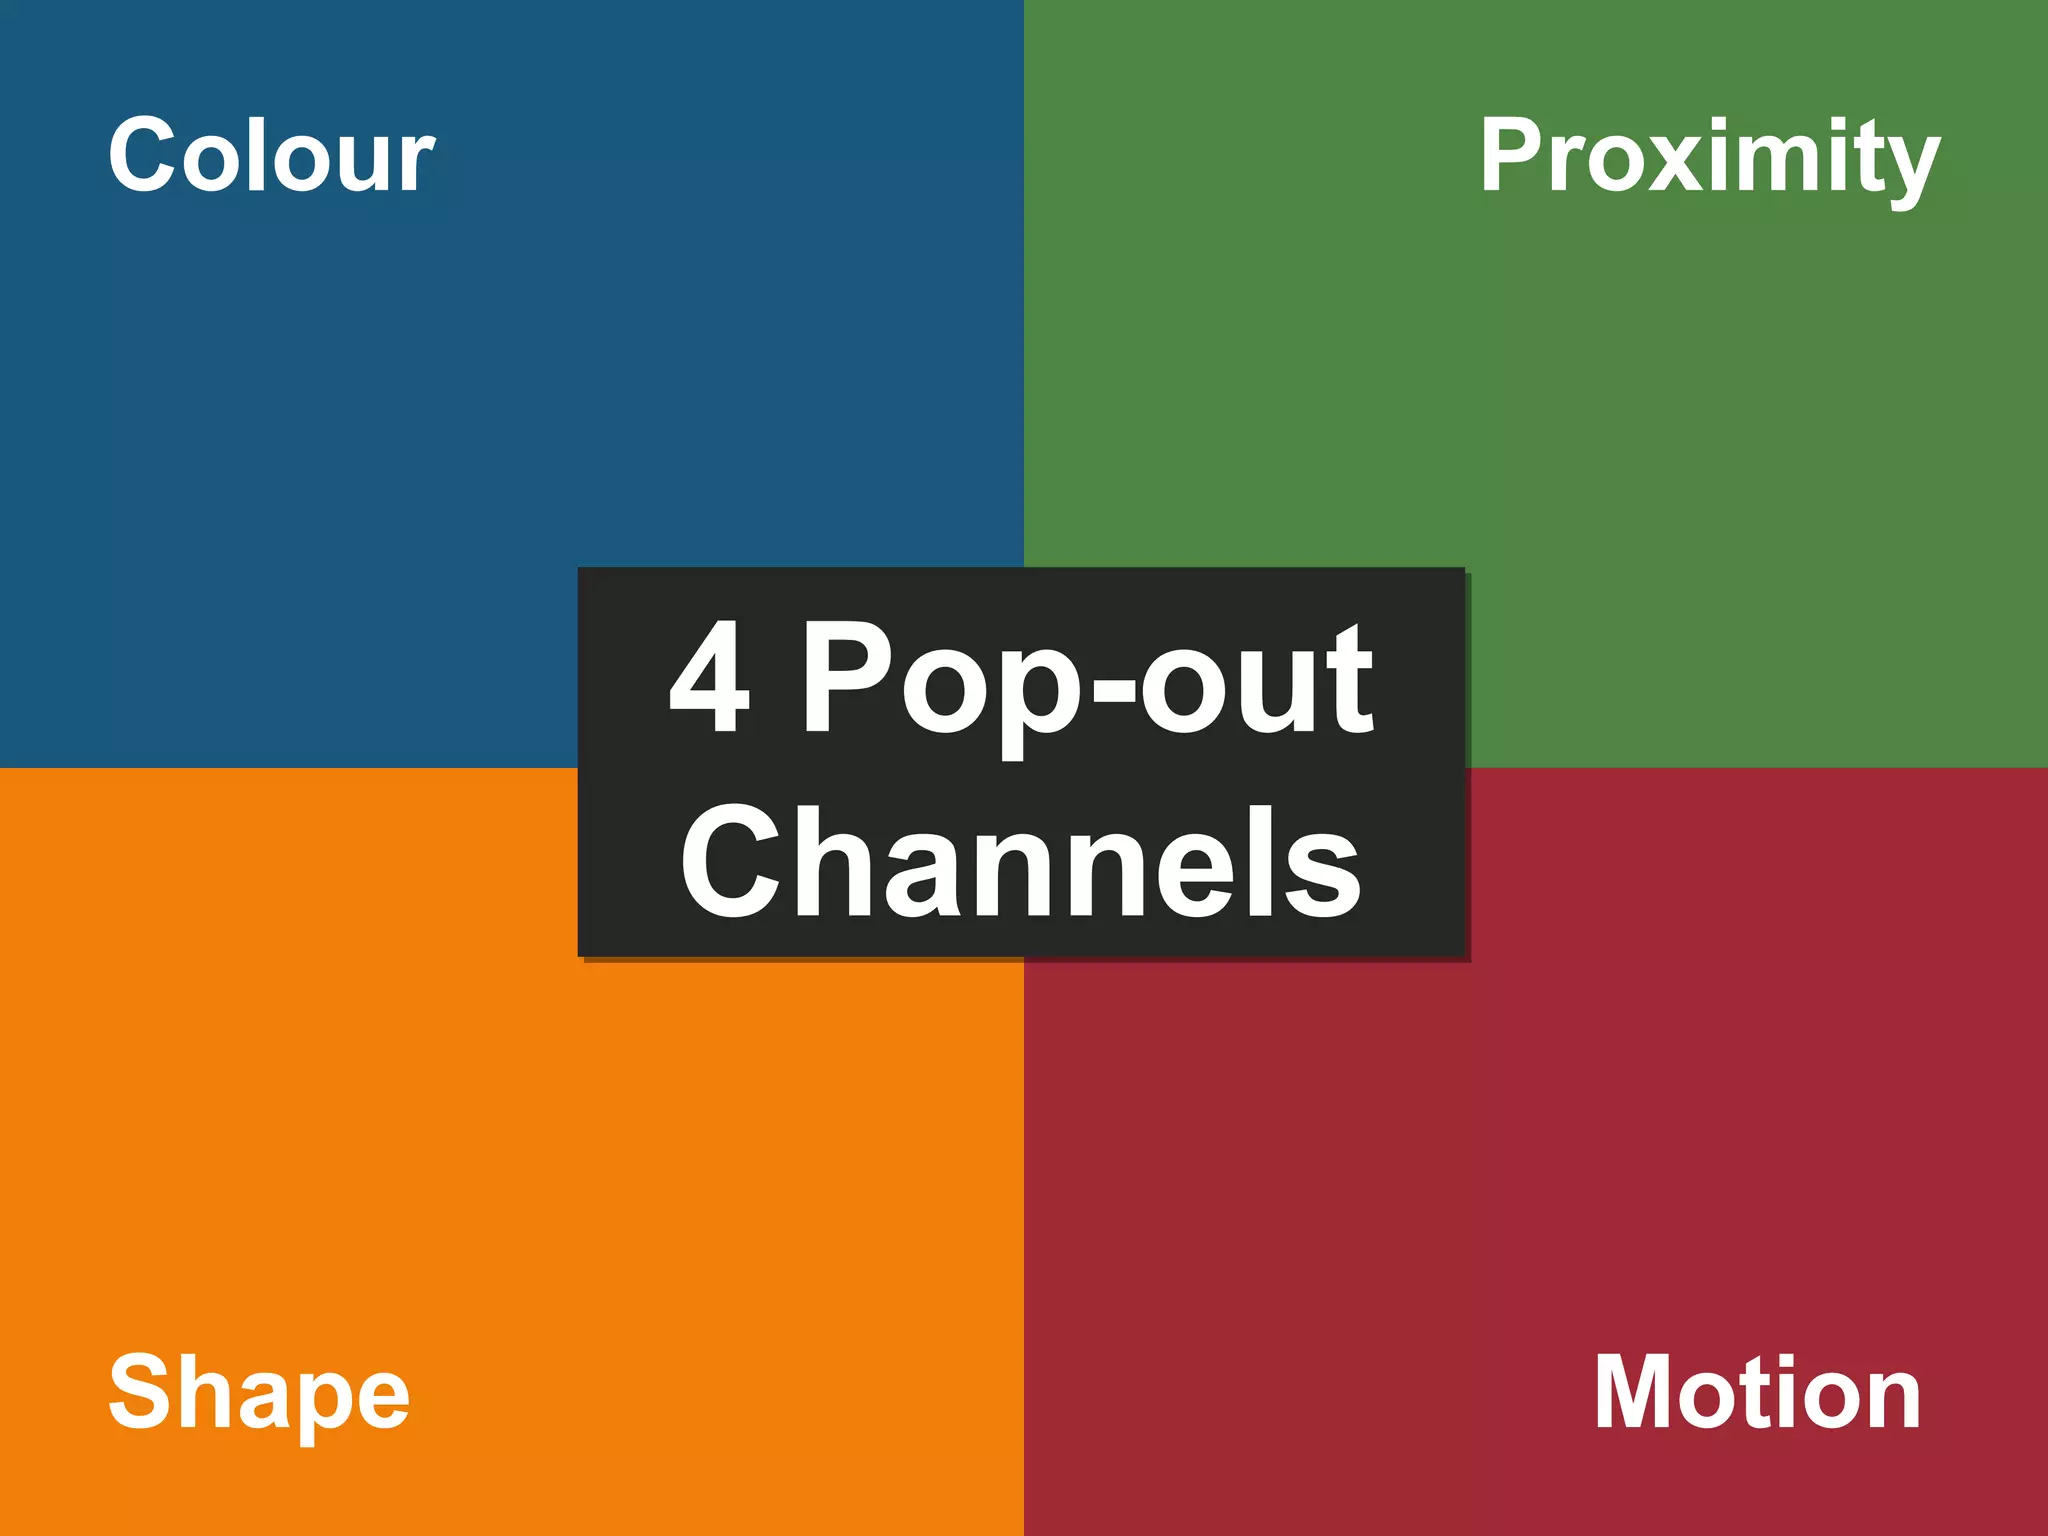
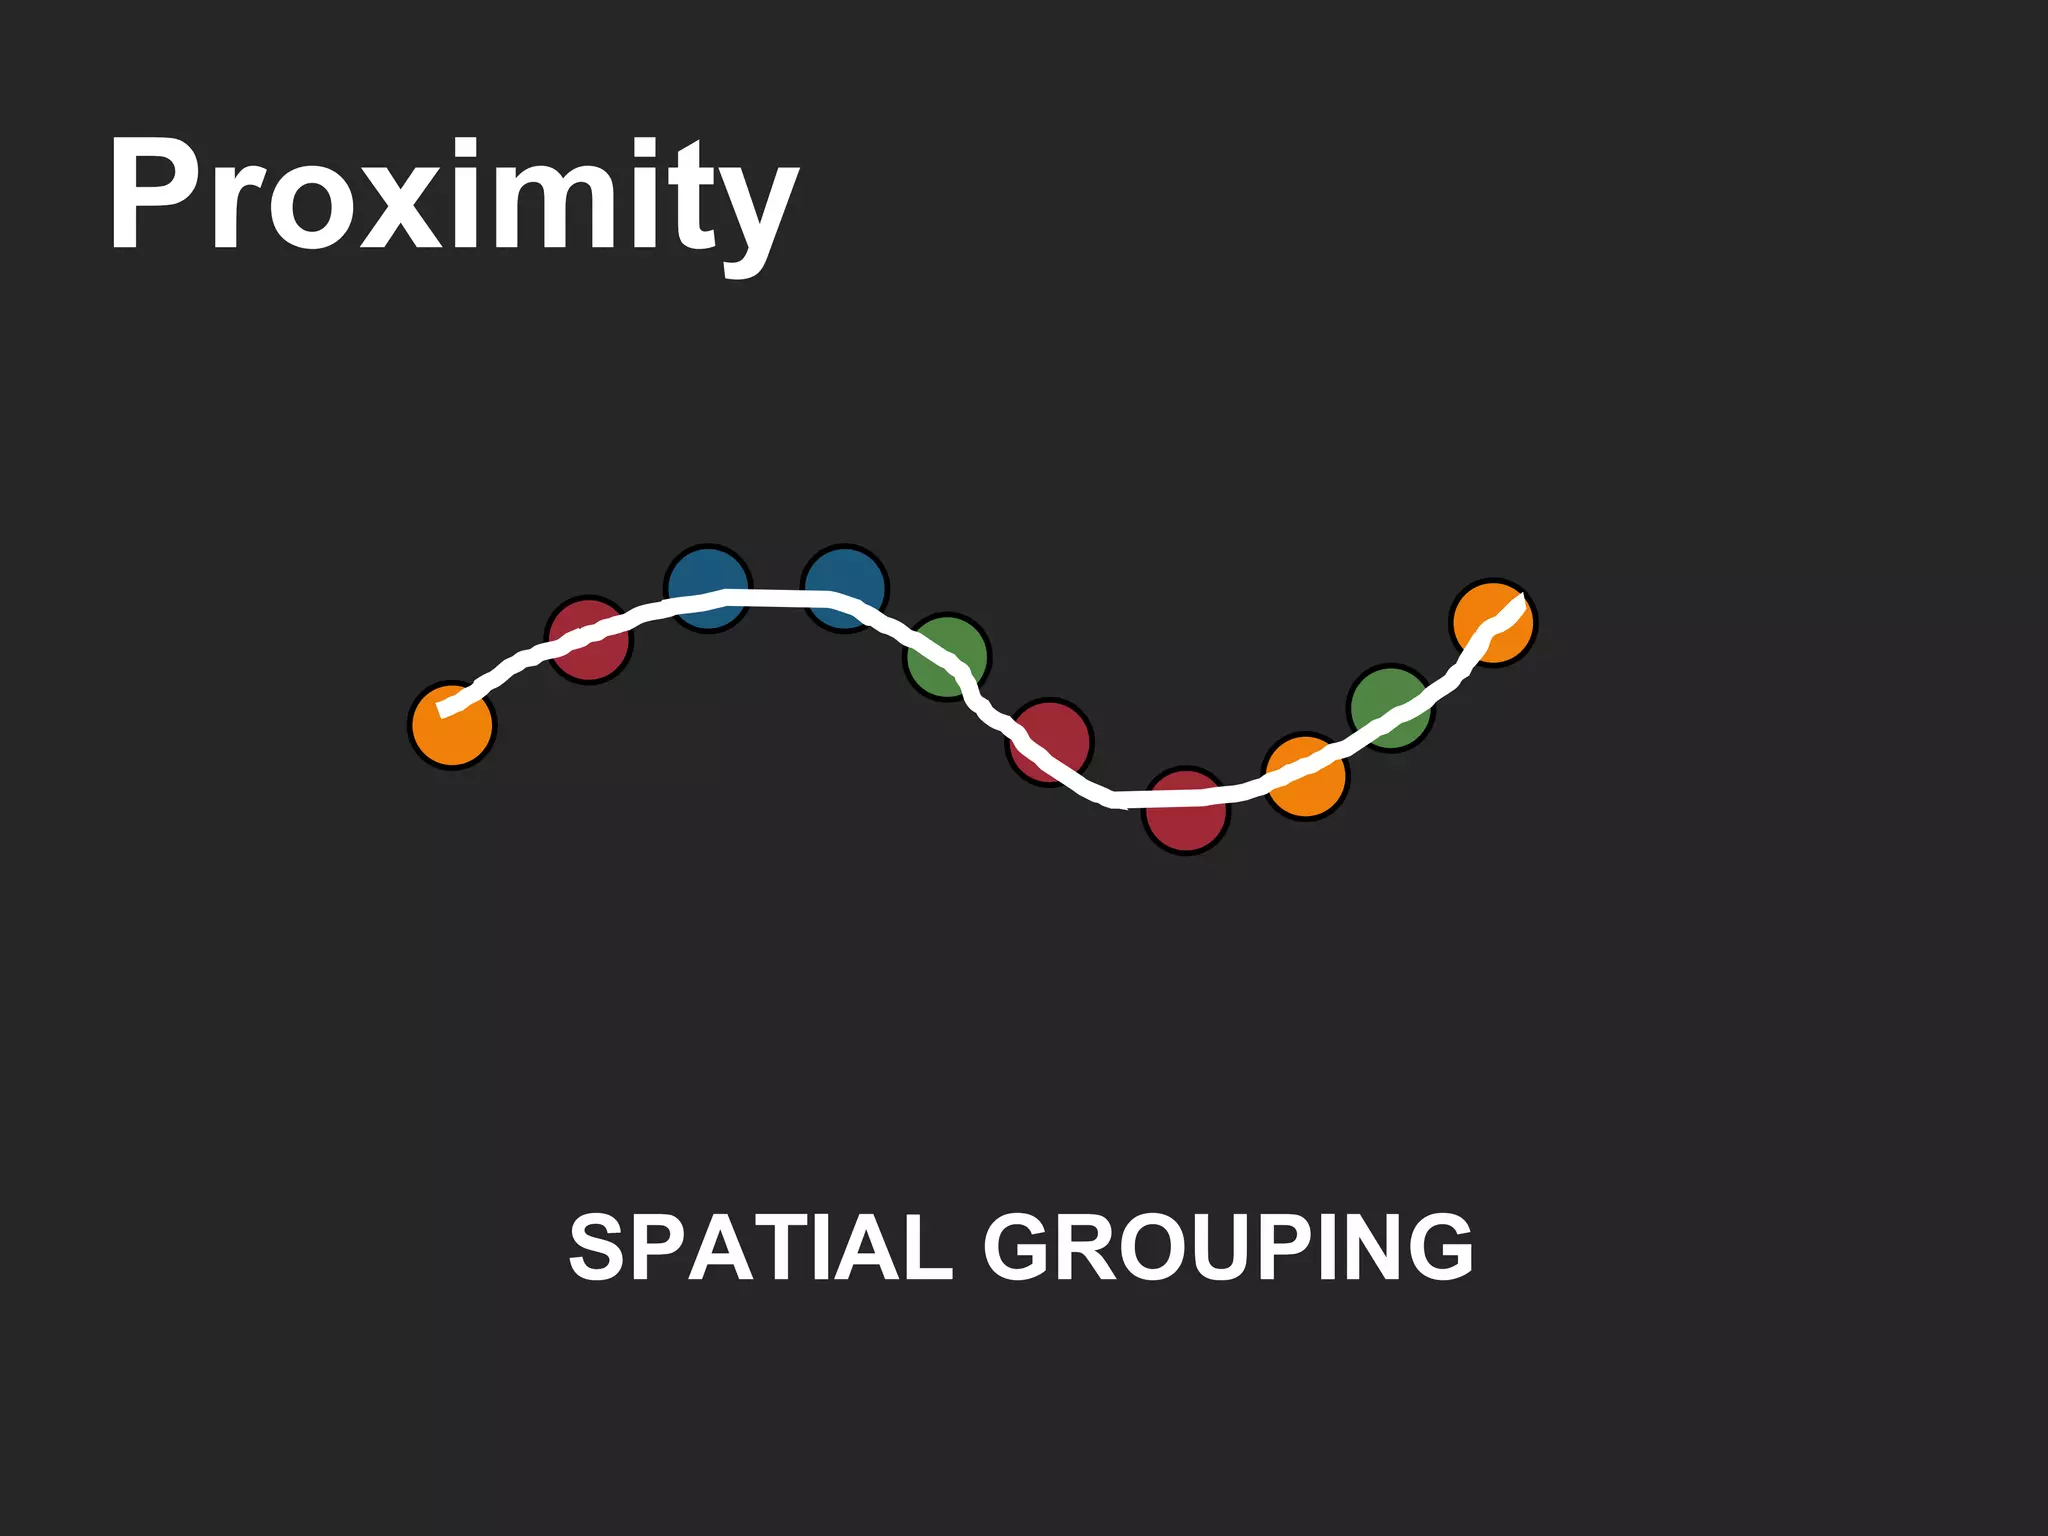
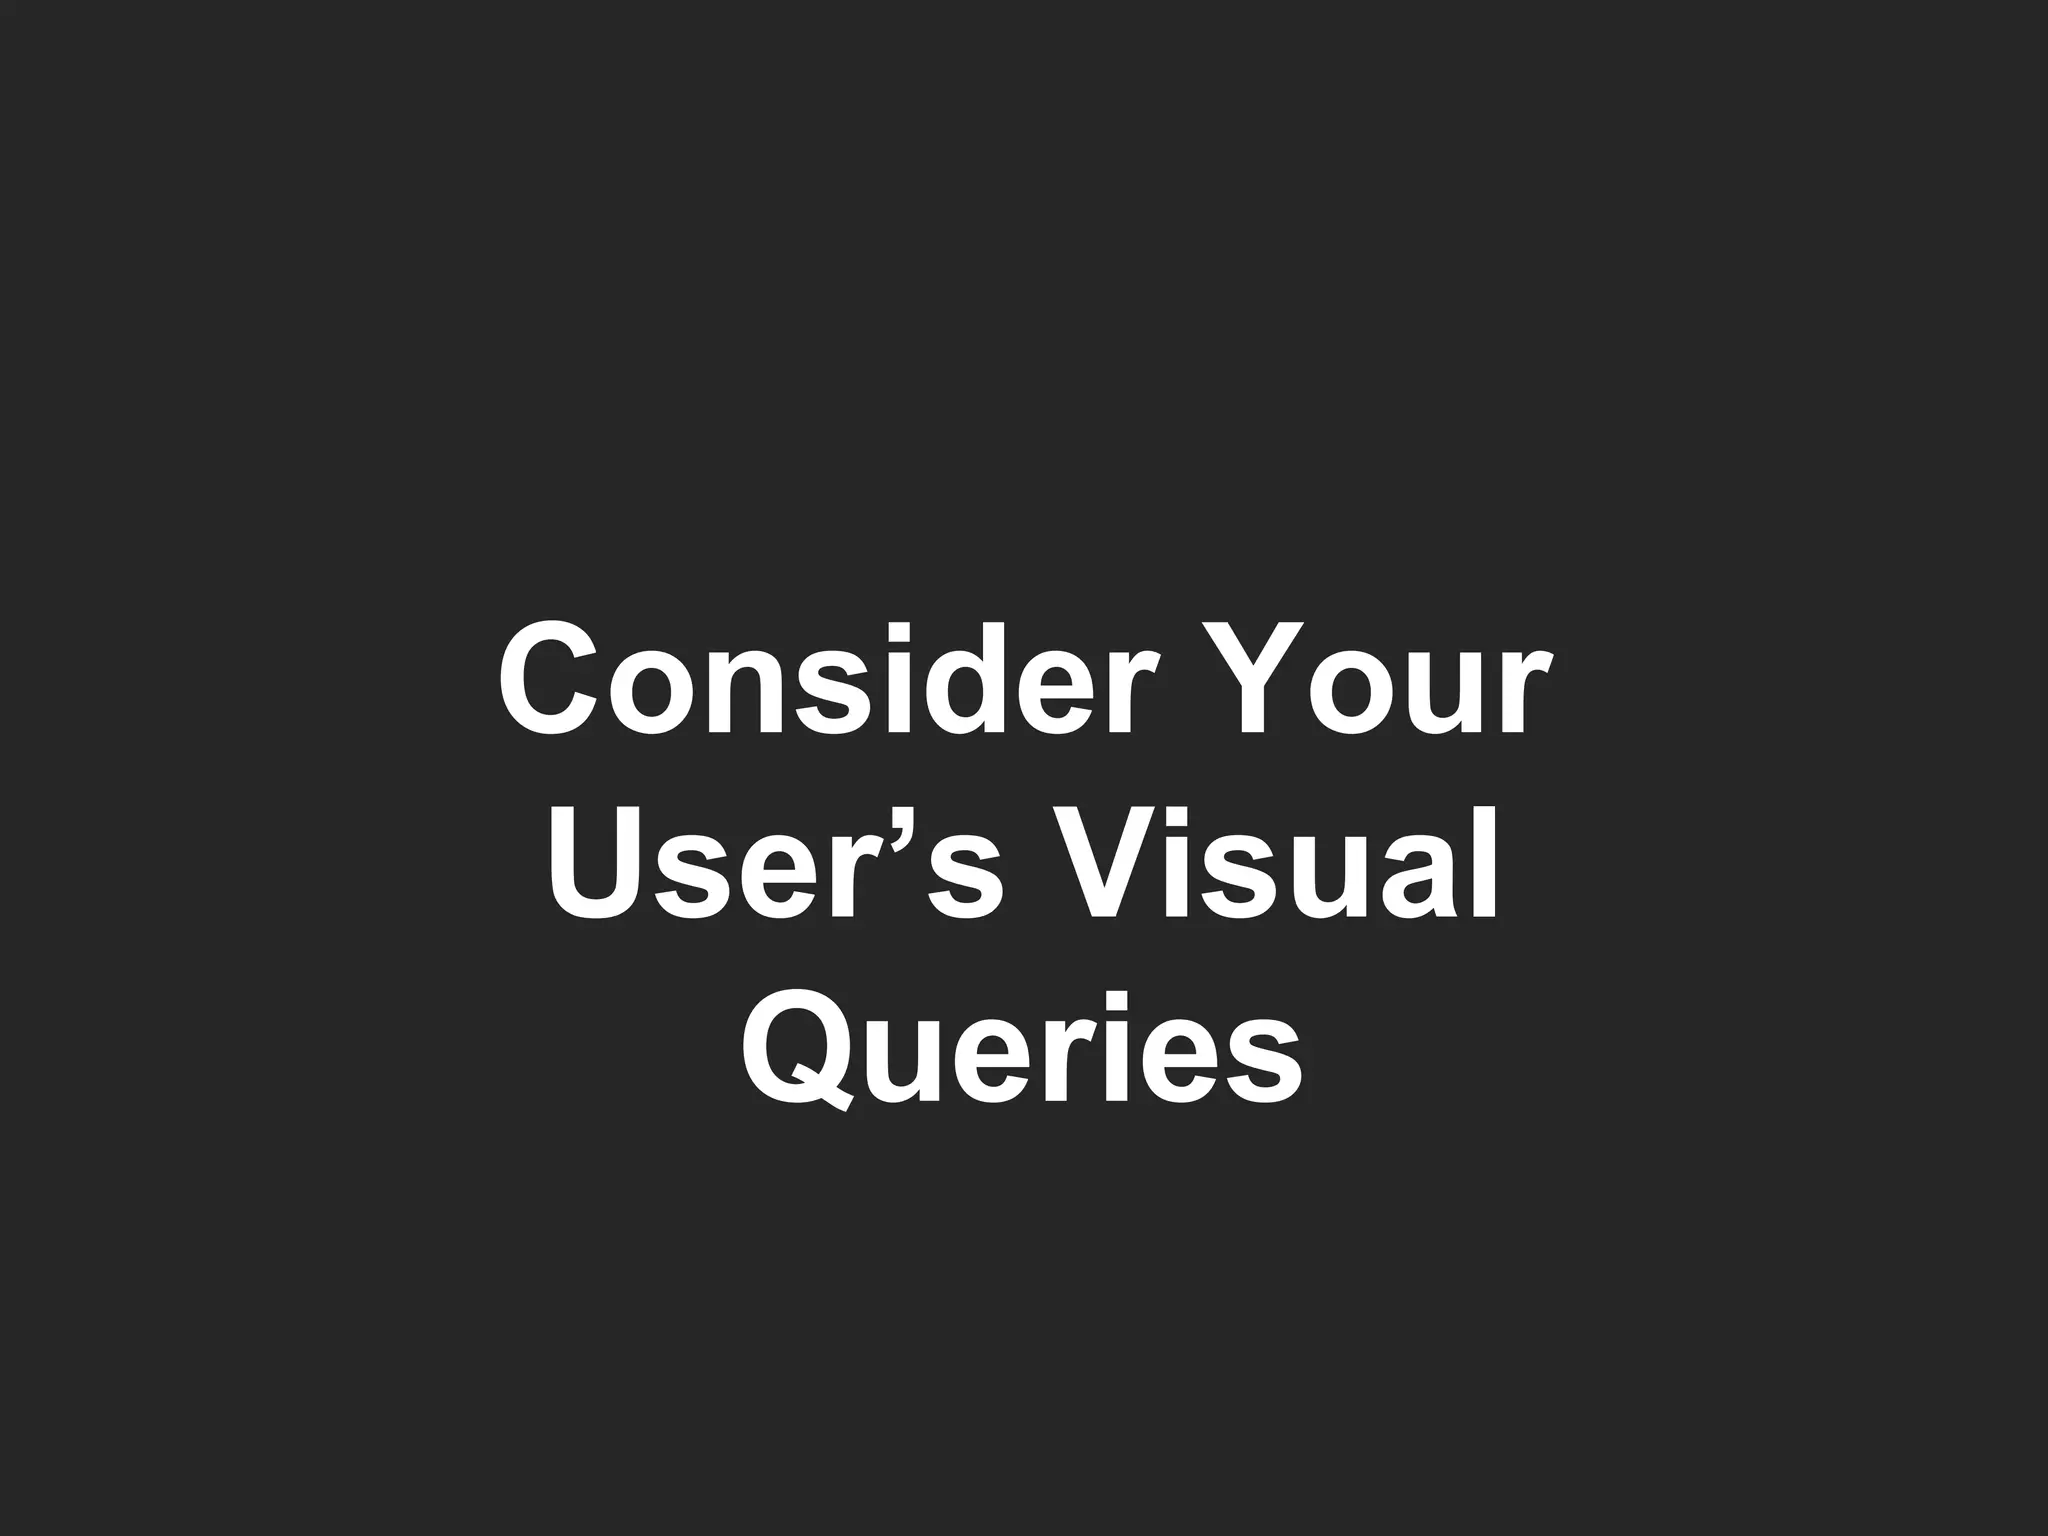
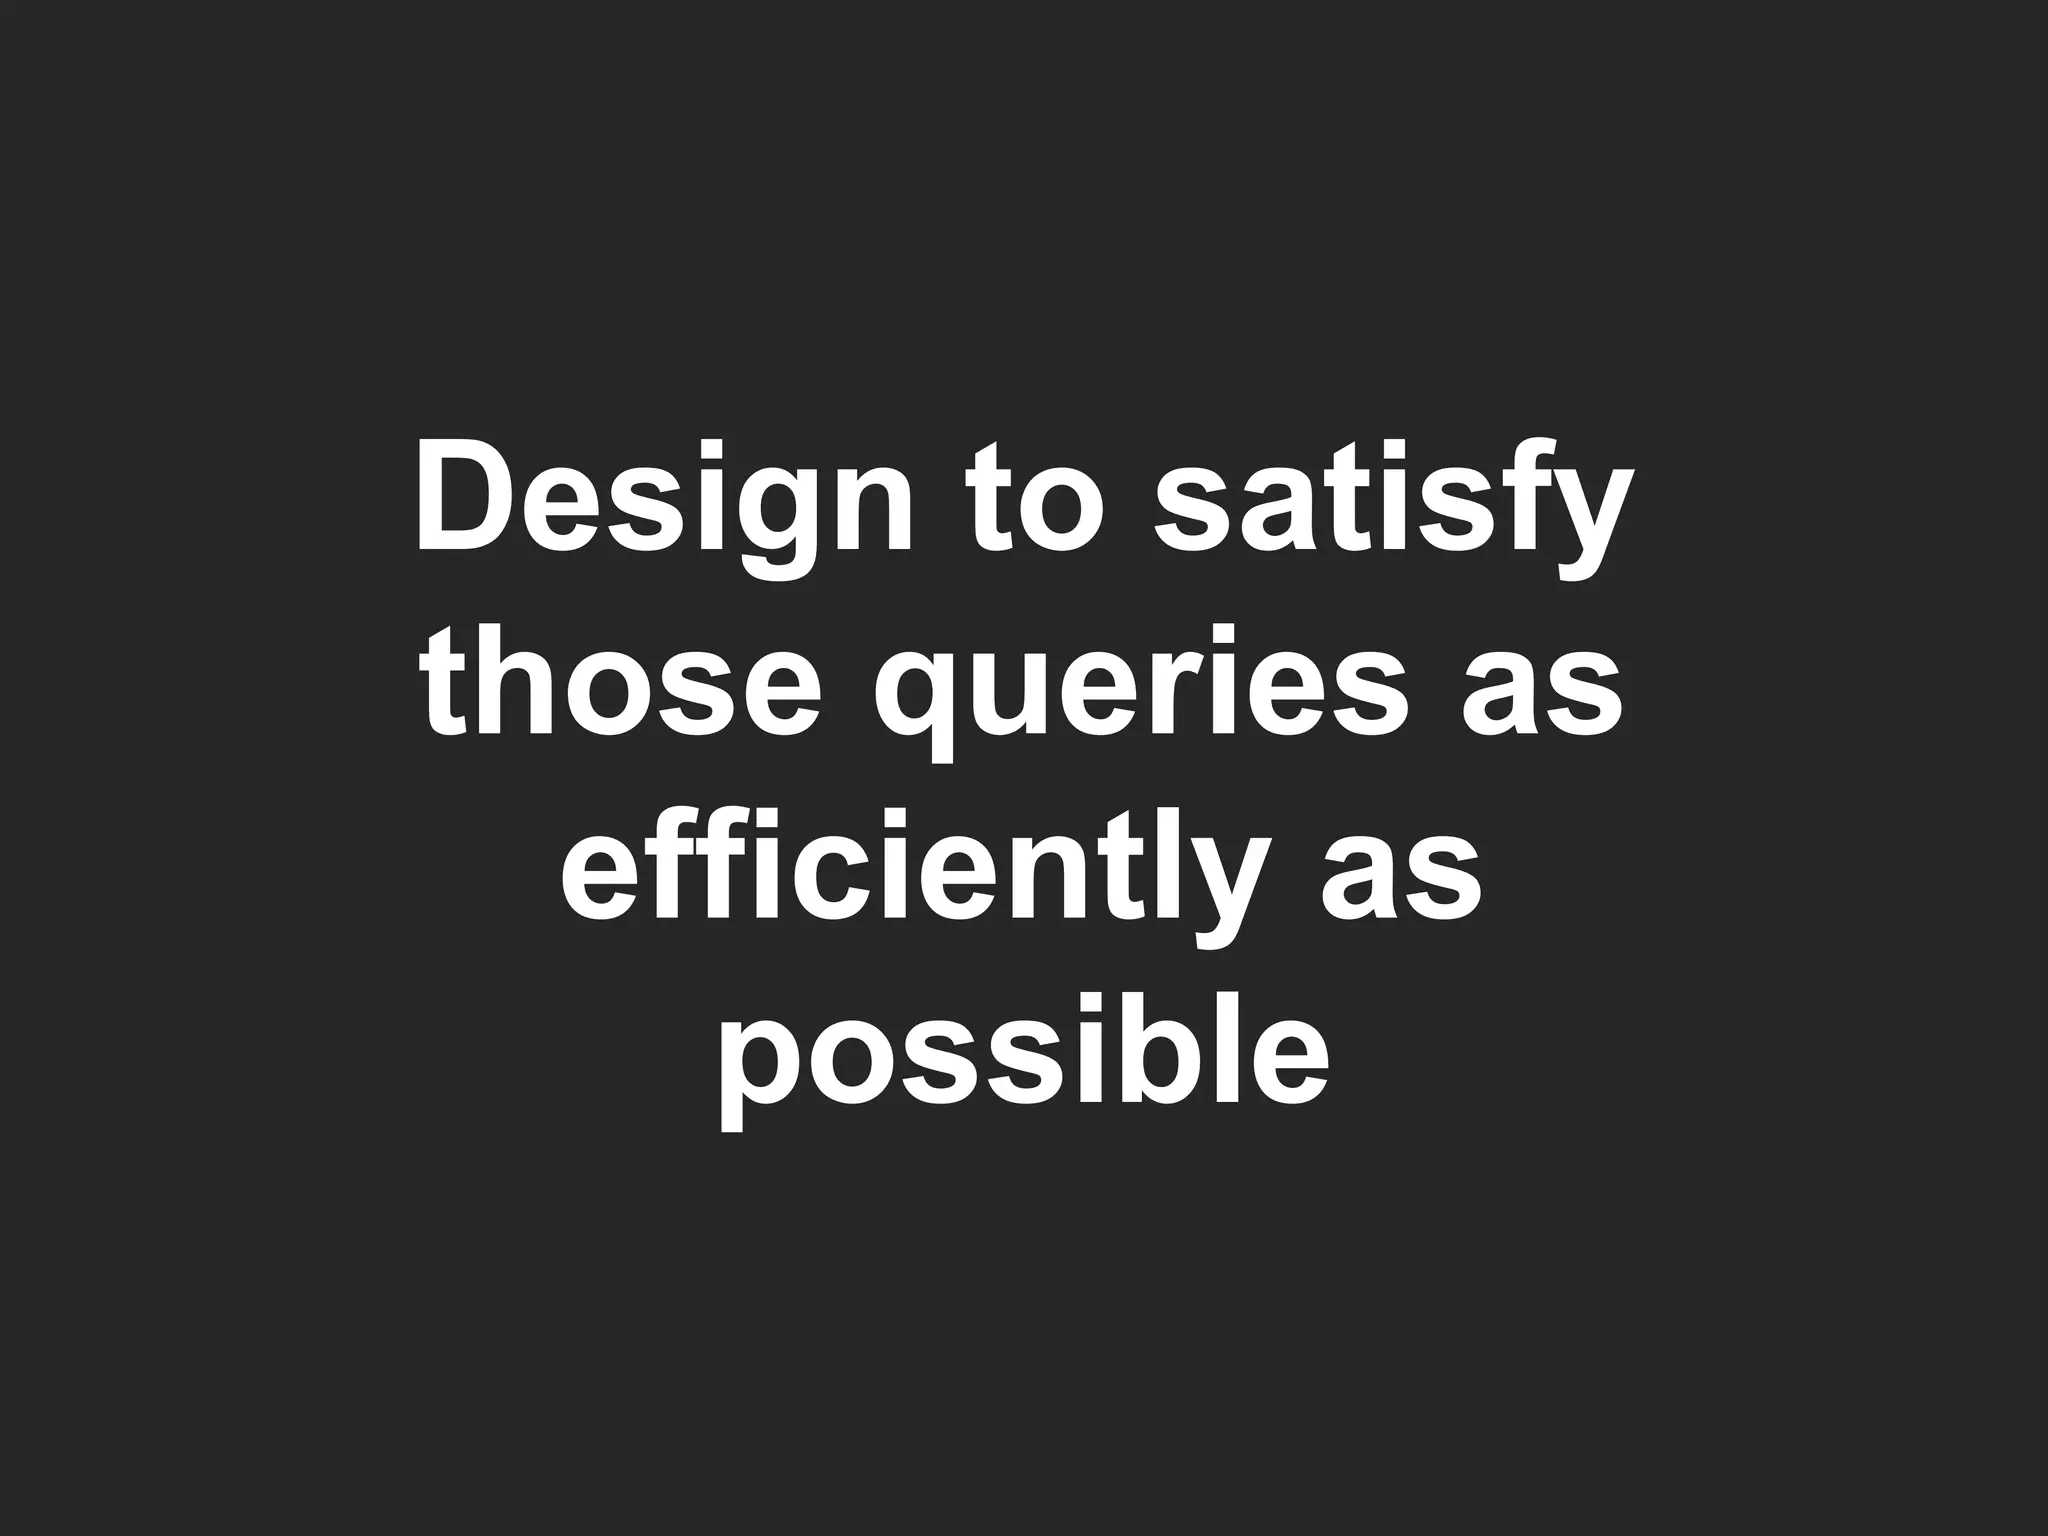
The document discusses the importance of designing for visual efficiency in presentations, emphasizing that data should communicate meaning rather than simply present numbers. It highlights the significance of understanding the viewer's needs and constructing visual queries effectively to reduce cognitive effort. Additionally, it provides various strategies to enhance visual clarity and impact, incorporating insights from studies on visual perception.


![Designing for Visual Efficiency [Ignite Format]](https://cdn.slidesharecdn.com/ss_thumbnails/ignitetorontoiivisualefficiency2003-091125132806-phpapp01-thumbnail.jpg?width=640&height=640&fit=bounds)


![[Netchange] Defining And Measuring Social Success](https://cdn.slidesharecdn.com/ss_thumbnails/netchangedefiningandmeasuringsocialsuccess-090625134251-phpapp02-thumbnail.jpg?width=640&height=640&fit=bounds)


