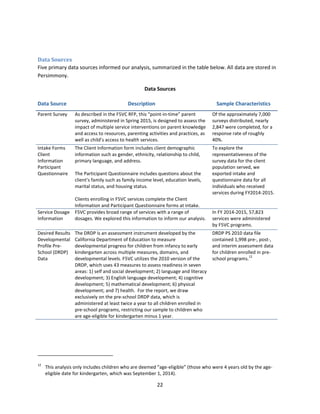
SlideShare a Scribd company logo
Findings from First 5 Ventura
County’s 2015 Parent Survey
Prepared by:
Rachel Estrella, PhD
Lydia Nash
9
1
Introduction
SPR is pleased to submit this evaluation report of the findings yielded from an extensive analysis of First
5 Ventura County’s (F5VC’s) Parent Survey, which was distributed for the first time to approximately
7,000 F5VC participants in spring 2015. The survey was designed to explore the relationship between
participant and program characteristics and progress towards three key F5VC outcomes articulated in
the First 5 Commission’s Evaluation Framework: access to care; kindergarten readiness; and knowledge
of child development, resources, and parenting. SPR’s goal in this comprehensive survey analysis, which
also included an analysis of intake and service data, is to help F5VC make meaning of the results in ways
that will support its continuous efforts to strengthen and improve its programs and to measure progress
towards desired outcomes.
This report begins with background information on the Parent Survey and how it aligns with F5VC’s
mission. We then provide an overview of our methods, including a brief discussion of our overall goals,
our approach to the analysis, and our work with F5VC and data sources used in the analysis. The
subsequent section provides detailed information about key characteristics of survey respondents, as
well as comparison statistics against larger F5VC service population to illustrate the representative
nature of the survey sample. This is followed by a section describing survey results and key findings. The
report concludes with a brief discussion of areas for consideration as F5VC continues to refine the
survey and the survey implementation process to continue to illuminate progress towards key
outcomes.
Background
F5VC’s overarching programmatic goals are to ensure that (1) children are healthy, (2) children have
language and social-emotional skills, and (3) families have the resources they need. To that end, F5VC
is using the Parent Survey as a primary instrument to measure progress towards three key outcomes
aligned with their goals: (1) access to care; (2) school readiness prior to kindergarten; and (3)
parent/family knowledge of child development, resources and parenting. The Parent Survey contains 26
questions, divided into four sections: (1) Health and Screening, (2) Activities, (3) Community Resources,
and (4) Parenting. A copy of the full Parent Survey is included in Appendix A, followed by an explanation
of our methods and approach, included as Appendix B.
Methods
SPR took a collaborative and iterative approach to this analysis, working closely with F5VC to review
data quality, address issues related to data matching, and to ensure continued alignment of purpose.
This collaborative approach was critical to ensuring accuracy and shared understanding, particularly
given that this was the first year of Parent Survey implementation as well as F5VC’s first year working in
a new data management system--Persimmony.1
Our goals are to examine what the survey data can tell
us about progress towards F5VC’s three key outcomes, and to make meaning of the data in ways that
1
Last year, F5VC transitioned its client records and comprehensive data collection system from Mosaic’s Grants
Evaluation Management System over to Persimmony, an online data management solution used by 19 other
First 5 programs in California.
2
support F5VCs continuous improvement efforts. Five data sources informed our analysis: results from
the parent survey, client intake forms, participant questionnaires, service dosage information, and the
Desired Results Developmental Profile (DRDP) for preschool. A full list of data sources, as well as a
description of our analysis approach, are
included in Appendix B.
Profile of Children and Families
In order to contextualize the findings from our
analysis of the Parent Survey results, it is
important to have an understanding of F5VC’s
service population. To that end, in this section
we provide information on the children and
families served by F5VC and an analysis of
key characteristics of this population. While
this section focuses on the broader F5VC
service population, findings from our
analysis will be based on the survey sample,
which our analysis concludes is
representative of the larger service
population in terms of the key
demographics shared in the sections below
focused on number and characteristics of
children and families served. Tables
providing more detailed information on key
characteristics of F5VC’s service population and
the survey sample are included in Appendix C.
Number and Characteristics of Children
Served
In FY 2014-15, F5VC provided services to 6,555
children.2
Key characteristics of this service
population are described below.
 Child Gender and Age. Fifty-two percent of the child population is male and 48% is female.
Infants and toddlers comprised the majority of the F5VC child service population at 64%.
 Race/Ethnicity. The racial and ethnic composition of the child participant population was
predominantly Hispanic/Latino (76%), followed by White (15%) and multiracial (4%). Asians
2
This number does not capture all children touched by the multitude of services, supports, and activities offered
through F5VC. Rather, it represents F5VC’s core child clients, i.e. clients for whom they provide more intensive
services and whose demographic information and services received are tracked in Persimmony, F5VC’s client
database.
1%
2%
3%
4%
15%
76%
Black
Other
Asian
Multiracial
White
Hispanic/Latino
Race/Ethnicity of Children Served
< 0%
2%
3%
39%
55%
Vietnamese
Other
Mixteco
English
Spanish
Home Language of Children Served
13%
13%
38%
35%
Under 1 year
1 Year
2 - 3 years
4 - 5 years
Age of Children Served
3
comprised 3% of the population, 1% was African American, and the remaining 2% had race
recorded as “other” or “unknown.”
 Language Spoken at Home. The majority of the child service population spoke a language other
than English at home (61%). The top three languages spoken at home included Spanish (55%),
English (39%), and Mixteco (3%).
 Zip Code of Family Residence. Children served by F5VC accessed early childhood services
throughout Ventura county via a number of service delivery points, including preschool
programs, countywide services (medical and dental clinics), and NfL family resource centers. The
largest percentage of children served resided in Oxnard (34%), followed by Simi Valley (8%) and
then Fillmore (7%). The table above depicts the distribution of families by zip code.
Number and Characteristics of Parent/Caregivers and Families Served
The characteristics of families served by F5VC during FY-15 are as follows:
 Marital status. Eighty percent of families served in FY 2014-2015 represented married couples
or those in a domestic partnership, 18% were a single parent household, and 2% identified as
“other.”
 Housing. Sixty-nine percent lived in a single family residence and 31% lived in a situation
wherein more than one family shared a home.
 Children per family. Fifty-seven percent of families had one child at the time of program intake,
34% had 2 children, had 8% had 3 or more children.
 Parent/caregiver education levels. Approximately one-third of families included a parent or
primary caregiver whose highest education level was less than a high school degree. Only 17%
had a parent or caregiver whose highest education level included a Bachelor’s degree or higher.
 Family income levels. Almost half of the families served by F5VC in FY 14-15 earned less than
$20,000 per year. One quarter of the families learned less than $10,000 per year. Ninety-one
18%
10%
8%
7%
6%
6%
6%
5%
5%
4%
93033 (Oxnard)
93030 (Oxnard)
93065 (Simi Valley)
93015 (Fillmore)
93021 (Moorpark)
93036 (Oxnard)
93060 (Santa Paula)
93001 (Ventura)
93010 (Camarillo)
93041 (Port Hueneme)
Zip Code of Family Residence (top 10 only)
4
percent of families served made less than the median family income for Ventura County
($76,544).3
Number and mix of Services Received
In FY 2014-15 a total of 58,624 services were provided to 7,412 First 5 Ventura County client families.
These services fell under three broad types: county-wide services (e.g. oral health services); preschool
expansion services; and the wide range of services offered through F5VC’s 11 Neighborhoods for
Learning (NfLs). A table of services analyzed in service of this report, categorized by program type, is
included in Appendix D. The tables below provide information on the number of services received by
clients as well as the services most frequently received by families.
3
Source, U.S. Census Quick Facts. Median Family Income in Ventura County, 2009-2013.
15%
17%
12%
8%
14%
35%
0% 10% 20% 30% 40%
11+ services
6-10 services
4-5 services
3 services
2 services
1 service
Numberof Services Received by Clients
(3,883)
(885)
(1,349)
(1,854)
(1,707)
(1,524)
2%
3%
8%
13%
21%
51%
0% 20% 40% 60%
Developmental Screenings (ASQ)
Oral Health
ParentingEducation
Service Coordination/Case Management
Preschool
EL PACT (Early Learning for Parents and Children Together)
& Family Literacy Programs
Services Most Frequently Received in FY14-15
(29,617)
(1,674)
(4,653)
(7,900)
(12,109)
(938)
EL PACT (Early Learning for Parents and Children
Together) & Family Literacy Programs
5
Key findings around number and types of services received include:
 On average, individual clients received 5.2 services during FY14-15. NfL clients received 5.9
services on average, whereas preschool expansion clients received 5.3 services, and countywide
clients received 2.8 services. On average, families received 7.9 services during FY14-15.
 Thirty-five percent of clients received only one service from F5VC during FY14-15. The service
that was most frequently utilized by one-service clients was EL PACT (30%).
 Of the clients who received more than one service, most clients (68%) only engage in one type
of service (i.e. county-wide service, preschool expansion, or services provided through NfLs).
 Of the clients who received multiple services across multiple types of services, the three most
frequently utilized services were (1) EL PACT classes, (2) Parenting Education classes, and (3)
Service Coordination/Case Management. The most frequent combination of services received is
EL PACT classes and Parenting Education classes.
Although the survey was representative of the universe of clients in terms of demographics, home
language, family income, and age, survey respondents’ intensity (number of services received) and mix
of services received was not representative of the larger client population. In particular, the number of
families who received more than 5 services in FY14-15 is overrepresented and the number of families
who received 1-2 services is underrepresented. Specifically, 23% of families within the universe of clients
received 11+ services, whereas 44% of the survey population received 11+ services. Therefore, in the
subsequent findings section, any findings shared from lines of analysis regarding services received only
apply to the survey population and cannot be extrapolated to the entire universe of clients receiving
services in FY14-15.
Findings
In this section we present findings on progress made in F5VC’s three key outcome areas, based on
parent survey results and preschool DRDP data. For each outcome, we provide outcome-level findings,
followed by findings at the indicator level. We also share findings in areas where analyses of results by
participant characteristics or program type yield interesting variations by subgroup. Similarly, we also
include findings related to intensity and mix of services, in areas where those lines of analyses yielded
meaningful information. Again, because the sample was not representative of the larger First 5
population in terms of intensity or mix of services, we cannot generalize related findings to the broader
population.
Outcome 1: Access to Care
The four indicators mapped to access to care include 1) access to health insurance; 2) access to (and
consistent use of) medical care providers; 3) levels of physical activity and nutrition; and 4) access to
(and consistent use of) oral healthcare providers. Nine questions in the parent survey and two questions
from the Intake Questionnaire map to this outcome area and are incorporated into the analysis.
The table below includes summary statistics across the 2,274 children whose parents provided
information on them in the parent survey. In addition to providing question-level results from the
survey, the table also includes indicator- and outcome-level composite measures to enable the reader to
quickly see progress at multiple levels. For all measures except question 9, results reflect the mean
6
percentages of parents who responded “Yes” to the questions in this outcome area. For question 9, the
results reflect the mean percentage of parents who selected either “none” or “1 hour or less” as a
response.
Indicator Questions Mean
#/% of previously
uninsured children
who are enrolled in
health insurance
 Q3: Does your child currently have health insurance?
97%
#/% of children who
have and use a regular
place for medical care
 Q1: Do you have a usual place to go when your child is sick or you need
health advice?
97%
 Q2: Did your child have a routine check-up in the last 12 months? 96%
COMPOSITE
4
91%
#/% of parents
reporting regular
physical activity and
healthy eating for their
children
 Q9: On an average weekday, how much time does your child usually
spend in front of a TV watching videos, TV programs, or playing video
games? (selected None or 1 Hour or less)
49%
 Q10: For my toddler or preschooler, I provide 1-2 hours of physical
activity (for example, playing outside, sports, dancing or running
around) each day for my child.
84%
 Q11: I prepare healthy foods for my child. 93%
COMPOSITE (percentage based on Q10 and Q11) 74%
#/% of children who
have and utilize a
regular place for oral
health care
5
 Q5: Did your child have a dental exam in the last 6 months? 78%
 Q6: Does your child have a regular dentist? 78%
COMPOSITE (Q5 and Q6 = yes) 69%
COMPOSITE Based on indicators 74%
Overall, an average of 74% of parents surveyed reported positive findings in the Access to Care outcome
area. There was a great deal of variation at the indicator level, with indicators around health insurance
enrollment and access to a regular place for medical care yielding particularly strong results, and
indicators for regular physical activity and healthy eating, as well as having a regular place for oral health
care yielding mixed and generally less positive results. Analyses of intensity and mix of services yielded
no meaningful findings at either the outcome or indicator levels. Below we share key findings at the
indicator level.
Results within Indicator 1 (Insurance Enrollment) were extremely strong. Results to the survey
questions mapped to this indicator are very positive. Some key findings include:
 97% of respondents reported that their children have health insurance, compared to 90% at
the time of intake. (The survey does not ask about insurance type.)
4
The composite measure for this indicator required the respondent to select yes to both question 1 and 2.
7
 Only 183 children associated with survey respondents did not have insurance at the
time of intake. Of those, (87%) had insurance by the time the survey was administered.6
Findings from deeper levels of analysis:
 Analyses by demographic subgroups yielded no notable variations in findings.
 Some differences were found by program type—e.g. 92% of children receiving NfL services who
did not have insurance at the time of intake had insurance by the time the parent survey was
administered, compared to 83% of those who received countywide services.
Results within Indicator 2 (Regular Place for Medical Care) were extremely strong. Results to survey
questions mapped to this indicator are very positive. Key findings include:
 Ninety-seven percent of survey respondents reported having a regular place to go when their
children are sick or when they need medical advice
 Ninety-six percent of respondents reported that their child had a routine medical examination
within the past 12 months.
Findings from deeper levels of analysis:
 Further analyses yielded slight differences across demographic subgroups—93% of
respondents from English-speaking households selected “yes” for both questions in this
indicator, versus 90% of respondents from non-English speaking households. Moreover, 95% of
White children were reported as having and using a regular place for care, compared to 91% of
Hispanic children.
Results within Indicator 3 ( Regular Physical Activity and Active Living) yielded mixed results. There
was a significant amount of variation in results across all measures within this indicator level. Key
findings include:
 A high percentage of respondents (93%) reported that they prepared healthy foods for their
children, however
 Only 49% reported that their children, on average, watch 1 hour or less of television use. (The
American Academy of Pediatrics recommends no screen time for children under 2 years old and
no more than 1-2 hours for children older than 2).
6
The extremely positive response to this question was somewhat surprising, given the sizable portion of low
income families served by F5VC. To provide more nuanced understanding, it may be useful to add a
subquestion in the survey around insurance type. While the most recent F5VC intake forms ask clients to report
insurance type, previous versions of the form did not ask for this level of data, and thus we were unable to tie
these survey responses to intake forms in ways that would yield consistent and meaningful results.
8
Findings from deeper levels of analysis:
 Results were fairly comparable across racial and ethnic groups, however there were slight
variations for children that spoke different languages at home—52% of children from non
English-speaking households were reported as spending 1 hour or less in front of a television,
versus 44% of children from English-speaking households.
Results within Indicator 4 (Regular Place for Oral Health Care) were not strong. Key findings include:
 Seventy-eight percent of respondents reported that their children have a regular dentist and
that they had a dental exam within the last 6 months. Results in this indicator area are, on
average, lower than results in other indicators within this outcome area. At the time of intake,
parents reported that 48% of children had received a dental exam within the last 6 months.
However, it is important to note that these results do not take into account the age of the child
at the time the survey was administered.
Outcome 2: School Ready Prior to Kindergarten
The three indicators mapped to school ready prior to kindergarten focus on: 1) literacy practices at
home; 2) developmental screening referrals and uptake; and 3) school readiness as measured by the
DRDP. Because findings for this outcome area draw on on two different data sources (Parent Survey
responses for the first two indicators and DRDP scores for the last indicator), we did not create a
composite score for the outcome area. Moreover, for this outcome, we divide our presentation of
findings according to data source for the sake of clarity.
Our analysis for the first two indicators in this outcome area drew on two questions (and corresponding
subquestions) from the parent survey. Results for the first indicator reflect the mean percentage of
parents that reported reading with their children 3-6 days per week or more. Results for the second
indicator reflect the percentage of respondents who report having received a developmental screening
referral and, subsequently, percentages of those respondents who followed up on those referrals.
Indicator Questions Mean
#/% of parents
who read to
their children 3
or more days a
week
 Q8: In the usual week, about how many days do you or any other family
members read stories or look at picture books with your child? (Results reflect
responses from parents who selected 3-6 days or every day.)
7
71%
#/% of children
who receive
developmental
 Q7: Since you started receiving First 5 services, has your child been referred for
a Developmental Screening (for example, have you been asked to complete a
checklist of activities that your child can do, such as certain physical tasks,
58%
7
There were four response options to this question: 1-2 days, 3-6 days, every day, and never.
9
screenings and
follow-up
8
whether your child can draw certain objects, or ways your child communicates
with you)?
 Q7a: If you received a referral, was a Developmental Screening conducted? 79%
 Q7b: If a Developmental Screening was conducted, was a concern identified? 61%
 Q7c: If a concern was identified, has your child received follow-up services? 75%
Because of the wide variation in scores and the multiple levels of response type (i.e. some questions
included sub-levels), we did not include composite scores for these indicators. Below are key findings at
the indicator level.
Results within Indicator 1 (Parents Who Read to their Children 3 or More Days per Week) were not
strong. Survey results indicate that many parents are not reading to their children at optimal or
recommended levels. Key findings include:
 Seventy-one percent of children from the sample have parents who regularly read to their
children 3-6 days per week or more. The American Academy of Pediatrics, however,
recommends that parents read to their children on a daily basis in order to support child
literacy. Only 33% of children in the sample had parents who reported reading to their
children every day.
Findings from deeper levels of analyses:
 Our analysis indicates that there is a large racial disparity in this indicator area.
 Ninety percent of white children in this sample have parents that report reading to
them 3-6 days per week or every day, whereas only 65% of Hispanic children’s parents
reported reading to them as often.
 There was also a notable difference between English-speaking homes and non-English
speaking homes. Eighty-six percent of children from English speaking homes are read to
3-6 times per week or everyday, versus 62% of children from non English-speaking
homes.
 Families who received 3 or more services related to this Indicator (i.e., EL PACT, Kindergarten
Transition for Parents) reported reading to their children 3-6 times per week or every day more
often than families who received 0 to 2 services.
Results within Indicator 2 (Children Who Receive Developmental Screenings and Follow Up) were
mixed. This indicator area, and the questions that fall within it, are different from the rest of the
questions in the survey in that it incorporates sub-level follow up questions and it is the only indicator
8
Fields with populated data that succeeded a question with missing data were included in the analysis of this
indicator. For example, if a respondent selected yes to question 7, left 7a blank, and selected yes to 7b, this
data was included.
10
wherein positive findings are not necessarily correlated with high percentages. Thus, making meaning
of the results requires a different lens. Below are some key findings:
 Fifty-eight percent of respondents reported that their child received a referral for
developmental screenings.
 Of those, 79% reported that their child received a developmental screening and 61% of
those parents reported that a “concern” was identified as a result.
 Seventy-five percent of parents whose children received a developmental screening
wherein a concern was identified reported receiving follow up services.
Findings from deeper levels of analysis:
 There were interesting variations in this indicator area across subgroups:
 69% of children from non English-speaking households were referred for a
developmental screening, compared to 41% of children from English-speaking
households. After being referred for a developmental screening, whether or not an
actual screening occurred varied greatly across children served by different program
types.
 Eighty-one percent of children at NfLs and 78% of children at preschool expansions
received screenings after being referred. However, only 69% of children who received
services from a countywide program actually received a developmental screening upon
referral. Moreover, after receiving screenings, 64% of Hispanic children had a “concern
identified,” compared to only 37% of their White counterparts.
 Families who participated in Kindergarten Transition Programs for Parents were more
likely to receive a referral for their child to receive a developmental than families who
received preschool or Kindergarten Transition for Children services. However, families
who received Kindergarten Transition for Children services were more likely to receive a
screening, have a “concern identified,” and receive follow-up services.
 In this measure, there was also a notable difference in results between children from
English-speaking and non-English speaking homes. Sixty-five percent of children from
non English-speaking homes had a “concern identified” compared to 48% of English-
speaking children. However White children who had a “concern identified” received
follow up services at lower rates than their counterparts.
 Analyses by of results by program type also yielded slight variations--eighty percent of clients at
countywide programs received follow up services, compared to 75% of children serviced
through NfLs.
Our analysis for the third indicator in this outcome area drew on preschool Desired Results
Developmental Profile (DRDP) scores.9
In the table below we show results of pre- and post-assessments
9
Data was collected in Persimmony on 1,411 children receiving preschool services during FY14-15. Of these
children, 834 are deemed to be “DRDP eligible” children (those who were 4 years old by the age-eligible date
for kindergarten, which was September 1, 2014). Of the 834 DRDP eligible children, 710 (85%) of children
11
for DRDP-eligible children, to demonstrate both growth over time and to show how many children were
kindergarten-ready (i.e. whose results fell into one of the two highest developmental levels—building or
integrating) by the time they took their post-assessment. Note that this data table only includes data
from children for whom we have both pre- and post-assessment results. On average, children who took
both the pre- and post-assessments received 35 hours per week of preschool services. For comparison
purposes, we also ran a separate analysis of all post-assessments for DRDP-eligible children irrespective
of whether or not we had pre-test data. The results were identical to the post-assessment data listed in
the table below.
Indicator Domain % of Children from Pre/Post
Sample scoring at the
Building or Integrating Levels
Pre Post
#/% of children
considered
school ready as
measured by an
evidence-based
tool
 Self and Social Development (SSD) 35% 86%
 Language and Literacy Development (LLD) 31% 83%
 English Language Development (ELD) 43% 81%
 Domain: Cognitive Development (COG) 32% 83%
 Mathematical Development (MATH) 29% 82%
 Physical Development (PD) 53% 93%
 Health (HLTH) 40% 86%
COMPOSITE (Building and Integrating across all domains) 20% 70%
Given the wide variation in measurement tools and focus across each indicator area, we did not develop
a composite score for this outcome. At the indicator level, a great deal of variation emerged. Key
findings at the indicator level are shared below:
Results within Indicator 3 ( Children Who Are Considered School Ready) are mixed. The first measure
includes the percentage of all kindergarten-eligible children receiving F5VC preschool services who
scored in the top two levels of the DRDP (“Building” or “Integrating”). The following are some key
findings of note:
 While post-assessment scores in each learning domain appear fairly positive, only 70% of
children received scores that fell into the top two levels of the DRDP across all domains. The
fact that 30% of age-eligible children did not meet target milestones across all DRDP learning
domains may warrant further examination by F5VC.
 The results show remarkable growth over time overall and within each learning domain. In
this sample, the composite score indicates that 20% of these children scored within the higher
levels for the pre-test, and 70% scored within these levels in the post-test stage, indicating
positive levels of growth across all learning domains over time for this sample group. Growth
within each domain ranges from 38% to 53% .
completed at least one DRDP assessment. Pre- and post-assessments were administered to 599 children.
Note: Within the entire DRDP dataset, there were 947 matched pre- and post-assessments.
12
Deeper levels of analysis across different participant characteristics or intensity or mix of services did
not yield significant variation across subgroups.
Outcome 3: Knowledge of Child Development, Resources, and Parenting
The three indicators mapped to knowledge of child development, resources, and parenting focus on
three main areas: access to services, knowledge of child development, and parenting confidence. There
are 15 questions in the parent survey that map to this outcome area. Questions in the first indicator
area focused on access to services utilized a five-point agreement scale. 10
Questions in subsequent
indicators utilized a four-point scale, which used the same response options as the previous scale, but
without the “Does not Apply to Me” option. In this section, we report average percentages of parents
that selected “Most of the Time” or “Always” as responses, as well as the mean Likert scale results.
Below are summary statistics across the full parent sample of 2,847 parent surveys.
Indicator Questions Percent
Score
Mean
#/% of parents
reporting they can
access services
when needed
 Q12: I know how to get services that I need for my child. 85% 3.38
 Q13: I am getting the services I need for my child. 90% 3.54
 Q14: I talk to someone when I am worried about my child. 86% 3.46
 Q15: I get my questions about parenting or child development
answered.
86% 3.42
 Q16: I have places I go to in my community to get the resources I
need.
80% 3.33
 Q17: I have places I go to in my community to meet with other
parents.
62% 2.90
INDICATOR COMPOSITE 81% 3.34
#/% of parents
reporting good
knowledge of
child
development
 Q18: I understand my child’s development. 93% 3.54
 Q19: I am able to tell if my child is making progress. 95% 3.65
 Q20: I know how to help my child develop and learn. 91% 3.47
 Q21: I know how to help my child behave the way my family
would like.
87% 3.35
 Q22: I am able to help my child learn and practice new skills. 92% 3.51
 Q23: I know what to expect of my child based on her/his age. 89% 3.44
INDICATOR COMPOSITE 91% 3.49
#/% of parents
who feel
confident in their
parenting skills
 Q24: I can handle problems that come up when taking care of my
child
94% 3.57
 Q25: I believe I have the skills for being a good parent to my child. 96% 3.63
 Q26: I am confident as a parent. 97% 3.69
INDICATOR COMPOSITE 95% 3.63
OUTCOME #3 COMPOSITE 88% 3.46
10
Response options included Always, Most of the Time, Sometimes, Never, and Does not Apply to Me.
13
Parent survey results are quite strong in this outcome area, with an overall average agreement rating
(i.e. parents chose most of the time or all of the time) of 88% across all indicators, as measured by the
composite score. At the outcome level, there was some notable variation in responses across subgroups.
These include:
 Respondents from English-speaking households responded more favorably11
(57%) than those
from non English-speaking households (41%).
 Hispanic respondents gave the lowest favorable ratings in this outcome area (43%) when
compared with White respondents (63%), African American respondents (60%), and multiracial
respondents (60%).
Results within Indicator 1 (Ability to Access Services When Needed) are somewhat mixed. Responses
within this indicator area were fairly strong, with the exception of one measure, yielding an overall
composite score of 81% for this indicator area. Key findings include:
 Eighty-five percent of parents reported they know how to access needed resources.
Interestingly, a higher percentage (90%) report that they are getting the services they need.
 The lowest scoring measures were around access to community-level resources. Interestingly,
the two lowest scoring measures in this outcome area fell within this “access” indicator, and
were in response to prompts focused specifically around community-level resources: I have
places I go to in my community to get the resources I need (80%), and I have places I go to in my
community to meet with other parents (62%). These results might indicate a need for greater
investment around either strengthening community support systems or communications about
existing support systems. It may also signal a fairly strong sense of parent isolation and need for
parent community building.
Findings from deeper levels of analysis: Given that the lowest scores in this outcome area fell
within this indicator, we conducted a deeper level of analysis for the indicator itself and specifically
for responses to Question 17 (I have places I go to in my community to meet with other parents).
The following are some key results:
 At the indicator level, participants from English-speaking households responded favorably
more often than those from non English-speaking households (64% of versus 47%). This
type of variation was also true in examinations of responses to question 17, which indicate
that 69% of respondents from English-speaking homes responded favorably, compared to
58% of those from non English-speaking homes.
 Analyses at the program type level yielded varied results to Question 17. Only 35% of
respondents who received preschool expansion services reported positive results to
11
For this outcome area, a favorable response is when respondents select “most of the time” or “always” as a
response.
14
Question 17, compared to 61% of NfL respondents and 66% of respondents who received
county-wide services.
 Analyses cut by intensity or mix of services reveal that respondents who participated in at
least one Early Learning: Parent and Children Together class responded more favorably to
this question, with 71% of respondents reporting positive outcomes. In fact, clients who
received any combination of Early Learning: Parent and Children Together (EL PACT),
parenting education, or case management services scored more favorably on this question.
Additionally, 72% of clients receiving 11 or more services related to this outcome area
reported positive outcomes versus 62% of the survey population. Finally, respondents who
participated in at least one EL PACT class also scored higher on the overall indicator (84% vs.
81%).
Results within Indicator 2 (Knowledge of Child Development) were strong. Responses within this
indicator area were consistently strong across all measures, indicating that parents who responded to
the survey feel they have a solid understanding of child development and how to apply that
understanding to their children’s progress. Key findings are shared below.
 The highest average agreement score was in response to the prompt I am able to tell if my child
is making progress (95%).
 The lowest scoring measure within this indicator area was in response to the question I know
how to help my child behave in the way that my family would like (87%).
Findings from deeper levels of analysis:
 There were no notable variations across racial or ethnic groups, though responses from
participants in English-speaking homes were slightly more favorable (7% higher) than those from
non English-speaking homes.
 Respondents that participated in countywide programs gave more favorable responses (82%)
than respondents who were served by NfLs or preschool services (76%).
 There were no notable variations across services received.
Results within Indicator 3 (Confidence in Parenting Skills) were extremely strong. This indicator
received the strongest scores within the outcome area, with an average composite score of 95% and
extremely positive results across all measures within this indicator area. These results indicate that
parents who responded to the survey are confident in their ability to be a “good parent” and in their
ability to address issues when they arise.
Findings from deeper levels of analysis:
 Results varied slightly by program type but were still very strong, with 100% of respondents
served by preschool expansions responding favorably across all measures in this indicator area,
compared to 95% of those served by countywide programs and 90% of those served by NfLs.
15
Conclusion
First 5 Ventura County has been providing a wide range of invaluable services to populations in need of
support, in an effort to ensure that all children in Ventura County can thrive. Results from the Parent
Survey and DRDP data indicate that, overall, participants are making fairly strong progress in the three
key outcome areas: (1) access to care; (2) kindergarten readiness; and (3) parent knowledge of child
development, access to resources, and confidence. Results indicate that key areas of strength include
children’s access to health care and health insurance, parent confidence, and parent knowledge of child
development. Issues that may warrant further examination or action include support for stronger
literacy practices at home (both in reduced screen time and increased parent reading time with
children), increased encouragement and support around oral health, potential need for greater
community-building efforts to reduce parent isolation, increased support for preschoolers who are not
reaching developmental milestones, and further examination of subgroup variations around
developmental screenings and uptake.
Areas for Consideration
Making meaning of the Parent Survey results was a learning endeavor for both SPR and First 5 Ventura
County, particularly given that this was the first year the F5VC Parent Survey was deployed. We will
provide F5VC with an informal document detailing technical considerations, lessons learned, and/or
recommendations around data entry and cleaning, timing, misalignment with other data sources,
measurement scales, and semantics.
Below are some broad-level considerations for F5VC as it continues to refine the content and
deployment of the Parent Survey to optimize meaning-making of the results.
 Check results against experience. Some measures yielded such extremely positive results that
they were rather striking and gave us pause. For example, the extremely high levels of parent
confidence were not typical of the kinds of responses we normally see in evaluations of this
kind. It may be helpful to have conversations with providers, to see if this level of confidence
holds true in their experience with clients and if not, to explore meaning behind the difference.
 Review wording of both intake and parent survey questions to ensure more concise, accurate,
and useful responses. It might be useful to take a careful look at both intake forms and the
survey to make sure that the questions are clear, particularly for respondents that are limited
English-speakers. For example, one form that seeks demographic data on a child uses the
pronoun “your” (e.g. “what is your race/ethnicity”). This could easily lead to the form filler filling
in his or her race/ethnicity instead of the child’s, potentially resulting in mixed data.
We were also curious about how wording contributed to meaning making in areas where the
survey results were significantly surprising. For example, high levels of respondents reporting
having access to both health insurance and a regular place for health care ran counter to our
expectations, given the relatively high levels of poverty in the service population. While this may
indicate positive outcomes as a result of the Affordable Care Act, it might have been more
useful to also ask subsequent questions around the type of insurance the participant possessed
16
(e.g. private insurance or public insurance) within the survey. Asking this subsequent question
gives the respondent time to pause and reflect more deeply about the question itself (which
may help reduce response error) and it also provides better understanding around the kind of
health care supports the participant can access.
 Set target goals specific to outcomes and indicator areas in this survey to measure progress
against goals and improvement over time. In order to more meaningfully assess progress in
outcome areas, it would be helpful to have target goals within each indicator area so that the
results can be less abstract and more aligned with realistic expectations. It would also enable
F5VC to use the Parent Survey results to measure progress over time.
 Re-map indicators within Outcome Area 1 (Access to Care). The indicators grouped into that
outcome area are not aligned (e.g. indicators around levels of physical activity were included
with indicators around access to insurance and dental care), reducing our ability to say
something meaningful about progress for this outcome area.
 Create a clear plan for addressing challenges around data association. One of the biggest
challenges we experienced in analyzing and making meaning of the survey results is that in some
outcome areas, indicators required that we reassociate family- and parent-level data with
individual children. Additionally, there were data complications when more than one
parent/caregiver completed the parent survey and provided conflicting information regarding
their child(ren). Ideally, parent-level and child-level data would be collected using two different
tools.
 F5VC may want to alter the survey and deployment strategy if it wants to make clearer, more
concrete connections between outcomes and services received. The parent survey was a
single, comprehensive survey given to parents at a single point in time who may have benefitted
from a whole host of services offered via F5VC at any given point within FY 2014-15. As such, we
could not discern or identify clear connections between outcomes and services, mix of services,
or intensity of services because the range and diversity within those arenas varied so greatly
across the survey participants. Moreover there was wide variations in lag time between when a
client received a service and when the survey was taken, which can have some influence over
parent responses. One potential solution would be to create a master list of survey questions,
mapped directly to specific outcomes and indicators, and to create separate surveys for
different services that use only service-appropriate questions, from the master list. These
surveys could then be deployed at end points of a service (e.g. at the end of a workshop or a
training series, end of a preschool year, etc.), with appropriate identifiers still tied to each
survey so that evaluators could more clearly connect the outcome reported on the survey with
the service received.
In concluding this report, we feel it is important for us to underscore the need for caution around how
to use or act upon the data shared in this report. Results from the Parent Survey can yield some useful
information about how children and families are faring across different outcome levels, and it can reveal
areas for further inquiry, but cannot provide a nuanced picture of the impact of F5VC services on its
clients. This is in large part because surveys are, in general, limited in terms of what they can reveal, and
because the wide variation of scopes, mixes, and intensities of services provided to survey participants
made it challenging, in this survey, to make some concrete attributions to outcomes yielded from a
single survey. The Parent Survey provides important information about how F5VC’s service population is
17
faring with respect to key agency goals. While attribution is challenging, the results still point towards
strong progress in critical arenas. It has been an honor working with First 5 Ventura County on this
complex project.
18
Appendix A:
Parent Survey
19
Parent Survey
We want to learn if our services have helped you and your family. There are no right or
wrong answers. Please answer the questions honestly. Your participation is voluntary
and your responses will be kept private. Thank you!
I. HEALTH AND SCREENING
1. Do you have a usual place to go when your child is sick
or you need health advice?
 Yes  No
2. Did your child have a routine check-up in the last 12 months
(a doctor visit not related to illness or injury)?
 Yes  No
3. Does your child currently have health insurance?  Yes  No
4. What is the regular place or doctor where you take your child for routine care and check-ups?
 Doctor’s office, private clinic, or HMO  Have never taken child for routine care
 Public health department or
community health center/clinic
 Prefer not to say
 Other, please specify: ______________________
 Emergency room at a hospital
5. Did your child have a dental exam in the last 6 months?  Yes  No
6. Does your child have a regular dentist?  Yes  No
7. Since you started receiving First 5 services, has your child been
referred for a Developmental Screening (for example, have
you been asked to complete a checklist of activities that your
child can do, such as certain physical tasks, whether your child can
draw certain objects, or ways your child communicates with you)?
 Yes  No  Don’t
Know
a. If you received a referral, was a Developmental
Screening conducted?
 Yes  No
b. If a Developmental Screening was conducted, was a
concern identified?
 Yes  No
c. If a concern was identified, has your child received
follow-up services?
 Yes
 No
II. ACTIVITIES
8. In the usual week, about how many days do you or any other family members read stories or look at
picture books with your child?  1-2 days  3-6 days  Every day  Never
9. On an average weekday, how much time does your child usually spend in front of a TV watching
videos,
TV programs, or playing video games?
 None  1 hour or less  2-3 hours  4 hours or more
Please mark the answer that best describes you. Always
Most of
the time
Some-
times
Never
Does Not
Apply to
Me
If NO, skip to
Number 8 below
20
IV. PARENTING
Thinking about your interactions with your child OVER THE
PAST MONTH, please mark the answer that best
describes you.
Always
Most of
the time
Some-
times
Never
18. I understand my child’s development.    
19. I am able to tell if my child is making progress.    
20. I know how to help my child develop and learn.    
21. I know how to help my child behave the way my
family would like.
   
22. I am able to help my child learn and practice new skills.    
23. I know what to expect of my child based on her/his age.    
24. I can handle problems that come up when taking
care of my child.
   
25. I believe I have the skills for being a good parent to
my child.
   
26. I am confident as a parent.    
10. For my toddler or preschooler, I provide 1-2 hours of
physical activity (for example, playing outside, sports,
dancing or running around) each day for my child.
    
11. I prepare healthy foods for my child.     
III. COMMUNITY RESOURCES
Thinking about you and your child OVER THE
PAST MONTH, please mark the answer that best
describes you.
Always
Most of
the time
Some-
times
Never
Does Not
Apply to
Me
12. I know how to get services that I need for
my child.
    
13. I am getting the services I need for my child.     
14. I talk to someone when I am worried about
my child.
    
15. I get my questions about parenting or
child development answered.
    
16. I have places I go to in my community to get
the resources I need.
    
17. I have places I go to in my community to
meet with other parents.
    
21
Appendix B:
Data Sources and Analysis Approach
22
Data Sources
Five primary data sources informed our analysis, summarized in the table below. All data are stored in
Persimmony.
Data Sources
Data Source Description Sample Characteristics
Parent Survey As described in the F5VC RFP, this “point-in-time” parent
survey, administered in Spring 2015, is designed to assess the
impact of multiple service interventions on parent knowledge
and access to resources, parenting activities and practices, as
well as child’s access to health services.
Of the approximately 7,000
surveys distributed, nearly
2,847 were completed, for a
response rate of roughly
40%.
Intake Forms
Client
Information
Participant
Questionnaire
The Client Information form includes client demographic
information such as gender, ethnicity, relationship to child,
primary language, and address.
The Participant Questionnaire includes questions about the
client’s family such as family income level, education levels,
marital status, and housing status.
Clients enrolling in F5VC services complete the Client
Information and Participant Questionnaire forms at intake.
To explore the
representativeness of the
survey data for the client
population served, we
exported intake and
questionnaire data for all
individuals who received
services during FY2014-2015.
Service Dosage
Information
F5VC provides broad range of services with a range of
dosages. We explored this information to inform our analysis.
In FY 2014-2015, 57,823
services were administered
by F5VC programs.
Desired Results
Developmental
Profile Pre-
School (DRDP)
Data
The DRDP is an assessment instrument developed by the
California Department of Education to measure
developmental progress for children from infancy to early
kindergarten across multiple measures, domains, and
developmental levels. F5VC utilizes the 2010 version of the
DRDP, which uses 43 measures to assess readiness in seven
areas: 1) self and social development; 2) language and literacy
development; 3) English language development; 4) cognitive
development; 5) mathematical development; 6) physical
development; and 7) health. For the report, we draw
exclusively on the pre-school DRDP data, which is
administered at least twice a year to all children enrolled in
pre-school programs, restricting our sample to children who
are age-eligible for kindergarten minus 1 year.
DRDP PS 2010 data file
contained 1,998 pre-, post-,
and interim assessment data
for children enrolled in pre-
school programs.
12
12
This analysis only includes children who are deemed “age-eligible” (those who were 4 years old by the age-
eligible date for kindergarten, which was September 1, 2014).
23
Data Source Description Sample Characteristics
Neighborhood-
level
Information
SPR utilized service records to determine the types of services
and unique clients served by program. We also worked with
F5VC to obtain more detailed NfL information, such as budget
data.
Available for all programs
Analysis Approach
We designed our analysis to align with the F5VC Evaluation Framework, which is taken from F5VC’s
FY2015-2020 Strategic Plan.13
As noted previously, the evaluation framework lists three key outcome
areas of interest: (1) access to care; (2) kindergarten readiness; and (3) parent knowledge of child
development, access to resources, and confidence. We took a multi-level approach to assessing
progress along these key outcome areas, mapping each individual survey question to specific outcome
indicators as well as developing composite scores, where appropriate, that include all questions mapped
to specific indicators as well as to the broader outcome areas associated with those indicators. Through
this multi-level approach, we can provide a fairly rich picture of the results, as it enables us to provide
higher-level summary findings at the outcome and indicator levels, supported by findings at the survey
question level. Our analysis includes an examination of overall findings at outcome and indicator levels,
as well as deeper levels of analysis to look for trends across population characteristics14
and service type.
For the analysis of DRDP data related to kindergarten readiness, we measured changes from pre- to
post-assessment scores for children in the sample who have both measures, as well as solely post-
assessment scores for all age-eligible children served by F5VC across all seven domains. The post-
assessment scores provide information about the number and percentage of age-eligible children F5VC
serves who are ready for kindergarten. For children who show room for growth on the DRDP pre-
assessment (i.e., who score below the integrating developmental level), our analysis of change between
pre- and post-test scores capture growth over the time period they participated in F5VC preschool
services. For both approaches, we explored trends in readiness by domain as well as participant
characteristics and service type.
13
Per discussions with F5VC, our analysis covers individuals who received services during FY2014-2015,
the period between July 1, 2014 through June 30, 2015.
13
14
In all outcome areas we examined results by race and ethnicity and language spoken at home (English/non-
English) as well as by program type. In the Findings section of this report, we share any findings along these
lines of analysis that show deviation from the norm and signal important differences in responses by
subgroups.
24
Appendix C:
Characteristics of Core Service Population
25
Child-Level Characteristics
Child Gender and Age. Fifty-two percent of the child population is male and 48% is female. Infants and
toddlers comprised the majority of the F5VC child service population at 64%. The age distribution is as follows:
Characteristic Received Services in
FY14-15
Survey Sample
Age Count Percent Count Percent
Under 1 year 883 13% 216 10%
1 Year 874 13% 270 12%
2 - 3 years 2,502 38% 1003 44%
4 - 5 years 2,296 35% 783 34%
Race/Ethnicity. The racial and ethnic composition of the child participant population was predominantly
Hispanic/Latino (76%), followed by White (15%) and multiracial (4%). Asians comprised 3% of the population,
1% was African American, and the remaining 2% had race recorded as “other” or “unknown.”
Characteristic Received Services in
FY14-15
Survey Sample
Race/ethnicity Count Percent Count Percent
Hispanic/Latino 4,873 76% 1,699 76%
White 937 15% 322 14%
Multiracial 272 4% 96 4%
Asian 183 3% 63 3%
Black 56 1% 17 1%
Other 125 2% 47 2%
Language Spoken at Home. The majority of the child service population spoke a language other than English at
home (61%). The top three languages spoken at home included Spanish (55%), English (39%), and Mixteco
(3%).
Characteristic Received Services in
FY14-15
Survey Sample
Language spoken at home Count Percent Count Percent
Spanish 3,579 55% 1,286 57%
English 2,549 39% 844 37%
Mixteco 214 3% 72 3%
Vietnamese 13 0% 7 0%
Other 129 2% 45 2%
Zip Code of Family Residence. Children served by F5VC accessed early childhood services throughout Ventura
county via a number of service delivery points, including preschool programs, countywide services (medical
and dental clinics), and NfL family resource centers. The largest percentage of children served resided in
26
Oxnard (34%), followed by Simi Valley (8%) and then Fillmore (7%). The following table depicts the distribution
of families by zip code.
Characteristic Received Services in
FY14-15
Survey Sample
Zip code of Family Residence (top 10) Count Percent Count Percent
93033 (Oxnard) 1,108 18% 428 20%
93030 (Oxnard) 625 10% 241 11%
93065 (Simi Valley) 496 8% 181 8%
93015 (Fillmore) 426 7% 130 6%
93021 (Moorpark) 392 6% 149 7%
93036 (Oxnard) 372 6% 159 7%
93060 (Santa Paula) 341 6% 61 3%
93001 (Ventura) 325 5% 139 6%
93010 (Camarillo) 275 5% 79 4%
93041 (Port Hueneme) 248 4% 92 4%
Family Level Characteristics15
Characteristic Received Services in
FY14-15
Survey Sample
Highest Education level in the Family Count Percent Count Percent
Less than high school 803 33% 299 38%
High School/GED 687 29% 197 25%
Some College 355 15% 101 13%
Associate’s Degree 142 6% 45 6%
Bachelor’s Degree 239 10% 83 10%
Grad/Professional 178 7% 68 9%
Family Income Level Count Percent Count Percent
Less than 10K 600 25% 182 24%
10-20K 558 23% 178 23%
20K-30K 473 19% 157 21%
30K-40K 255 10% 78 10%
40K-50K 156 6% 53 7%
50K-75K 184 8% 56 7%
75K – 100K 133 5% 30 4%
100K+ 83 3% 28 4%
Living Situation
In a single family residence 1,984 69% 614 68%
More than 1 family in a house 899 31% 290 32%
Other 13 0% 0 0%
Marital Status
Married or domestic partnership 2,175 80% 686 80%
Single parent household 500 18% 154 18%
Other 60 2% 22 3%
15
Due to differences in data fields between previous intake forms and the current intake form, this table only includes
data from Persimonny and excludes legacy data from the GEMS system.
27
Family Size
1 child 1,62416
57% 506 57%
2 children 954 34% 313 35%
3 or more children 227 8% 63 7%
16
36 families reported having 0 children at intake; within the survey sample, 11 families reported having 0 children.
28
Appendix D:
Services Administered by Program Type
29
First 5 funded partners provided a range of services to children and their families in FY14-15. As seen in the
table below, preschool expansion programs solely provided preschool services, countywide programs offered
preschool, case management, oral health, and developmental screening services, and NfLs provided all
services except Oral Health services.
Service NfL
Countywide
Programs
Preschool
Expansion Total
EL PACT & Family/Caregiver Literacy Programs 29,617 0 0 29,617
Preschool 7,216 4,194 699 12,109
Service Coordination/Case Management 7,510 390 0 7,900
Parenting Education 4,653 0 0 4,653
Oral Health 0 1,674 0 1,674
Developmental Screenings (ASQ) 123 815 0 938
Kindergarten Transition for Children 711 0 0 711
Kindergarten Transition for Parents 413 0 0 413
Nutrition and Fitness 349 0 0 349
Early Intervention for Children (Preschool) 154 0 0 154
Community R & R 102 0 0 102
Health Insurance Enrollment 4 0 0 4
Total 50,852 7,073 699 58,624

More Related Content

What's hot

Adding complexity to an already difficult task: Monitoring the impact of the ...
Adding complexity to an already difficult task: Monitoring the impact of the ...Adding complexity to an already difficult task: Monitoring the impact of the ...
Adding complexity to an already difficult task: Monitoring the impact of the ...
soder145
 
Cdc activities-reducing-fasd-fact-sheet-508
Cdc activities-reducing-fasd-fact-sheet-508Cdc activities-reducing-fasd-fact-sheet-508
Cdc activities-reducing-fasd-fact-sheet-508
PrithwiGhosh1
 
Changing Trends in Employer Sponsored Insurance After the Affordable Care Act
Changing Trends in Employer Sponsored Insurance After the Affordable Care ActChanging Trends in Employer Sponsored Insurance After the Affordable Care Act
Changing Trends in Employer Sponsored Insurance After the Affordable Care Act
soder145
 
Direct Certification and CEP, August 2016
Direct Certification and CEP, August 2016Direct Certification and CEP, August 2016
Direct Certification and CEP, August 2016
Nevada Agriculture
 
Pingree letter 12-3-15
Pingree letter 12-3-15Pingree letter 12-3-15
Pingree letter 12-3-15
Mary Beth Levin
 
Shadac acs cps-webinar 2016-final_sept21
Shadac acs cps-webinar 2016-final_sept21Shadac acs cps-webinar 2016-final_sept21
Shadac acs cps-webinar 2016-final_sept21
soder145
 
2014 SAHIE: Overview with Census Experts
2014 SAHIE: Overview with Census Experts2014 SAHIE: Overview with Census Experts
2014 SAHIE: Overview with Census Experts
soder145
 
COMMUNICATING THE IMPACT OF CURRENT AND EMMERGING POLICIES (2)
COMMUNICATING THE IMPACT OF CURRENT AND EMMERGING POLICIES (2)COMMUNICATING THE IMPACT OF CURRENT AND EMMERGING POLICIES (2)
COMMUNICATING THE IMPACT OF CURRENT AND EMMERGING POLICIES (2)
Eric Benjamin MLS(Nig), MPH(USA)
 
Contrasting Measures of Health Insurance Literacy and their Relationship to H...
Contrasting Measures of Health Insurance Literacy and their Relationship to H...Contrasting Measures of Health Insurance Literacy and their Relationship to H...
Contrasting Measures of Health Insurance Literacy and their Relationship to H...
soder145
 
Physician Participation in Medi-Cal: Is Supply Meeting Demand?
Physician Participation in Medi-Cal: Is Supply Meeting Demand? Physician Participation in Medi-Cal: Is Supply Meeting Demand?
Physician Participation in Medi-Cal: Is Supply Meeting Demand?
soder145
 
Pres acs workshop_june14_call
Pres acs workshop_june14_callPres acs workshop_june14_call
Pres acs workshop_june14_call
soder145
 
Peerfinity | Client Therapy
Peerfinity | Client TherapyPeerfinity | Client Therapy
Peerfinity | Client Therapy
SkiFi Designs
 
Hospitals: Tactics for Getting Uninsured Patients Covered in the Marketplace
Hospitals: Tactics for Getting Uninsured Patients Covered in the MarketplaceHospitals: Tactics for Getting Uninsured Patients Covered in the Marketplace
Hospitals: Tactics for Getting Uninsured Patients Covered in the Marketplace
Enroll America
 
2015 April GrayReports - Student Demand Trends
2015 April GrayReports - Student Demand Trends2015 April GrayReports - Student Demand Trends
2015 April GrayReports - Student Demand Trends
Gray Associates, Inc
 
Highlights from the Field: NCC Mini-Grants
Highlights from the Field: NCC Mini-GrantsHighlights from the Field: NCC Mini-Grants
Highlights from the Field: NCC Mini-Grants
National Chlamydia Coalition
 
Health Access Report
Health Access ReportHealth Access Report
Health Access Report
John Stern
 
Health and Health Care for Blacks in the United States - Updated January 2018
Health and Health Care for Blacks in the United States - Updated January 2018Health and Health Care for Blacks in the United States - Updated January 2018
Health and Health Care for Blacks in the United States - Updated January 2018
KFF
 
Substance abuse-profile-2015
Substance abuse-profile-2015Substance abuse-profile-2015
Substance abuse-profile-2015
satoriwatersfl
 
Slideshare data sharing
Slideshare data sharingSlideshare data sharing
Slideshare data sharing
Diana Rubin
 
Pres acs workshop_june14_call
Pres acs workshop_june14_callPres acs workshop_june14_call
Pres acs workshop_june14_call
soder145
 

What's hot (20)

Adding complexity to an already difficult task: Monitoring the impact of the ...
Adding complexity to an already difficult task: Monitoring the impact of the ...Adding complexity to an already difficult task: Monitoring the impact of the ...
Adding complexity to an already difficult task: Monitoring the impact of the ...
 
Cdc activities-reducing-fasd-fact-sheet-508
Cdc activities-reducing-fasd-fact-sheet-508Cdc activities-reducing-fasd-fact-sheet-508
Cdc activities-reducing-fasd-fact-sheet-508
 
Changing Trends in Employer Sponsored Insurance After the Affordable Care Act
Changing Trends in Employer Sponsored Insurance After the Affordable Care ActChanging Trends in Employer Sponsored Insurance After the Affordable Care Act
Changing Trends in Employer Sponsored Insurance After the Affordable Care Act
 
Direct Certification and CEP, August 2016
Direct Certification and CEP, August 2016Direct Certification and CEP, August 2016
Direct Certification and CEP, August 2016
 
Pingree letter 12-3-15
Pingree letter 12-3-15Pingree letter 12-3-15
Pingree letter 12-3-15
 
Shadac acs cps-webinar 2016-final_sept21
Shadac acs cps-webinar 2016-final_sept21Shadac acs cps-webinar 2016-final_sept21
Shadac acs cps-webinar 2016-final_sept21
 
2014 SAHIE: Overview with Census Experts
2014 SAHIE: Overview with Census Experts2014 SAHIE: Overview with Census Experts
2014 SAHIE: Overview with Census Experts
 
COMMUNICATING THE IMPACT OF CURRENT AND EMMERGING POLICIES (2)
COMMUNICATING THE IMPACT OF CURRENT AND EMMERGING POLICIES (2)COMMUNICATING THE IMPACT OF CURRENT AND EMMERGING POLICIES (2)
COMMUNICATING THE IMPACT OF CURRENT AND EMMERGING POLICIES (2)
 
Contrasting Measures of Health Insurance Literacy and their Relationship to H...
Contrasting Measures of Health Insurance Literacy and their Relationship to H...Contrasting Measures of Health Insurance Literacy and their Relationship to H...
Contrasting Measures of Health Insurance Literacy and their Relationship to H...
 
Physician Participation in Medi-Cal: Is Supply Meeting Demand?
Physician Participation in Medi-Cal: Is Supply Meeting Demand? Physician Participation in Medi-Cal: Is Supply Meeting Demand?
Physician Participation in Medi-Cal: Is Supply Meeting Demand?
 
Pres acs workshop_june14_call
Pres acs workshop_june14_callPres acs workshop_june14_call
Pres acs workshop_june14_call
 
Peerfinity | Client Therapy
Peerfinity | Client TherapyPeerfinity | Client Therapy
Peerfinity | Client Therapy
 
Hospitals: Tactics for Getting Uninsured Patients Covered in the Marketplace
Hospitals: Tactics for Getting Uninsured Patients Covered in the MarketplaceHospitals: Tactics for Getting Uninsured Patients Covered in the Marketplace
Hospitals: Tactics for Getting Uninsured Patients Covered in the Marketplace
 
2015 April GrayReports - Student Demand Trends
2015 April GrayReports - Student Demand Trends2015 April GrayReports - Student Demand Trends
2015 April GrayReports - Student Demand Trends
 
Highlights from the Field: NCC Mini-Grants
Highlights from the Field: NCC Mini-GrantsHighlights from the Field: NCC Mini-Grants
Highlights from the Field: NCC Mini-Grants
 
Health Access Report
Health Access ReportHealth Access Report
Health Access Report
 
Health and Health Care for Blacks in the United States - Updated January 2018
Health and Health Care for Blacks in the United States - Updated January 2018Health and Health Care for Blacks in the United States - Updated January 2018
Health and Health Care for Blacks in the United States - Updated January 2018
 
Substance abuse-profile-2015
Substance abuse-profile-2015Substance abuse-profile-2015
Substance abuse-profile-2015
 
Slideshare data sharing
Slideshare data sharingSlideshare data sharing
Slideshare data sharing
 
Pres acs workshop_june14_call
Pres acs workshop_june14_callPres acs workshop_june14_call
Pres acs workshop_june14_call
 

Viewers also liked

Ergonomia
ErgonomiaErgonomia
Ergonomia
Ser O Nada
 
Networking with Twitter, Part 2
Networking with Twitter, Part 2Networking with Twitter, Part 2
Networking with Twitter, Part 2
Dennis Lembree
 
Emerging technologies for the classroom
Emerging technologies for the classroomEmerging technologies for the classroom
Emerging technologies for the classroom
Jason Redman
 
El pooder y sus conflictos
El pooder y sus conflictosEl pooder y sus conflictos
El pooder y sus conflictos
Valentina Torreslanda
 
Water Conditioner
Water Conditioner Water Conditioner
Water Conditioner
Autofill Systems
 
Front cover progress
Front cover progressFront cover progress
Front cover progress
Emily852
 
Truyện Dragon ball tập 5
Truyện Dragon ball tập 5Truyện Dragon ball tập 5
Truyện Dragon ball tập 5
Đặng Ngọc Thọ
 
Dps progress
Dps progressDps progress
Dps progress
Emily852
 
Income tax act 1961
Income tax act 1961Income tax act 1961
Income tax act 1961
rajusnarayananfcid
 
Linear integral equations -rainer kress
Linear integral equations -rainer kressLinear integral equations -rainer kress
Linear integral equations -rainer kress
Eduardo Espinosa Perez
 
Prawo Do żYcia
Prawo Do żYciaPrawo Do żYcia
Prawo Do żYciaparakletpl
 
Web Science. An introduction
Web Science. An introductionWeb Science. An introduction
Web Science. An introduction
Marco Brambilla
 
Asfalto. Pavimentos. Karen Peralta CI 22998896
Asfalto. Pavimentos. Karen Peralta CI 22998896Asfalto. Pavimentos. Karen Peralta CI 22998896
Asfalto. Pavimentos. Karen Peralta CI 22998896
karenpf03
 
Model driven software engineering in practice book - Chapter 9 - Model to tex...
Model driven software engineering in practice book - Chapter 9 - Model to tex...Model driven software engineering in practice book - Chapter 9 - Model to tex...
Model driven software engineering in practice book - Chapter 9 - Model to tex...
Marco Brambilla
 
đầU tư xây dựng các công trình dịch vụ phục vụ nhu cầu phát triển cảng hk quố...
đầU tư xây dựng các công trình dịch vụ phục vụ nhu cầu phát triển cảng hk quố...đầU tư xây dựng các công trình dịch vụ phục vụ nhu cầu phát triển cảng hk quố...
đầU tư xây dựng các công trình dịch vụ phục vụ nhu cầu phát triển cảng hk quố...
Lập Dự Án Đầu Tư Thảo Nguyên Xanh
 

Viewers also liked (15)

Ergonomia
ErgonomiaErgonomia
Ergonomia
 
Networking with Twitter, Part 2
Networking with Twitter, Part 2Networking with Twitter, Part 2
Networking with Twitter, Part 2
 
Emerging technologies for the classroom
Emerging technologies for the classroomEmerging technologies for the classroom
Emerging technologies for the classroom
 
El pooder y sus conflictos
El pooder y sus conflictosEl pooder y sus conflictos
El pooder y sus conflictos
 
Water Conditioner
Water Conditioner Water Conditioner
Water Conditioner
 
Front cover progress
Front cover progressFront cover progress
Front cover progress
 
Truyện Dragon ball tập 5
Truyện Dragon ball tập 5Truyện Dragon ball tập 5
Truyện Dragon ball tập 5
 
Dps progress
Dps progressDps progress
Dps progress
 
Income tax act 1961
Income tax act 1961Income tax act 1961
Income tax act 1961
 
Linear integral equations -rainer kress
Linear integral equations -rainer kressLinear integral equations -rainer kress
Linear integral equations -rainer kress
 
Prawo Do żYcia
Prawo Do żYciaPrawo Do żYcia
Prawo Do żYcia
 
Web Science. An introduction
Web Science. An introductionWeb Science. An introduction
Web Science. An introduction
 
Asfalto. Pavimentos. Karen Peralta CI 22998896
Asfalto. Pavimentos. Karen Peralta CI 22998896Asfalto. Pavimentos. Karen Peralta CI 22998896
Asfalto. Pavimentos. Karen Peralta CI 22998896
 
Model driven software engineering in practice book - Chapter 9 - Model to tex...
Model driven software engineering in practice book - Chapter 9 - Model to tex...Model driven software engineering in practice book - Chapter 9 - Model to tex...
Model driven software engineering in practice book - Chapter 9 - Model to tex...
 
đầU tư xây dựng các công trình dịch vụ phục vụ nhu cầu phát triển cảng hk quố...
đầU tư xây dựng các công trình dịch vụ phục vụ nhu cầu phát triển cảng hk quố...đầU tư xây dựng các công trình dịch vụ phục vụ nhu cầu phát triển cảng hk quố...
đầU tư xây dựng các công trình dịch vụ phục vụ nhu cầu phát triển cảng hk quố...
 

Similar to First5-Final-Report

281Healthcare P
281Healthcare P281Healthcare P
281Healthcare P
bartholomeocoombs
 
Assessing a Healthcare Program Policy Evaluation.docx
Assessing a Healthcare Program Policy Evaluation.docxAssessing a Healthcare Program Policy Evaluation.docx
Assessing a Healthcare Program Policy Evaluation.docx
write22
 
Sapelo Grant Proposal
Sapelo Grant ProposalSapelo Grant Proposal
Sapelo Grant Proposal
Landry Goodgame
 
initial_findings_rprt_final
initial_findings_rprt_finalinitial_findings_rprt_final
initial_findings_rprt_final
Megan Hawley
 
Ct Naeyc Systems And#B31 Cc4
Ct Naeyc Systems And#B31 Cc4Ct Naeyc Systems And#B31 Cc4
Ct Naeyc Systems And#B31 Cc4
NorwalkNet
 
Child outcomes bulletin_2010--supporting_methodology
Child outcomes bulletin_2010--supporting_methodologyChild outcomes bulletin_2010--supporting_methodology
Child outcomes bulletin_2010--supporting_methodology
mfmzk5
 
Updates from Maternal Infant and Early Childhood Home Visiting
Updates from Maternal Infant and Early Childhood Home VisitingUpdates from Maternal Infant and Early Childhood Home Visiting
Updates from Maternal Infant and Early Childhood Home Visiting
Children’s Trust of South Carolina
 
Capstone Final Paper
Capstone Final PaperCapstone Final Paper
Capstone Final Paper
Samantha Petersen
 
Female Community Health Volunteers in Nepal: What We Know and Steps Going For...
Female Community Health Volunteers in Nepal: What We Know and Steps Going For...Female Community Health Volunteers in Nepal: What We Know and Steps Going For...
Female Community Health Volunteers in Nepal: What We Know and Steps Going For...
JSI
 
2 0 1 6 S t a t e Fa c t S h e e t sChild Care in America.docx
2 0 1 6  S t a t e  Fa c t  S h e e t sChild Care in America.docx2 0 1 6  S t a t e  Fa c t  S h e e t sChild Care in America.docx
2 0 1 6 S t a t e Fa c t S h e e t sChild Care in America.docx
vickeryr87
 
New York State Policy on Child Welfare and Two-Generation Approaches
New York State Policy on Child Welfare and Two-Generation ApproachesNew York State Policy on Child Welfare and Two-Generation Approaches
New York State Policy on Child Welfare and Two-Generation Approaches
Francesca Vescia (she/her)
 
Bus226FinalProject-2
Bus226FinalProject-2Bus226FinalProject-2
Bus226FinalProject-2
Colton Goertzen
 
Article one Lethal injection -electronic resource- -.docx
Article one         Lethal injection -electronic resource- -.docxArticle one         Lethal injection -electronic resource- -.docx
Article one Lethal injection -electronic resource- -.docx
noel23456789
 
Early 1 in 5 children in rural areas in U.S.have a developmental disability
Early 1 in 5 children in rural areas in U.S.have a developmental disabilityEarly 1 in 5 children in rural areas in U.S.have a developmental disability
Early 1 in 5 children in rural areas in U.S.have a developmental disability
Δρ. Γιώργος K. Κασάπης
 
Assessment on the allocation of Cash Grants of 4Ps beneficiaries to their dai...
Assessment on the allocation of Cash Grants of 4Ps beneficiaries to their dai...Assessment on the allocation of Cash Grants of 4Ps beneficiaries to their dai...
Assessment on the allocation of Cash Grants of 4Ps beneficiaries to their dai...
IJAEMSJORNAL
 
Hajati Programme: "My Needs, Our Future"
Hajati Programme: "My Needs, Our Future"Hajati Programme: "My Needs, Our Future"
Hajati Programme: "My Needs, Our Future"
UNICEF Office of Research - Innocenti
 
DFCS Afterschool Powerpoint-Director Bobby Cagle
DFCS Afterschool Powerpoint-Director Bobby CagleDFCS Afterschool Powerpoint-Director Bobby Cagle
DFCS Afterschool Powerpoint-Director Bobby Cagle
Georgia Statewide Afterschool Network
 
Evaluating Impact of OVC Programs: Standardizing our methods
Evaluating Impact of OVC Programs: Standardizing our methodsEvaluating Impact of OVC Programs: Standardizing our methods
Evaluating Impact of OVC Programs: Standardizing our methods
MEASURE Evaluation
 
Targeted Evaluation of Five Programs Supporting Orphans and Vulnerable Childr...
Targeted Evaluation of Five Programs Supporting Orphans and Vulnerable Childr...Targeted Evaluation of Five Programs Supporting Orphans and Vulnerable Childr...
Targeted Evaluation of Five Programs Supporting Orphans and Vulnerable Childr...
MEASURE Evaluation
 
Strengthening Families in Drug Treatment Court: Tompkins County, 2014-2018
Strengthening Families in Drug Treatment Court: Tompkins County, 2014-2018Strengthening Families in Drug Treatment Court: Tompkins County, 2014-2018
Strengthening Families in Drug Treatment Court: Tompkins County, 2014-2018
Francesca Vescia (she/her)
 

Similar to First5-Final-Report (20)

281Healthcare P
281Healthcare P281Healthcare P
281Healthcare P
 
Assessing a Healthcare Program Policy Evaluation.docx
Assessing a Healthcare Program Policy Evaluation.docxAssessing a Healthcare Program Policy Evaluation.docx
Assessing a Healthcare Program Policy Evaluation.docx
 
Sapelo Grant Proposal
Sapelo Grant ProposalSapelo Grant Proposal
Sapelo Grant Proposal
 
initial_findings_rprt_final
initial_findings_rprt_finalinitial_findings_rprt_final
initial_findings_rprt_final
 
Ct Naeyc Systems And#B31 Cc4
Ct Naeyc Systems And#B31 Cc4Ct Naeyc Systems And#B31 Cc4
Ct Naeyc Systems And#B31 Cc4
 
Child outcomes bulletin_2010--supporting_methodology
Child outcomes bulletin_2010--supporting_methodologyChild outcomes bulletin_2010--supporting_methodology
Child outcomes bulletin_2010--supporting_methodology
 
Updates from Maternal Infant and Early Childhood Home Visiting
Updates from Maternal Infant and Early Childhood Home VisitingUpdates from Maternal Infant and Early Childhood Home Visiting
Updates from Maternal Infant and Early Childhood Home Visiting
 
Capstone Final Paper
Capstone Final PaperCapstone Final Paper
Capstone Final Paper
 
Female Community Health Volunteers in Nepal: What We Know and Steps Going For...
Female Community Health Volunteers in Nepal: What We Know and Steps Going For...Female Community Health Volunteers in Nepal: What We Know and Steps Going For...
Female Community Health Volunteers in Nepal: What We Know and Steps Going For...
 
2 0 1 6 S t a t e Fa c t S h e e t sChild Care in America.docx
2 0 1 6  S t a t e  Fa c t  S h e e t sChild Care in America.docx2 0 1 6  S t a t e  Fa c t  S h e e t sChild Care in America.docx
2 0 1 6 S t a t e Fa c t S h e e t sChild Care in America.docx
 
New York State Policy on Child Welfare and Two-Generation Approaches
New York State Policy on Child Welfare and Two-Generation ApproachesNew York State Policy on Child Welfare and Two-Generation Approaches
New York State Policy on Child Welfare and Two-Generation Approaches
 
Bus226FinalProject-2
Bus226FinalProject-2Bus226FinalProject-2
Bus226FinalProject-2
 
Article one Lethal injection -electronic resource- -.docx
Article one         Lethal injection -electronic resource- -.docxArticle one         Lethal injection -electronic resource- -.docx
Article one Lethal injection -electronic resource- -.docx
 
Early 1 in 5 children in rural areas in U.S.have a developmental disability
Early 1 in 5 children in rural areas in U.S.have a developmental disabilityEarly 1 in 5 children in rural areas in U.S.have a developmental disability
Early 1 in 5 children in rural areas in U.S.have a developmental disability
 
Assessment on the allocation of Cash Grants of 4Ps beneficiaries to their dai...
Assessment on the allocation of Cash Grants of 4Ps beneficiaries to their dai...Assessment on the allocation of Cash Grants of 4Ps beneficiaries to their dai...
Assessment on the allocation of Cash Grants of 4Ps beneficiaries to their dai...
 
Hajati Programme: "My Needs, Our Future"
Hajati Programme: "My Needs, Our Future"Hajati Programme: "My Needs, Our Future"
Hajati Programme: "My Needs, Our Future"
 
DFCS Afterschool Powerpoint-Director Bobby Cagle
DFCS Afterschool Powerpoint-Director Bobby CagleDFCS Afterschool Powerpoint-Director Bobby Cagle
DFCS Afterschool Powerpoint-Director Bobby Cagle
 
Evaluating Impact of OVC Programs: Standardizing our methods
Evaluating Impact of OVC Programs: Standardizing our methodsEvaluating Impact of OVC Programs: Standardizing our methods
Evaluating Impact of OVC Programs: Standardizing our methods
 
Targeted Evaluation of Five Programs Supporting Orphans and Vulnerable Childr...
Targeted Evaluation of Five Programs Supporting Orphans and Vulnerable Childr...Targeted Evaluation of Five Programs Supporting Orphans and Vulnerable Childr...
Targeted Evaluation of Five Programs Supporting Orphans and Vulnerable Childr...
 
Strengthening Families in Drug Treatment Court: Tompkins County, 2014-2018
Strengthening Families in Drug Treatment Court: Tompkins County, 2014-2018Strengthening Families in Drug Treatment Court: Tompkins County, 2014-2018
Strengthening Families in Drug Treatment Court: Tompkins County, 2014-2018
 

First5-Final-Report

  • 1. Findings from First 5 Ventura County’s 2015 Parent Survey Prepared by: Rachel Estrella, PhD Lydia Nash 9
  • 2.
  • 3. 1 Introduction SPR is pleased to submit this evaluation report of the findings yielded from an extensive analysis of First 5 Ventura County’s (F5VC’s) Parent Survey, which was distributed for the first time to approximately 7,000 F5VC participants in spring 2015. The survey was designed to explore the relationship between participant and program characteristics and progress towards three key F5VC outcomes articulated in the First 5 Commission’s Evaluation Framework: access to care; kindergarten readiness; and knowledge of child development, resources, and parenting. SPR’s goal in this comprehensive survey analysis, which also included an analysis of intake and service data, is to help F5VC make meaning of the results in ways that will support its continuous efforts to strengthen and improve its programs and to measure progress towards desired outcomes. This report begins with background information on the Parent Survey and how it aligns with F5VC’s mission. We then provide an overview of our methods, including a brief discussion of our overall goals, our approach to the analysis, and our work with F5VC and data sources used in the analysis. The subsequent section provides detailed information about key characteristics of survey respondents, as well as comparison statistics against larger F5VC service population to illustrate the representative nature of the survey sample. This is followed by a section describing survey results and key findings. The report concludes with a brief discussion of areas for consideration as F5VC continues to refine the survey and the survey implementation process to continue to illuminate progress towards key outcomes. Background F5VC’s overarching programmatic goals are to ensure that (1) children are healthy, (2) children have language and social-emotional skills, and (3) families have the resources they need. To that end, F5VC is using the Parent Survey as a primary instrument to measure progress towards three key outcomes aligned with their goals: (1) access to care; (2) school readiness prior to kindergarten; and (3) parent/family knowledge of child development, resources and parenting. The Parent Survey contains 26 questions, divided into four sections: (1) Health and Screening, (2) Activities, (3) Community Resources, and (4) Parenting. A copy of the full Parent Survey is included in Appendix A, followed by an explanation of our methods and approach, included as Appendix B. Methods SPR took a collaborative and iterative approach to this analysis, working closely with F5VC to review data quality, address issues related to data matching, and to ensure continued alignment of purpose. This collaborative approach was critical to ensuring accuracy and shared understanding, particularly given that this was the first year of Parent Survey implementation as well as F5VC’s first year working in a new data management system--Persimmony.1 Our goals are to examine what the survey data can tell us about progress towards F5VC’s three key outcomes, and to make meaning of the data in ways that 1 Last year, F5VC transitioned its client records and comprehensive data collection system from Mosaic’s Grants Evaluation Management System over to Persimmony, an online data management solution used by 19 other First 5 programs in California.
  • 4. 2 support F5VCs continuous improvement efforts. Five data sources informed our analysis: results from the parent survey, client intake forms, participant questionnaires, service dosage information, and the Desired Results Developmental Profile (DRDP) for preschool. A full list of data sources, as well as a description of our analysis approach, are included in Appendix B. Profile of Children and Families In order to contextualize the findings from our analysis of the Parent Survey results, it is important to have an understanding of F5VC’s service population. To that end, in this section we provide information on the children and families served by F5VC and an analysis of key characteristics of this population. While this section focuses on the broader F5VC service population, findings from our analysis will be based on the survey sample, which our analysis concludes is representative of the larger service population in terms of the key demographics shared in the sections below focused on number and characteristics of children and families served. Tables providing more detailed information on key characteristics of F5VC’s service population and the survey sample are included in Appendix C. Number and Characteristics of Children Served In FY 2014-15, F5VC provided services to 6,555 children.2 Key characteristics of this service population are described below.  Child Gender and Age. Fifty-two percent of the child population is male and 48% is female. Infants and toddlers comprised the majority of the F5VC child service population at 64%.  Race/Ethnicity. The racial and ethnic composition of the child participant population was predominantly Hispanic/Latino (76%), followed by White (15%) and multiracial (4%). Asians 2 This number does not capture all children touched by the multitude of services, supports, and activities offered through F5VC. Rather, it represents F5VC’s core child clients, i.e. clients for whom they provide more intensive services and whose demographic information and services received are tracked in Persimmony, F5VC’s client database. 1% 2% 3% 4% 15% 76% Black Other Asian Multiracial White Hispanic/Latino Race/Ethnicity of Children Served < 0% 2% 3% 39% 55% Vietnamese Other Mixteco English Spanish Home Language of Children Served 13% 13% 38% 35% Under 1 year 1 Year 2 - 3 years 4 - 5 years Age of Children Served
  • 5. 3 comprised 3% of the population, 1% was African American, and the remaining 2% had race recorded as “other” or “unknown.”  Language Spoken at Home. The majority of the child service population spoke a language other than English at home (61%). The top three languages spoken at home included Spanish (55%), English (39%), and Mixteco (3%).  Zip Code of Family Residence. Children served by F5VC accessed early childhood services throughout Ventura county via a number of service delivery points, including preschool programs, countywide services (medical and dental clinics), and NfL family resource centers. The largest percentage of children served resided in Oxnard (34%), followed by Simi Valley (8%) and then Fillmore (7%). The table above depicts the distribution of families by zip code. Number and Characteristics of Parent/Caregivers and Families Served The characteristics of families served by F5VC during FY-15 are as follows:  Marital status. Eighty percent of families served in FY 2014-2015 represented married couples or those in a domestic partnership, 18% were a single parent household, and 2% identified as “other.”  Housing. Sixty-nine percent lived in a single family residence and 31% lived in a situation wherein more than one family shared a home.  Children per family. Fifty-seven percent of families had one child at the time of program intake, 34% had 2 children, had 8% had 3 or more children.  Parent/caregiver education levels. Approximately one-third of families included a parent or primary caregiver whose highest education level was less than a high school degree. Only 17% had a parent or caregiver whose highest education level included a Bachelor’s degree or higher.  Family income levels. Almost half of the families served by F5VC in FY 14-15 earned less than $20,000 per year. One quarter of the families learned less than $10,000 per year. Ninety-one 18% 10% 8% 7% 6% 6% 6% 5% 5% 4% 93033 (Oxnard) 93030 (Oxnard) 93065 (Simi Valley) 93015 (Fillmore) 93021 (Moorpark) 93036 (Oxnard) 93060 (Santa Paula) 93001 (Ventura) 93010 (Camarillo) 93041 (Port Hueneme) Zip Code of Family Residence (top 10 only)
  • 6. 4 percent of families served made less than the median family income for Ventura County ($76,544).3 Number and mix of Services Received In FY 2014-15 a total of 58,624 services were provided to 7,412 First 5 Ventura County client families. These services fell under three broad types: county-wide services (e.g. oral health services); preschool expansion services; and the wide range of services offered through F5VC’s 11 Neighborhoods for Learning (NfLs). A table of services analyzed in service of this report, categorized by program type, is included in Appendix D. The tables below provide information on the number of services received by clients as well as the services most frequently received by families. 3 Source, U.S. Census Quick Facts. Median Family Income in Ventura County, 2009-2013. 15% 17% 12% 8% 14% 35% 0% 10% 20% 30% 40% 11+ services 6-10 services 4-5 services 3 services 2 services 1 service Numberof Services Received by Clients (3,883) (885) (1,349) (1,854) (1,707) (1,524) 2% 3% 8% 13% 21% 51% 0% 20% 40% 60% Developmental Screenings (ASQ) Oral Health ParentingEducation Service Coordination/Case Management Preschool EL PACT (Early Learning for Parents and Children Together) & Family Literacy Programs Services Most Frequently Received in FY14-15 (29,617) (1,674) (4,653) (7,900) (12,109) (938) EL PACT (Early Learning for Parents and Children Together) & Family Literacy Programs
  • 7. 5 Key findings around number and types of services received include:  On average, individual clients received 5.2 services during FY14-15. NfL clients received 5.9 services on average, whereas preschool expansion clients received 5.3 services, and countywide clients received 2.8 services. On average, families received 7.9 services during FY14-15.  Thirty-five percent of clients received only one service from F5VC during FY14-15. The service that was most frequently utilized by one-service clients was EL PACT (30%).  Of the clients who received more than one service, most clients (68%) only engage in one type of service (i.e. county-wide service, preschool expansion, or services provided through NfLs).  Of the clients who received multiple services across multiple types of services, the three most frequently utilized services were (1) EL PACT classes, (2) Parenting Education classes, and (3) Service Coordination/Case Management. The most frequent combination of services received is EL PACT classes and Parenting Education classes. Although the survey was representative of the universe of clients in terms of demographics, home language, family income, and age, survey respondents’ intensity (number of services received) and mix of services received was not representative of the larger client population. In particular, the number of families who received more than 5 services in FY14-15 is overrepresented and the number of families who received 1-2 services is underrepresented. Specifically, 23% of families within the universe of clients received 11+ services, whereas 44% of the survey population received 11+ services. Therefore, in the subsequent findings section, any findings shared from lines of analysis regarding services received only apply to the survey population and cannot be extrapolated to the entire universe of clients receiving services in FY14-15. Findings In this section we present findings on progress made in F5VC’s three key outcome areas, based on parent survey results and preschool DRDP data. For each outcome, we provide outcome-level findings, followed by findings at the indicator level. We also share findings in areas where analyses of results by participant characteristics or program type yield interesting variations by subgroup. Similarly, we also include findings related to intensity and mix of services, in areas where those lines of analyses yielded meaningful information. Again, because the sample was not representative of the larger First 5 population in terms of intensity or mix of services, we cannot generalize related findings to the broader population. Outcome 1: Access to Care The four indicators mapped to access to care include 1) access to health insurance; 2) access to (and consistent use of) medical care providers; 3) levels of physical activity and nutrition; and 4) access to (and consistent use of) oral healthcare providers. Nine questions in the parent survey and two questions from the Intake Questionnaire map to this outcome area and are incorporated into the analysis. The table below includes summary statistics across the 2,274 children whose parents provided information on them in the parent survey. In addition to providing question-level results from the survey, the table also includes indicator- and outcome-level composite measures to enable the reader to quickly see progress at multiple levels. For all measures except question 9, results reflect the mean
  • 8. 6 percentages of parents who responded “Yes” to the questions in this outcome area. For question 9, the results reflect the mean percentage of parents who selected either “none” or “1 hour or less” as a response. Indicator Questions Mean #/% of previously uninsured children who are enrolled in health insurance  Q3: Does your child currently have health insurance? 97% #/% of children who have and use a regular place for medical care  Q1: Do you have a usual place to go when your child is sick or you need health advice? 97%  Q2: Did your child have a routine check-up in the last 12 months? 96% COMPOSITE 4 91% #/% of parents reporting regular physical activity and healthy eating for their children  Q9: On an average weekday, how much time does your child usually spend in front of a TV watching videos, TV programs, or playing video games? (selected None or 1 Hour or less) 49%  Q10: For my toddler or preschooler, I provide 1-2 hours of physical activity (for example, playing outside, sports, dancing or running around) each day for my child. 84%  Q11: I prepare healthy foods for my child. 93% COMPOSITE (percentage based on Q10 and Q11) 74% #/% of children who have and utilize a regular place for oral health care 5  Q5: Did your child have a dental exam in the last 6 months? 78%  Q6: Does your child have a regular dentist? 78% COMPOSITE (Q5 and Q6 = yes) 69% COMPOSITE Based on indicators 74% Overall, an average of 74% of parents surveyed reported positive findings in the Access to Care outcome area. There was a great deal of variation at the indicator level, with indicators around health insurance enrollment and access to a regular place for medical care yielding particularly strong results, and indicators for regular physical activity and healthy eating, as well as having a regular place for oral health care yielding mixed and generally less positive results. Analyses of intensity and mix of services yielded no meaningful findings at either the outcome or indicator levels. Below we share key findings at the indicator level. Results within Indicator 1 (Insurance Enrollment) were extremely strong. Results to the survey questions mapped to this indicator are very positive. Some key findings include:  97% of respondents reported that their children have health insurance, compared to 90% at the time of intake. (The survey does not ask about insurance type.) 4 The composite measure for this indicator required the respondent to select yes to both question 1 and 2.
  • 9. 7  Only 183 children associated with survey respondents did not have insurance at the time of intake. Of those, (87%) had insurance by the time the survey was administered.6 Findings from deeper levels of analysis:  Analyses by demographic subgroups yielded no notable variations in findings.  Some differences were found by program type—e.g. 92% of children receiving NfL services who did not have insurance at the time of intake had insurance by the time the parent survey was administered, compared to 83% of those who received countywide services. Results within Indicator 2 (Regular Place for Medical Care) were extremely strong. Results to survey questions mapped to this indicator are very positive. Key findings include:  Ninety-seven percent of survey respondents reported having a regular place to go when their children are sick or when they need medical advice  Ninety-six percent of respondents reported that their child had a routine medical examination within the past 12 months. Findings from deeper levels of analysis:  Further analyses yielded slight differences across demographic subgroups—93% of respondents from English-speaking households selected “yes” for both questions in this indicator, versus 90% of respondents from non-English speaking households. Moreover, 95% of White children were reported as having and using a regular place for care, compared to 91% of Hispanic children. Results within Indicator 3 ( Regular Physical Activity and Active Living) yielded mixed results. There was a significant amount of variation in results across all measures within this indicator level. Key findings include:  A high percentage of respondents (93%) reported that they prepared healthy foods for their children, however  Only 49% reported that their children, on average, watch 1 hour or less of television use. (The American Academy of Pediatrics recommends no screen time for children under 2 years old and no more than 1-2 hours for children older than 2). 6 The extremely positive response to this question was somewhat surprising, given the sizable portion of low income families served by F5VC. To provide more nuanced understanding, it may be useful to add a subquestion in the survey around insurance type. While the most recent F5VC intake forms ask clients to report insurance type, previous versions of the form did not ask for this level of data, and thus we were unable to tie these survey responses to intake forms in ways that would yield consistent and meaningful results.
  • 10. 8 Findings from deeper levels of analysis:  Results were fairly comparable across racial and ethnic groups, however there were slight variations for children that spoke different languages at home—52% of children from non English-speaking households were reported as spending 1 hour or less in front of a television, versus 44% of children from English-speaking households. Results within Indicator 4 (Regular Place for Oral Health Care) were not strong. Key findings include:  Seventy-eight percent of respondents reported that their children have a regular dentist and that they had a dental exam within the last 6 months. Results in this indicator area are, on average, lower than results in other indicators within this outcome area. At the time of intake, parents reported that 48% of children had received a dental exam within the last 6 months. However, it is important to note that these results do not take into account the age of the child at the time the survey was administered. Outcome 2: School Ready Prior to Kindergarten The three indicators mapped to school ready prior to kindergarten focus on: 1) literacy practices at home; 2) developmental screening referrals and uptake; and 3) school readiness as measured by the DRDP. Because findings for this outcome area draw on on two different data sources (Parent Survey responses for the first two indicators and DRDP scores for the last indicator), we did not create a composite score for the outcome area. Moreover, for this outcome, we divide our presentation of findings according to data source for the sake of clarity. Our analysis for the first two indicators in this outcome area drew on two questions (and corresponding subquestions) from the parent survey. Results for the first indicator reflect the mean percentage of parents that reported reading with their children 3-6 days per week or more. Results for the second indicator reflect the percentage of respondents who report having received a developmental screening referral and, subsequently, percentages of those respondents who followed up on those referrals. Indicator Questions Mean #/% of parents who read to their children 3 or more days a week  Q8: In the usual week, about how many days do you or any other family members read stories or look at picture books with your child? (Results reflect responses from parents who selected 3-6 days or every day.) 7 71% #/% of children who receive developmental  Q7: Since you started receiving First 5 services, has your child been referred for a Developmental Screening (for example, have you been asked to complete a checklist of activities that your child can do, such as certain physical tasks, 58% 7 There were four response options to this question: 1-2 days, 3-6 days, every day, and never.
  • 11. 9 screenings and follow-up 8 whether your child can draw certain objects, or ways your child communicates with you)?  Q7a: If you received a referral, was a Developmental Screening conducted? 79%  Q7b: If a Developmental Screening was conducted, was a concern identified? 61%  Q7c: If a concern was identified, has your child received follow-up services? 75% Because of the wide variation in scores and the multiple levels of response type (i.e. some questions included sub-levels), we did not include composite scores for these indicators. Below are key findings at the indicator level. Results within Indicator 1 (Parents Who Read to their Children 3 or More Days per Week) were not strong. Survey results indicate that many parents are not reading to their children at optimal or recommended levels. Key findings include:  Seventy-one percent of children from the sample have parents who regularly read to their children 3-6 days per week or more. The American Academy of Pediatrics, however, recommends that parents read to their children on a daily basis in order to support child literacy. Only 33% of children in the sample had parents who reported reading to their children every day. Findings from deeper levels of analyses:  Our analysis indicates that there is a large racial disparity in this indicator area.  Ninety percent of white children in this sample have parents that report reading to them 3-6 days per week or every day, whereas only 65% of Hispanic children’s parents reported reading to them as often.  There was also a notable difference between English-speaking homes and non-English speaking homes. Eighty-six percent of children from English speaking homes are read to 3-6 times per week or everyday, versus 62% of children from non English-speaking homes.  Families who received 3 or more services related to this Indicator (i.e., EL PACT, Kindergarten Transition for Parents) reported reading to their children 3-6 times per week or every day more often than families who received 0 to 2 services. Results within Indicator 2 (Children Who Receive Developmental Screenings and Follow Up) were mixed. This indicator area, and the questions that fall within it, are different from the rest of the questions in the survey in that it incorporates sub-level follow up questions and it is the only indicator 8 Fields with populated data that succeeded a question with missing data were included in the analysis of this indicator. For example, if a respondent selected yes to question 7, left 7a blank, and selected yes to 7b, this data was included.
  • 12. 10 wherein positive findings are not necessarily correlated with high percentages. Thus, making meaning of the results requires a different lens. Below are some key findings:  Fifty-eight percent of respondents reported that their child received a referral for developmental screenings.  Of those, 79% reported that their child received a developmental screening and 61% of those parents reported that a “concern” was identified as a result.  Seventy-five percent of parents whose children received a developmental screening wherein a concern was identified reported receiving follow up services. Findings from deeper levels of analysis:  There were interesting variations in this indicator area across subgroups:  69% of children from non English-speaking households were referred for a developmental screening, compared to 41% of children from English-speaking households. After being referred for a developmental screening, whether or not an actual screening occurred varied greatly across children served by different program types.  Eighty-one percent of children at NfLs and 78% of children at preschool expansions received screenings after being referred. However, only 69% of children who received services from a countywide program actually received a developmental screening upon referral. Moreover, after receiving screenings, 64% of Hispanic children had a “concern identified,” compared to only 37% of their White counterparts.  Families who participated in Kindergarten Transition Programs for Parents were more likely to receive a referral for their child to receive a developmental than families who received preschool or Kindergarten Transition for Children services. However, families who received Kindergarten Transition for Children services were more likely to receive a screening, have a “concern identified,” and receive follow-up services.  In this measure, there was also a notable difference in results between children from English-speaking and non-English speaking homes. Sixty-five percent of children from non English-speaking homes had a “concern identified” compared to 48% of English- speaking children. However White children who had a “concern identified” received follow up services at lower rates than their counterparts.  Analyses by of results by program type also yielded slight variations--eighty percent of clients at countywide programs received follow up services, compared to 75% of children serviced through NfLs. Our analysis for the third indicator in this outcome area drew on preschool Desired Results Developmental Profile (DRDP) scores.9 In the table below we show results of pre- and post-assessments 9 Data was collected in Persimmony on 1,411 children receiving preschool services during FY14-15. Of these children, 834 are deemed to be “DRDP eligible” children (those who were 4 years old by the age-eligible date for kindergarten, which was September 1, 2014). Of the 834 DRDP eligible children, 710 (85%) of children
  • 13. 11 for DRDP-eligible children, to demonstrate both growth over time and to show how many children were kindergarten-ready (i.e. whose results fell into one of the two highest developmental levels—building or integrating) by the time they took their post-assessment. Note that this data table only includes data from children for whom we have both pre- and post-assessment results. On average, children who took both the pre- and post-assessments received 35 hours per week of preschool services. For comparison purposes, we also ran a separate analysis of all post-assessments for DRDP-eligible children irrespective of whether or not we had pre-test data. The results were identical to the post-assessment data listed in the table below. Indicator Domain % of Children from Pre/Post Sample scoring at the Building or Integrating Levels Pre Post #/% of children considered school ready as measured by an evidence-based tool  Self and Social Development (SSD) 35% 86%  Language and Literacy Development (LLD) 31% 83%  English Language Development (ELD) 43% 81%  Domain: Cognitive Development (COG) 32% 83%  Mathematical Development (MATH) 29% 82%  Physical Development (PD) 53% 93%  Health (HLTH) 40% 86% COMPOSITE (Building and Integrating across all domains) 20% 70% Given the wide variation in measurement tools and focus across each indicator area, we did not develop a composite score for this outcome. At the indicator level, a great deal of variation emerged. Key findings at the indicator level are shared below: Results within Indicator 3 ( Children Who Are Considered School Ready) are mixed. The first measure includes the percentage of all kindergarten-eligible children receiving F5VC preschool services who scored in the top two levels of the DRDP (“Building” or “Integrating”). The following are some key findings of note:  While post-assessment scores in each learning domain appear fairly positive, only 70% of children received scores that fell into the top two levels of the DRDP across all domains. The fact that 30% of age-eligible children did not meet target milestones across all DRDP learning domains may warrant further examination by F5VC.  The results show remarkable growth over time overall and within each learning domain. In this sample, the composite score indicates that 20% of these children scored within the higher levels for the pre-test, and 70% scored within these levels in the post-test stage, indicating positive levels of growth across all learning domains over time for this sample group. Growth within each domain ranges from 38% to 53% . completed at least one DRDP assessment. Pre- and post-assessments were administered to 599 children. Note: Within the entire DRDP dataset, there were 947 matched pre- and post-assessments.
  • 14. 12 Deeper levels of analysis across different participant characteristics or intensity or mix of services did not yield significant variation across subgroups. Outcome 3: Knowledge of Child Development, Resources, and Parenting The three indicators mapped to knowledge of child development, resources, and parenting focus on three main areas: access to services, knowledge of child development, and parenting confidence. There are 15 questions in the parent survey that map to this outcome area. Questions in the first indicator area focused on access to services utilized a five-point agreement scale. 10 Questions in subsequent indicators utilized a four-point scale, which used the same response options as the previous scale, but without the “Does not Apply to Me” option. In this section, we report average percentages of parents that selected “Most of the Time” or “Always” as responses, as well as the mean Likert scale results. Below are summary statistics across the full parent sample of 2,847 parent surveys. Indicator Questions Percent Score Mean #/% of parents reporting they can access services when needed  Q12: I know how to get services that I need for my child. 85% 3.38  Q13: I am getting the services I need for my child. 90% 3.54  Q14: I talk to someone when I am worried about my child. 86% 3.46  Q15: I get my questions about parenting or child development answered. 86% 3.42  Q16: I have places I go to in my community to get the resources I need. 80% 3.33  Q17: I have places I go to in my community to meet with other parents. 62% 2.90 INDICATOR COMPOSITE 81% 3.34 #/% of parents reporting good knowledge of child development  Q18: I understand my child’s development. 93% 3.54  Q19: I am able to tell if my child is making progress. 95% 3.65  Q20: I know how to help my child develop and learn. 91% 3.47  Q21: I know how to help my child behave the way my family would like. 87% 3.35  Q22: I am able to help my child learn and practice new skills. 92% 3.51  Q23: I know what to expect of my child based on her/his age. 89% 3.44 INDICATOR COMPOSITE 91% 3.49 #/% of parents who feel confident in their parenting skills  Q24: I can handle problems that come up when taking care of my child 94% 3.57  Q25: I believe I have the skills for being a good parent to my child. 96% 3.63  Q26: I am confident as a parent. 97% 3.69 INDICATOR COMPOSITE 95% 3.63 OUTCOME #3 COMPOSITE 88% 3.46 10 Response options included Always, Most of the Time, Sometimes, Never, and Does not Apply to Me.
  • 15. 13 Parent survey results are quite strong in this outcome area, with an overall average agreement rating (i.e. parents chose most of the time or all of the time) of 88% across all indicators, as measured by the composite score. At the outcome level, there was some notable variation in responses across subgroups. These include:  Respondents from English-speaking households responded more favorably11 (57%) than those from non English-speaking households (41%).  Hispanic respondents gave the lowest favorable ratings in this outcome area (43%) when compared with White respondents (63%), African American respondents (60%), and multiracial respondents (60%). Results within Indicator 1 (Ability to Access Services When Needed) are somewhat mixed. Responses within this indicator area were fairly strong, with the exception of one measure, yielding an overall composite score of 81% for this indicator area. Key findings include:  Eighty-five percent of parents reported they know how to access needed resources. Interestingly, a higher percentage (90%) report that they are getting the services they need.  The lowest scoring measures were around access to community-level resources. Interestingly, the two lowest scoring measures in this outcome area fell within this “access” indicator, and were in response to prompts focused specifically around community-level resources: I have places I go to in my community to get the resources I need (80%), and I have places I go to in my community to meet with other parents (62%). These results might indicate a need for greater investment around either strengthening community support systems or communications about existing support systems. It may also signal a fairly strong sense of parent isolation and need for parent community building. Findings from deeper levels of analysis: Given that the lowest scores in this outcome area fell within this indicator, we conducted a deeper level of analysis for the indicator itself and specifically for responses to Question 17 (I have places I go to in my community to meet with other parents). The following are some key results:  At the indicator level, participants from English-speaking households responded favorably more often than those from non English-speaking households (64% of versus 47%). This type of variation was also true in examinations of responses to question 17, which indicate that 69% of respondents from English-speaking homes responded favorably, compared to 58% of those from non English-speaking homes.  Analyses at the program type level yielded varied results to Question 17. Only 35% of respondents who received preschool expansion services reported positive results to 11 For this outcome area, a favorable response is when respondents select “most of the time” or “always” as a response.
  • 16. 14 Question 17, compared to 61% of NfL respondents and 66% of respondents who received county-wide services.  Analyses cut by intensity or mix of services reveal that respondents who participated in at least one Early Learning: Parent and Children Together class responded more favorably to this question, with 71% of respondents reporting positive outcomes. In fact, clients who received any combination of Early Learning: Parent and Children Together (EL PACT), parenting education, or case management services scored more favorably on this question. Additionally, 72% of clients receiving 11 or more services related to this outcome area reported positive outcomes versus 62% of the survey population. Finally, respondents who participated in at least one EL PACT class also scored higher on the overall indicator (84% vs. 81%). Results within Indicator 2 (Knowledge of Child Development) were strong. Responses within this indicator area were consistently strong across all measures, indicating that parents who responded to the survey feel they have a solid understanding of child development and how to apply that understanding to their children’s progress. Key findings are shared below.  The highest average agreement score was in response to the prompt I am able to tell if my child is making progress (95%).  The lowest scoring measure within this indicator area was in response to the question I know how to help my child behave in the way that my family would like (87%). Findings from deeper levels of analysis:  There were no notable variations across racial or ethnic groups, though responses from participants in English-speaking homes were slightly more favorable (7% higher) than those from non English-speaking homes.  Respondents that participated in countywide programs gave more favorable responses (82%) than respondents who were served by NfLs or preschool services (76%).  There were no notable variations across services received. Results within Indicator 3 (Confidence in Parenting Skills) were extremely strong. This indicator received the strongest scores within the outcome area, with an average composite score of 95% and extremely positive results across all measures within this indicator area. These results indicate that parents who responded to the survey are confident in their ability to be a “good parent” and in their ability to address issues when they arise. Findings from deeper levels of analysis:  Results varied slightly by program type but were still very strong, with 100% of respondents served by preschool expansions responding favorably across all measures in this indicator area, compared to 95% of those served by countywide programs and 90% of those served by NfLs.
  • 17. 15 Conclusion First 5 Ventura County has been providing a wide range of invaluable services to populations in need of support, in an effort to ensure that all children in Ventura County can thrive. Results from the Parent Survey and DRDP data indicate that, overall, participants are making fairly strong progress in the three key outcome areas: (1) access to care; (2) kindergarten readiness; and (3) parent knowledge of child development, access to resources, and confidence. Results indicate that key areas of strength include children’s access to health care and health insurance, parent confidence, and parent knowledge of child development. Issues that may warrant further examination or action include support for stronger literacy practices at home (both in reduced screen time and increased parent reading time with children), increased encouragement and support around oral health, potential need for greater community-building efforts to reduce parent isolation, increased support for preschoolers who are not reaching developmental milestones, and further examination of subgroup variations around developmental screenings and uptake. Areas for Consideration Making meaning of the Parent Survey results was a learning endeavor for both SPR and First 5 Ventura County, particularly given that this was the first year the F5VC Parent Survey was deployed. We will provide F5VC with an informal document detailing technical considerations, lessons learned, and/or recommendations around data entry and cleaning, timing, misalignment with other data sources, measurement scales, and semantics. Below are some broad-level considerations for F5VC as it continues to refine the content and deployment of the Parent Survey to optimize meaning-making of the results.  Check results against experience. Some measures yielded such extremely positive results that they were rather striking and gave us pause. For example, the extremely high levels of parent confidence were not typical of the kinds of responses we normally see in evaluations of this kind. It may be helpful to have conversations with providers, to see if this level of confidence holds true in their experience with clients and if not, to explore meaning behind the difference.  Review wording of both intake and parent survey questions to ensure more concise, accurate, and useful responses. It might be useful to take a careful look at both intake forms and the survey to make sure that the questions are clear, particularly for respondents that are limited English-speakers. For example, one form that seeks demographic data on a child uses the pronoun “your” (e.g. “what is your race/ethnicity”). This could easily lead to the form filler filling in his or her race/ethnicity instead of the child’s, potentially resulting in mixed data. We were also curious about how wording contributed to meaning making in areas where the survey results were significantly surprising. For example, high levels of respondents reporting having access to both health insurance and a regular place for health care ran counter to our expectations, given the relatively high levels of poverty in the service population. While this may indicate positive outcomes as a result of the Affordable Care Act, it might have been more useful to also ask subsequent questions around the type of insurance the participant possessed
  • 18. 16 (e.g. private insurance or public insurance) within the survey. Asking this subsequent question gives the respondent time to pause and reflect more deeply about the question itself (which may help reduce response error) and it also provides better understanding around the kind of health care supports the participant can access.  Set target goals specific to outcomes and indicator areas in this survey to measure progress against goals and improvement over time. In order to more meaningfully assess progress in outcome areas, it would be helpful to have target goals within each indicator area so that the results can be less abstract and more aligned with realistic expectations. It would also enable F5VC to use the Parent Survey results to measure progress over time.  Re-map indicators within Outcome Area 1 (Access to Care). The indicators grouped into that outcome area are not aligned (e.g. indicators around levels of physical activity were included with indicators around access to insurance and dental care), reducing our ability to say something meaningful about progress for this outcome area.  Create a clear plan for addressing challenges around data association. One of the biggest challenges we experienced in analyzing and making meaning of the survey results is that in some outcome areas, indicators required that we reassociate family- and parent-level data with individual children. Additionally, there were data complications when more than one parent/caregiver completed the parent survey and provided conflicting information regarding their child(ren). Ideally, parent-level and child-level data would be collected using two different tools.  F5VC may want to alter the survey and deployment strategy if it wants to make clearer, more concrete connections between outcomes and services received. The parent survey was a single, comprehensive survey given to parents at a single point in time who may have benefitted from a whole host of services offered via F5VC at any given point within FY 2014-15. As such, we could not discern or identify clear connections between outcomes and services, mix of services, or intensity of services because the range and diversity within those arenas varied so greatly across the survey participants. Moreover there was wide variations in lag time between when a client received a service and when the survey was taken, which can have some influence over parent responses. One potential solution would be to create a master list of survey questions, mapped directly to specific outcomes and indicators, and to create separate surveys for different services that use only service-appropriate questions, from the master list. These surveys could then be deployed at end points of a service (e.g. at the end of a workshop or a training series, end of a preschool year, etc.), with appropriate identifiers still tied to each survey so that evaluators could more clearly connect the outcome reported on the survey with the service received. In concluding this report, we feel it is important for us to underscore the need for caution around how to use or act upon the data shared in this report. Results from the Parent Survey can yield some useful information about how children and families are faring across different outcome levels, and it can reveal areas for further inquiry, but cannot provide a nuanced picture of the impact of F5VC services on its clients. This is in large part because surveys are, in general, limited in terms of what they can reveal, and because the wide variation of scopes, mixes, and intensities of services provided to survey participants made it challenging, in this survey, to make some concrete attributions to outcomes yielded from a single survey. The Parent Survey provides important information about how F5VC’s service population is
  • 19. 17 faring with respect to key agency goals. While attribution is challenging, the results still point towards strong progress in critical arenas. It has been an honor working with First 5 Ventura County on this complex project.
  • 21. 19 Parent Survey We want to learn if our services have helped you and your family. There are no right or wrong answers. Please answer the questions honestly. Your participation is voluntary and your responses will be kept private. Thank you! I. HEALTH AND SCREENING 1. Do you have a usual place to go when your child is sick or you need health advice?  Yes  No 2. Did your child have a routine check-up in the last 12 months (a doctor visit not related to illness or injury)?  Yes  No 3. Does your child currently have health insurance?  Yes  No 4. What is the regular place or doctor where you take your child for routine care and check-ups?  Doctor’s office, private clinic, or HMO  Have never taken child for routine care  Public health department or community health center/clinic  Prefer not to say  Other, please specify: ______________________  Emergency room at a hospital 5. Did your child have a dental exam in the last 6 months?  Yes  No 6. Does your child have a regular dentist?  Yes  No 7. Since you started receiving First 5 services, has your child been referred for a Developmental Screening (for example, have you been asked to complete a checklist of activities that your child can do, such as certain physical tasks, whether your child can draw certain objects, or ways your child communicates with you)?  Yes  No  Don’t Know a. If you received a referral, was a Developmental Screening conducted?  Yes  No b. If a Developmental Screening was conducted, was a concern identified?  Yes  No c. If a concern was identified, has your child received follow-up services?  Yes  No II. ACTIVITIES 8. In the usual week, about how many days do you or any other family members read stories or look at picture books with your child?  1-2 days  3-6 days  Every day  Never 9. On an average weekday, how much time does your child usually spend in front of a TV watching videos, TV programs, or playing video games?  None  1 hour or less  2-3 hours  4 hours or more Please mark the answer that best describes you. Always Most of the time Some- times Never Does Not Apply to Me If NO, skip to Number 8 below
  • 22. 20 IV. PARENTING Thinking about your interactions with your child OVER THE PAST MONTH, please mark the answer that best describes you. Always Most of the time Some- times Never 18. I understand my child’s development.     19. I am able to tell if my child is making progress.     20. I know how to help my child develop and learn.     21. I know how to help my child behave the way my family would like.     22. I am able to help my child learn and practice new skills.     23. I know what to expect of my child based on her/his age.     24. I can handle problems that come up when taking care of my child.     25. I believe I have the skills for being a good parent to my child.     26. I am confident as a parent.     10. For my toddler or preschooler, I provide 1-2 hours of physical activity (for example, playing outside, sports, dancing or running around) each day for my child.      11. I prepare healthy foods for my child.      III. COMMUNITY RESOURCES Thinking about you and your child OVER THE PAST MONTH, please mark the answer that best describes you. Always Most of the time Some- times Never Does Not Apply to Me 12. I know how to get services that I need for my child.      13. I am getting the services I need for my child.      14. I talk to someone when I am worried about my child.      15. I get my questions about parenting or child development answered.      16. I have places I go to in my community to get the resources I need.      17. I have places I go to in my community to meet with other parents.     
  • 23. 21 Appendix B: Data Sources and Analysis Approach
  • 24. 22 Data Sources Five primary data sources informed our analysis, summarized in the table below. All data are stored in Persimmony. Data Sources Data Source Description Sample Characteristics Parent Survey As described in the F5VC RFP, this “point-in-time” parent survey, administered in Spring 2015, is designed to assess the impact of multiple service interventions on parent knowledge and access to resources, parenting activities and practices, as well as child’s access to health services. Of the approximately 7,000 surveys distributed, nearly 2,847 were completed, for a response rate of roughly 40%. Intake Forms Client Information Participant Questionnaire The Client Information form includes client demographic information such as gender, ethnicity, relationship to child, primary language, and address. The Participant Questionnaire includes questions about the client’s family such as family income level, education levels, marital status, and housing status. Clients enrolling in F5VC services complete the Client Information and Participant Questionnaire forms at intake. To explore the representativeness of the survey data for the client population served, we exported intake and questionnaire data for all individuals who received services during FY2014-2015. Service Dosage Information F5VC provides broad range of services with a range of dosages. We explored this information to inform our analysis. In FY 2014-2015, 57,823 services were administered by F5VC programs. Desired Results Developmental Profile Pre- School (DRDP) Data The DRDP is an assessment instrument developed by the California Department of Education to measure developmental progress for children from infancy to early kindergarten across multiple measures, domains, and developmental levels. F5VC utilizes the 2010 version of the DRDP, which uses 43 measures to assess readiness in seven areas: 1) self and social development; 2) language and literacy development; 3) English language development; 4) cognitive development; 5) mathematical development; 6) physical development; and 7) health. For the report, we draw exclusively on the pre-school DRDP data, which is administered at least twice a year to all children enrolled in pre-school programs, restricting our sample to children who are age-eligible for kindergarten minus 1 year. DRDP PS 2010 data file contained 1,998 pre-, post-, and interim assessment data for children enrolled in pre- school programs. 12 12 This analysis only includes children who are deemed “age-eligible” (those who were 4 years old by the age- eligible date for kindergarten, which was September 1, 2014).
  • 25. 23 Data Source Description Sample Characteristics Neighborhood- level Information SPR utilized service records to determine the types of services and unique clients served by program. We also worked with F5VC to obtain more detailed NfL information, such as budget data. Available for all programs Analysis Approach We designed our analysis to align with the F5VC Evaluation Framework, which is taken from F5VC’s FY2015-2020 Strategic Plan.13 As noted previously, the evaluation framework lists three key outcome areas of interest: (1) access to care; (2) kindergarten readiness; and (3) parent knowledge of child development, access to resources, and confidence. We took a multi-level approach to assessing progress along these key outcome areas, mapping each individual survey question to specific outcome indicators as well as developing composite scores, where appropriate, that include all questions mapped to specific indicators as well as to the broader outcome areas associated with those indicators. Through this multi-level approach, we can provide a fairly rich picture of the results, as it enables us to provide higher-level summary findings at the outcome and indicator levels, supported by findings at the survey question level. Our analysis includes an examination of overall findings at outcome and indicator levels, as well as deeper levels of analysis to look for trends across population characteristics14 and service type. For the analysis of DRDP data related to kindergarten readiness, we measured changes from pre- to post-assessment scores for children in the sample who have both measures, as well as solely post- assessment scores for all age-eligible children served by F5VC across all seven domains. The post- assessment scores provide information about the number and percentage of age-eligible children F5VC serves who are ready for kindergarten. For children who show room for growth on the DRDP pre- assessment (i.e., who score below the integrating developmental level), our analysis of change between pre- and post-test scores capture growth over the time period they participated in F5VC preschool services. For both approaches, we explored trends in readiness by domain as well as participant characteristics and service type. 13 Per discussions with F5VC, our analysis covers individuals who received services during FY2014-2015, the period between July 1, 2014 through June 30, 2015. 13 14 In all outcome areas we examined results by race and ethnicity and language spoken at home (English/non- English) as well as by program type. In the Findings section of this report, we share any findings along these lines of analysis that show deviation from the norm and signal important differences in responses by subgroups.
  • 26. 24 Appendix C: Characteristics of Core Service Population
  • 27. 25 Child-Level Characteristics Child Gender and Age. Fifty-two percent of the child population is male and 48% is female. Infants and toddlers comprised the majority of the F5VC child service population at 64%. The age distribution is as follows: Characteristic Received Services in FY14-15 Survey Sample Age Count Percent Count Percent Under 1 year 883 13% 216 10% 1 Year 874 13% 270 12% 2 - 3 years 2,502 38% 1003 44% 4 - 5 years 2,296 35% 783 34% Race/Ethnicity. The racial and ethnic composition of the child participant population was predominantly Hispanic/Latino (76%), followed by White (15%) and multiracial (4%). Asians comprised 3% of the population, 1% was African American, and the remaining 2% had race recorded as “other” or “unknown.” Characteristic Received Services in FY14-15 Survey Sample Race/ethnicity Count Percent Count Percent Hispanic/Latino 4,873 76% 1,699 76% White 937 15% 322 14% Multiracial 272 4% 96 4% Asian 183 3% 63 3% Black 56 1% 17 1% Other 125 2% 47 2% Language Spoken at Home. The majority of the child service population spoke a language other than English at home (61%). The top three languages spoken at home included Spanish (55%), English (39%), and Mixteco (3%). Characteristic Received Services in FY14-15 Survey Sample Language spoken at home Count Percent Count Percent Spanish 3,579 55% 1,286 57% English 2,549 39% 844 37% Mixteco 214 3% 72 3% Vietnamese 13 0% 7 0% Other 129 2% 45 2% Zip Code of Family Residence. Children served by F5VC accessed early childhood services throughout Ventura county via a number of service delivery points, including preschool programs, countywide services (medical and dental clinics), and NfL family resource centers. The largest percentage of children served resided in
  • 28. 26 Oxnard (34%), followed by Simi Valley (8%) and then Fillmore (7%). The following table depicts the distribution of families by zip code. Characteristic Received Services in FY14-15 Survey Sample Zip code of Family Residence (top 10) Count Percent Count Percent 93033 (Oxnard) 1,108 18% 428 20% 93030 (Oxnard) 625 10% 241 11% 93065 (Simi Valley) 496 8% 181 8% 93015 (Fillmore) 426 7% 130 6% 93021 (Moorpark) 392 6% 149 7% 93036 (Oxnard) 372 6% 159 7% 93060 (Santa Paula) 341 6% 61 3% 93001 (Ventura) 325 5% 139 6% 93010 (Camarillo) 275 5% 79 4% 93041 (Port Hueneme) 248 4% 92 4% Family Level Characteristics15 Characteristic Received Services in FY14-15 Survey Sample Highest Education level in the Family Count Percent Count Percent Less than high school 803 33% 299 38% High School/GED 687 29% 197 25% Some College 355 15% 101 13% Associate’s Degree 142 6% 45 6% Bachelor’s Degree 239 10% 83 10% Grad/Professional 178 7% 68 9% Family Income Level Count Percent Count Percent Less than 10K 600 25% 182 24% 10-20K 558 23% 178 23% 20K-30K 473 19% 157 21% 30K-40K 255 10% 78 10% 40K-50K 156 6% 53 7% 50K-75K 184 8% 56 7% 75K – 100K 133 5% 30 4% 100K+ 83 3% 28 4% Living Situation In a single family residence 1,984 69% 614 68% More than 1 family in a house 899 31% 290 32% Other 13 0% 0 0% Marital Status Married or domestic partnership 2,175 80% 686 80% Single parent household 500 18% 154 18% Other 60 2% 22 3% 15 Due to differences in data fields between previous intake forms and the current intake form, this table only includes data from Persimonny and excludes legacy data from the GEMS system.
  • 29. 27 Family Size 1 child 1,62416 57% 506 57% 2 children 954 34% 313 35% 3 or more children 227 8% 63 7% 16 36 families reported having 0 children at intake; within the survey sample, 11 families reported having 0 children.
  • 31. 29 First 5 funded partners provided a range of services to children and their families in FY14-15. As seen in the table below, preschool expansion programs solely provided preschool services, countywide programs offered preschool, case management, oral health, and developmental screening services, and NfLs provided all services except Oral Health services. Service NfL Countywide Programs Preschool Expansion Total EL PACT & Family/Caregiver Literacy Programs 29,617 0 0 29,617 Preschool 7,216 4,194 699 12,109 Service Coordination/Case Management 7,510 390 0 7,900 Parenting Education 4,653 0 0 4,653 Oral Health 0 1,674 0 1,674 Developmental Screenings (ASQ) 123 815 0 938 Kindergarten Transition for Children 711 0 0 711 Kindergarten Transition for Parents 413 0 0 413 Nutrition and Fitness 349 0 0 349 Early Intervention for Children (Preschool) 154 0 0 154 Community R & R 102 0 0 102 Health Insurance Enrollment 4 0 0 4 Total 50,852 7,073 699 58,624