SlideShare a Scribd company logo
FIREHOUSE SUBS
B E N C H M A R K S C O R E C A R D S F O R E V E R Y
F R A N C H I S E
C U S T O M E R
Q U O T E
C H A L L E N G E
“Working with Keboola
changed how we work with
our franchisees. By giving
them access to data we are
empowering them to make
decisions, that are best for
their business, which in turn
are better for our business as
a whole.”
-Danny Walsh, Director of
Reporting & Analytics
Firehouse Subs, the 11th fastest growing franchise of
2015 according to Entrepreneur Magazine, was looking
to put the power of data into the hands of their
franchisees. Instead of looking to the top for the
information their goal was to provide each of their
1000+ franchisee owners with insights into their own
operations and overall performance to better manage
their businesses.
A W A R D S
Firehouse
Subs
Hospitality
Technology
(HT) 2015
Restaurant
Breakthrough
S O L U T I O N
Firehouse Subs partnered with Keboola to create an analytics
platform called Station Pulse powered by Keboola
Connection (KBC.) The platform connects data from the point of
sale system, customer experience platform, call center feedback,
Yelp ratings, and weather, all by zip code, and puts all the
information in one easily accessible place. There was need not
only to centralize the data, but also incorporate the value of adding
third party applications such as elastic search for
keyword detection and weather augmentation to enrich that data
being presented to each local franchise. The data is then
easily consumed visually in charts and graphs through the
GoodData platform.
R E S U L T
Now franchisees have 24/7 access to review their restaurant(s) data
and an understanding of how to use this tool to monitor their
overall health and performance. By doing things like keeping an
eye on sales and sales KPIs, benchmarkingKPI’s against other
restaurants and noticing correlations to things like the weather and
community donations,franchisee owners can now use the data
given to them to run the most successful business possible. By
ensuring operators focus on the 10 metrics of the Station Pulse
Scorecard, year-over-year comparable sales have increased along
with all of customer experience metrics.
H I G H L I G H T S
1000+ franchise with
the same data
10 metric benchmark
scorecard
24/7 access to data

More Related Content

What's hot

Social Distancing: The Return to Retail in 2020
Social Distancing: The Return to Retail in 2020Social Distancing: The Return to Retail in 2020
Social Distancing: The Return to Retail in 2020
CARTO
 
7 Reasons Why CPG Marketers Are Turning To Location Analytics
7 Reasons Why CPG Marketers Are Turning To Location Analytics7 Reasons Why CPG Marketers Are Turning To Location Analytics
7 Reasons Why CPG Marketers Are Turning To Location Analytics
CARTO
 
Understanding Retail Catchment Areas with Human Mobility Data
Understanding Retail Catchment Areas with Human Mobility DataUnderstanding Retail Catchment Areas with Human Mobility Data
Understanding Retail Catchment Areas with Human Mobility Data
CARTO
 
Using Spatial Analysis to Drive Post-Pandemic Site Selection in Retail
Using Spatial Analysis to Drive Post-Pandemic Site Selection in RetailUsing Spatial Analysis to Drive Post-Pandemic Site Selection in Retail
Using Spatial Analysis to Drive Post-Pandemic Site Selection in Retail
CARTO
 
Real Estate Innovations Overview by KPMG
Real Estate Innovations Overview by KPMGReal Estate Innovations Overview by KPMG
Real Estate Innovations Overview by KPMG
Joseba U
 
Indoor Mapping: Why Precision Matters
Indoor Mapping: Why Precision MattersIndoor Mapping: Why Precision Matters
Indoor Mapping: Why Precision Matters
CARTO
 
Spatial Analysis: the Countervirus in OOH?
Spatial Analysis: the Countervirus in OOH?Spatial Analysis: the Countervirus in OOH?
Spatial Analysis: the Countervirus in OOH?
CARTO
 
How to Use Geospatial Data to Identify CPG Demnd Hotspots
How to Use Geospatial Data to Identify CPG Demnd HotspotsHow to Use Geospatial Data to Identify CPG Demnd Hotspots
How to Use Geospatial Data to Identify CPG Demnd Hotspots
CARTO
 
Applying Spatial Analysis to Real Estate Decision-Making
Applying Spatial Analysis to Real Estate Decision-MakingApplying Spatial Analysis to Real Estate Decision-Making
Applying Spatial Analysis to Real Estate Decision-Making
CARTO
 
Stepping up your Spatial Analysis with Mastercard Retail Location insights 3.0
Stepping up your Spatial Analysis with Mastercard Retail Location insights 3.0Stepping up your Spatial Analysis with Mastercard Retail Location insights 3.0
Stepping up your Spatial Analysis with Mastercard Retail Location insights 3.0
CARTO
 
Using Location Data to Adapt to the New normal
Using Location Data to Adapt to the New normalUsing Location Data to Adapt to the New normal
Using Location Data to Adapt to the New normal
CARTO
 
Leveraging Social Media Data During COVID-19
Leveraging Social Media Data During COVID-19Leveraging Social Media Data During COVID-19
Leveraging Social Media Data During COVID-19
CARTO
 
Making google work_for_you_digital_summit
Making google work_for_you_digital_summitMaking google work_for_you_digital_summit
Making google work_for_you_digital_summit
Colleen Harris
 
Atlas How Site Selectors are Using GIS to Evaluate Communities
Atlas How Site Selectors are Using GIS to Evaluate CommunitiesAtlas How Site Selectors are Using GIS to Evaluate Communities
Atlas How Site Selectors are Using GIS to Evaluate Communities
Atlas Integrated
 
Keynote Presentation SAP Insider 2013 - Singapore
Keynote Presentation SAP Insider 2013 - SingaporeKeynote Presentation SAP Insider 2013 - Singapore
Keynote Presentation SAP Insider 2013 - Singapore
Kurt J. Bilafer
 
LSA17: Building the Real-World Graph (Unacast)
LSA17: Building the Real-World Graph (Unacast)LSA17: Building the Real-World Graph (Unacast)
LSA17: Building the Real-World Graph (Unacast)
Localogy
 
Keynote analytics - partner edge innovation summit - 121013
Keynote   analytics - partner edge innovation summit - 121013Keynote   analytics - partner edge innovation summit - 121013
Keynote analytics - partner edge innovation summit - 121013Kurt J. Bilafer
 
Roshan_Barua_Google Analytics_14-7-14
Roshan_Barua_Google Analytics_14-7-14Roshan_Barua_Google Analytics_14-7-14
Roshan_Barua_Google Analytics_14-7-14Roshan Barua
 

What's hot (19)

Outlook Guide 2010
Outlook Guide 2010Outlook Guide 2010
Outlook Guide 2010
 
Social Distancing: The Return to Retail in 2020
Social Distancing: The Return to Retail in 2020Social Distancing: The Return to Retail in 2020
Social Distancing: The Return to Retail in 2020
 
7 Reasons Why CPG Marketers Are Turning To Location Analytics
7 Reasons Why CPG Marketers Are Turning To Location Analytics7 Reasons Why CPG Marketers Are Turning To Location Analytics
7 Reasons Why CPG Marketers Are Turning To Location Analytics
 
Understanding Retail Catchment Areas with Human Mobility Data
Understanding Retail Catchment Areas with Human Mobility DataUnderstanding Retail Catchment Areas with Human Mobility Data
Understanding Retail Catchment Areas with Human Mobility Data
 
Using Spatial Analysis to Drive Post-Pandemic Site Selection in Retail
Using Spatial Analysis to Drive Post-Pandemic Site Selection in RetailUsing Spatial Analysis to Drive Post-Pandemic Site Selection in Retail
Using Spatial Analysis to Drive Post-Pandemic Site Selection in Retail
 
Real Estate Innovations Overview by KPMG
Real Estate Innovations Overview by KPMGReal Estate Innovations Overview by KPMG
Real Estate Innovations Overview by KPMG
 
Indoor Mapping: Why Precision Matters
Indoor Mapping: Why Precision MattersIndoor Mapping: Why Precision Matters
Indoor Mapping: Why Precision Matters
 
Spatial Analysis: the Countervirus in OOH?
Spatial Analysis: the Countervirus in OOH?Spatial Analysis: the Countervirus in OOH?
Spatial Analysis: the Countervirus in OOH?
 
How to Use Geospatial Data to Identify CPG Demnd Hotspots
How to Use Geospatial Data to Identify CPG Demnd HotspotsHow to Use Geospatial Data to Identify CPG Demnd Hotspots
How to Use Geospatial Data to Identify CPG Demnd Hotspots
 
Applying Spatial Analysis to Real Estate Decision-Making
Applying Spatial Analysis to Real Estate Decision-MakingApplying Spatial Analysis to Real Estate Decision-Making
Applying Spatial Analysis to Real Estate Decision-Making
 
Stepping up your Spatial Analysis with Mastercard Retail Location insights 3.0
Stepping up your Spatial Analysis with Mastercard Retail Location insights 3.0Stepping up your Spatial Analysis with Mastercard Retail Location insights 3.0
Stepping up your Spatial Analysis with Mastercard Retail Location insights 3.0
 
Using Location Data to Adapt to the New normal
Using Location Data to Adapt to the New normalUsing Location Data to Adapt to the New normal
Using Location Data to Adapt to the New normal
 
Leveraging Social Media Data During COVID-19
Leveraging Social Media Data During COVID-19Leveraging Social Media Data During COVID-19
Leveraging Social Media Data During COVID-19
 
Making google work_for_you_digital_summit
Making google work_for_you_digital_summitMaking google work_for_you_digital_summit
Making google work_for_you_digital_summit
 
Atlas How Site Selectors are Using GIS to Evaluate Communities
Atlas How Site Selectors are Using GIS to Evaluate CommunitiesAtlas How Site Selectors are Using GIS to Evaluate Communities
Atlas How Site Selectors are Using GIS to Evaluate Communities
 
Keynote Presentation SAP Insider 2013 - Singapore
Keynote Presentation SAP Insider 2013 - SingaporeKeynote Presentation SAP Insider 2013 - Singapore
Keynote Presentation SAP Insider 2013 - Singapore
 
LSA17: Building the Real-World Graph (Unacast)
LSA17: Building the Real-World Graph (Unacast)LSA17: Building the Real-World Graph (Unacast)
LSA17: Building the Real-World Graph (Unacast)
 
Keynote analytics - partner edge innovation summit - 121013
Keynote   analytics - partner edge innovation summit - 121013Keynote   analytics - partner edge innovation summit - 121013
Keynote analytics - partner edge innovation summit - 121013
 
Roshan_Barua_Google Analytics_14-7-14
Roshan_Barua_Google Analytics_14-7-14Roshan_Barua_Google Analytics_14-7-14
Roshan_Barua_Google Analytics_14-7-14
 

Similar to Firehouse Subs Benchmark Scorecard Spotlight by Keboola

B-to-B Marketing Analytics: Making Sense of Marketing Metrics
B-to-B Marketing Analytics: Making Sense of Marketing MetricsB-to-B Marketing Analytics: Making Sense of Marketing Metrics
B-to-B Marketing Analytics: Making Sense of Marketing Metrics
Association of National Advertisers
 
Data Bootcamp by Fabernovel and Squid Solutions
Data Bootcamp by Fabernovel and Squid SolutionsData Bootcamp by Fabernovel and Squid Solutions
Data Bootcamp by Fabernovel and Squid Solutions
SquidSolutions
 
Redbook_Generic_02_SB
Redbook_Generic_02_SBRedbook_Generic_02_SB
Redbook_Generic_02_SBSam Osborn
 
092509 Litle Spotlight
092509 Litle Spotlight092509 Litle Spotlight
092509 Litle Spotlightmattm37217
 
Driving Impact with Data
Driving Impact with DataDriving Impact with Data
Driving Impact with Data
Publicis Sapient
 
Operational Principal Brochure
Operational Principal BrochureOperational Principal Brochure
Operational Principal Brochure
Ericsson
 
How to use LTV predictions in Marketing Campaigns?
How to use LTV predictions in Marketing Campaigns?How to use LTV predictions in Marketing Campaigns?
How to use LTV predictions in Marketing Campaigns?
Addepto
 
5_Case_Study_Retail_Insights_jewelry
5_Case_Study_Retail_Insights_jewelry5_Case_Study_Retail_Insights_jewelry
5_Case_Study_Retail_Insights_jewelryAnand Rao Vala
 
marketing analytics.pptx
marketing  analytics.pptxmarketing  analytics.pptx
marketing analytics.pptx
nagarajan740445
 
Thinknear Location Score Index Q1 2015
Thinknear Location Score Index Q1 2015Thinknear Location Score Index Q1 2015
Thinknear Location Score Index Q1 2015
Ludovic Privat
 
Top six trends of customer service in 2015 forrester report
Top six trends of customer service in 2015 forrester reportTop six trends of customer service in 2015 forrester report
Top six trends of customer service in 2015 forrester report
ConvergeHub
 
Channel Client Case Studies
Channel Client Case StudiesChannel Client Case Studies
Channel Client Case Studies
Peter Adam
 
Annual b2b marketing data benchmark report 2015
Annual b2b marketing data benchmark report  2015Annual b2b marketing data benchmark report  2015
Annual b2b marketing data benchmark report 2015
Toni Wijaya
 
How Data Analytics Can Drive Best Practices In Your Dental Practice
How Data Analytics Can Drive Best Practices In Your Dental PracticeHow Data Analytics Can Drive Best Practices In Your Dental Practice
How Data Analytics Can Drive Best Practices In Your Dental Practice
Adit - Dental Practice Software
 
Introducing the information valuation estimator
Introducing the information valuation estimatorIntroducing the information valuation estimator
Introducing the information valuation estimator
Mark Albala
 
Just clean yasir
Just clean yasirJust clean yasir
Just clean yasir
Yasir Wani
 
Guide to mobile engagement
Guide to mobile engagementGuide to mobile engagement
Guide to mobile engagementSueli Dey
 
Driving change: Unlocking data to transform the front office
Driving change: Unlocking data to transform the front officeDriving change: Unlocking data to transform the front office
Driving change: Unlocking data to transform the front office
Accenture Operations
 

Similar to Firehouse Subs Benchmark Scorecard Spotlight by Keboola (20)

B-to-B Marketing Analytics: Making Sense of Marketing Metrics
B-to-B Marketing Analytics: Making Sense of Marketing MetricsB-to-B Marketing Analytics: Making Sense of Marketing Metrics
B-to-B Marketing Analytics: Making Sense of Marketing Metrics
 
Data Bootcamp by Fabernovel and Squid Solutions
Data Bootcamp by Fabernovel and Squid SolutionsData Bootcamp by Fabernovel and Squid Solutions
Data Bootcamp by Fabernovel and Squid Solutions
 
Redbook_Generic_02_SB
Redbook_Generic_02_SBRedbook_Generic_02_SB
Redbook_Generic_02_SB
 
092509 Litle Spotlight
092509 Litle Spotlight092509 Litle Spotlight
092509 Litle Spotlight
 
Y&L Data Insight Challenge
Y&L Data Insight ChallengeY&L Data Insight Challenge
Y&L Data Insight Challenge
 
Driving Impact with Data
Driving Impact with DataDriving Impact with Data
Driving Impact with Data
 
Operational Principal Brochure
Operational Principal BrochureOperational Principal Brochure
Operational Principal Brochure
 
How to use LTV predictions in Marketing Campaigns?
How to use LTV predictions in Marketing Campaigns?How to use LTV predictions in Marketing Campaigns?
How to use LTV predictions in Marketing Campaigns?
 
5_Case_Study_Retail_Insights_jewelry
5_Case_Study_Retail_Insights_jewelry5_Case_Study_Retail_Insights_jewelry
5_Case_Study_Retail_Insights_jewelry
 
DMP
DMPDMP
DMP
 
marketing analytics.pptx
marketing  analytics.pptxmarketing  analytics.pptx
marketing analytics.pptx
 
Thinknear Location Score Index Q1 2015
Thinknear Location Score Index Q1 2015Thinknear Location Score Index Q1 2015
Thinknear Location Score Index Q1 2015
 
Top six trends of customer service in 2015 forrester report
Top six trends of customer service in 2015 forrester reportTop six trends of customer service in 2015 forrester report
Top six trends of customer service in 2015 forrester report
 
Channel Client Case Studies
Channel Client Case StudiesChannel Client Case Studies
Channel Client Case Studies
 
Annual b2b marketing data benchmark report 2015
Annual b2b marketing data benchmark report  2015Annual b2b marketing data benchmark report  2015
Annual b2b marketing data benchmark report 2015
 
How Data Analytics Can Drive Best Practices In Your Dental Practice
How Data Analytics Can Drive Best Practices In Your Dental PracticeHow Data Analytics Can Drive Best Practices In Your Dental Practice
How Data Analytics Can Drive Best Practices In Your Dental Practice
 
Introducing the information valuation estimator
Introducing the information valuation estimatorIntroducing the information valuation estimator
Introducing the information valuation estimator
 
Just clean yasir
Just clean yasirJust clean yasir
Just clean yasir
 
Guide to mobile engagement
Guide to mobile engagementGuide to mobile engagement
Guide to mobile engagement
 
Driving change: Unlocking data to transform the front office
Driving change: Unlocking data to transform the front officeDriving change: Unlocking data to transform the front office
Driving change: Unlocking data to transform the front office
 

Firehouse Subs Benchmark Scorecard Spotlight by Keboola

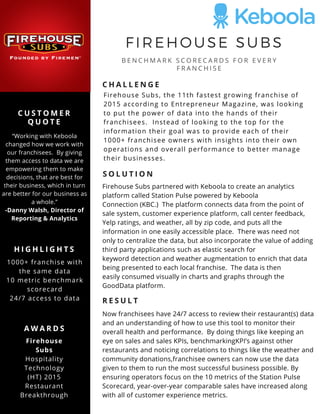
  • 1. FIREHOUSE SUBS B E N C H M A R K S C O R E C A R D S F O R E V E R Y F R A N C H I S E C U S T O M E R Q U O T E C H A L L E N G E “Working with Keboola changed how we work with our franchisees. By giving them access to data we are empowering them to make decisions, that are best for their business, which in turn are better for our business as a whole.” -Danny Walsh, Director of Reporting & Analytics Firehouse Subs, the 11th fastest growing franchise of 2015 according to Entrepreneur Magazine, was looking to put the power of data into the hands of their franchisees. Instead of looking to the top for the information their goal was to provide each of their 1000+ franchisee owners with insights into their own operations and overall performance to better manage their businesses. A W A R D S Firehouse Subs Hospitality Technology (HT) 2015 Restaurant Breakthrough S O L U T I O N Firehouse Subs partnered with Keboola to create an analytics platform called Station Pulse powered by Keboola Connection (KBC.) The platform connects data from the point of sale system, customer experience platform, call center feedback, Yelp ratings, and weather, all by zip code, and puts all the information in one easily accessible place. There was need not only to centralize the data, but also incorporate the value of adding third party applications such as elastic search for keyword detection and weather augmentation to enrich that data being presented to each local franchise. The data is then easily consumed visually in charts and graphs through the GoodData platform. R E S U L T Now franchisees have 24/7 access to review their restaurant(s) data and an understanding of how to use this tool to monitor their overall health and performance. By doing things like keeping an eye on sales and sales KPIs, benchmarkingKPI’s against other restaurants and noticing correlations to things like the weather and community donations,franchisee owners can now use the data given to them to run the most successful business possible. By ensuring operators focus on the 10 metrics of the Station Pulse Scorecard, year-over-year comparable sales have increased along with all of customer experience metrics. H I G H L I G H T S 1000+ franchise with the same data 10 metric benchmark scorecard 24/7 access to data