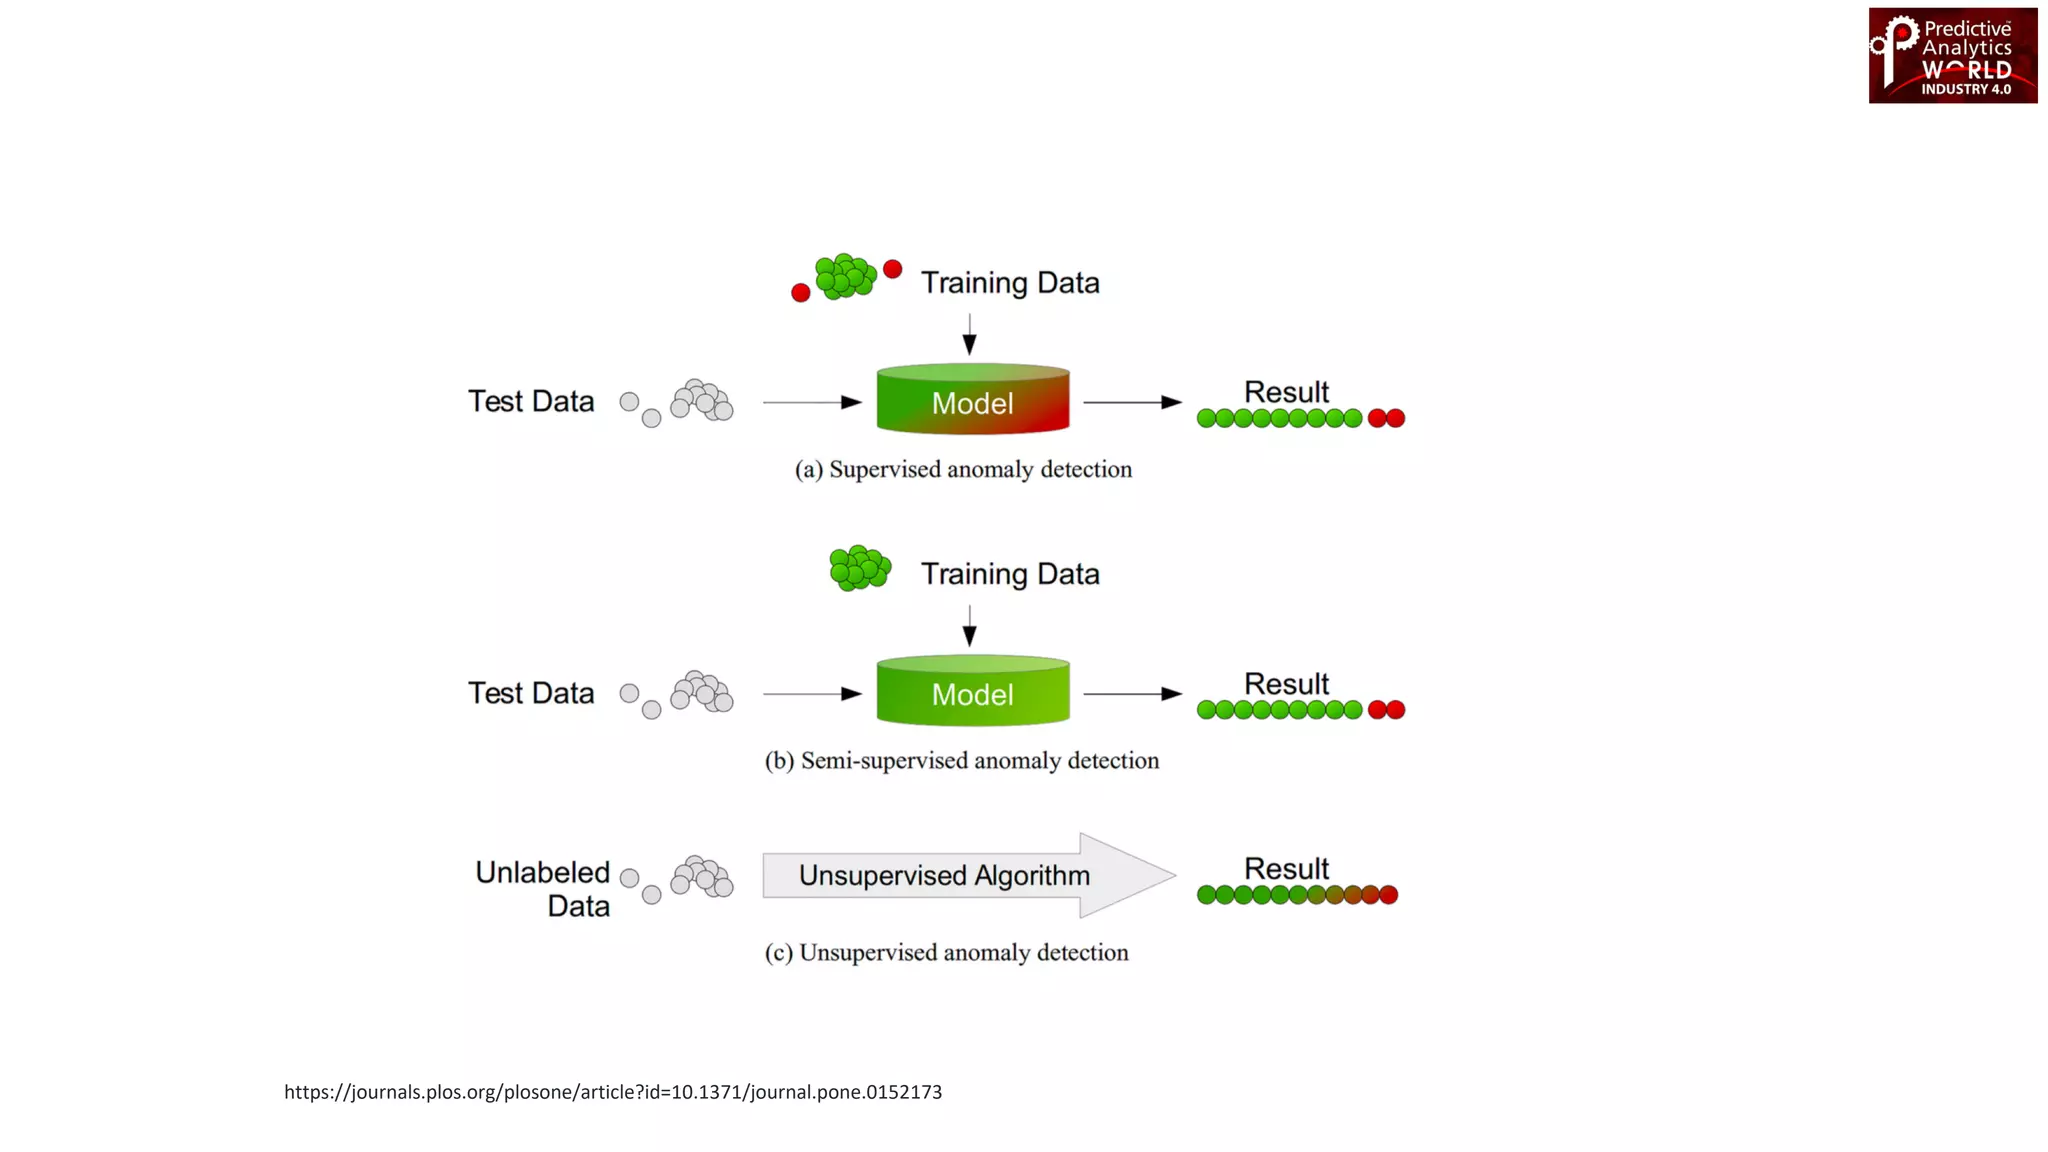
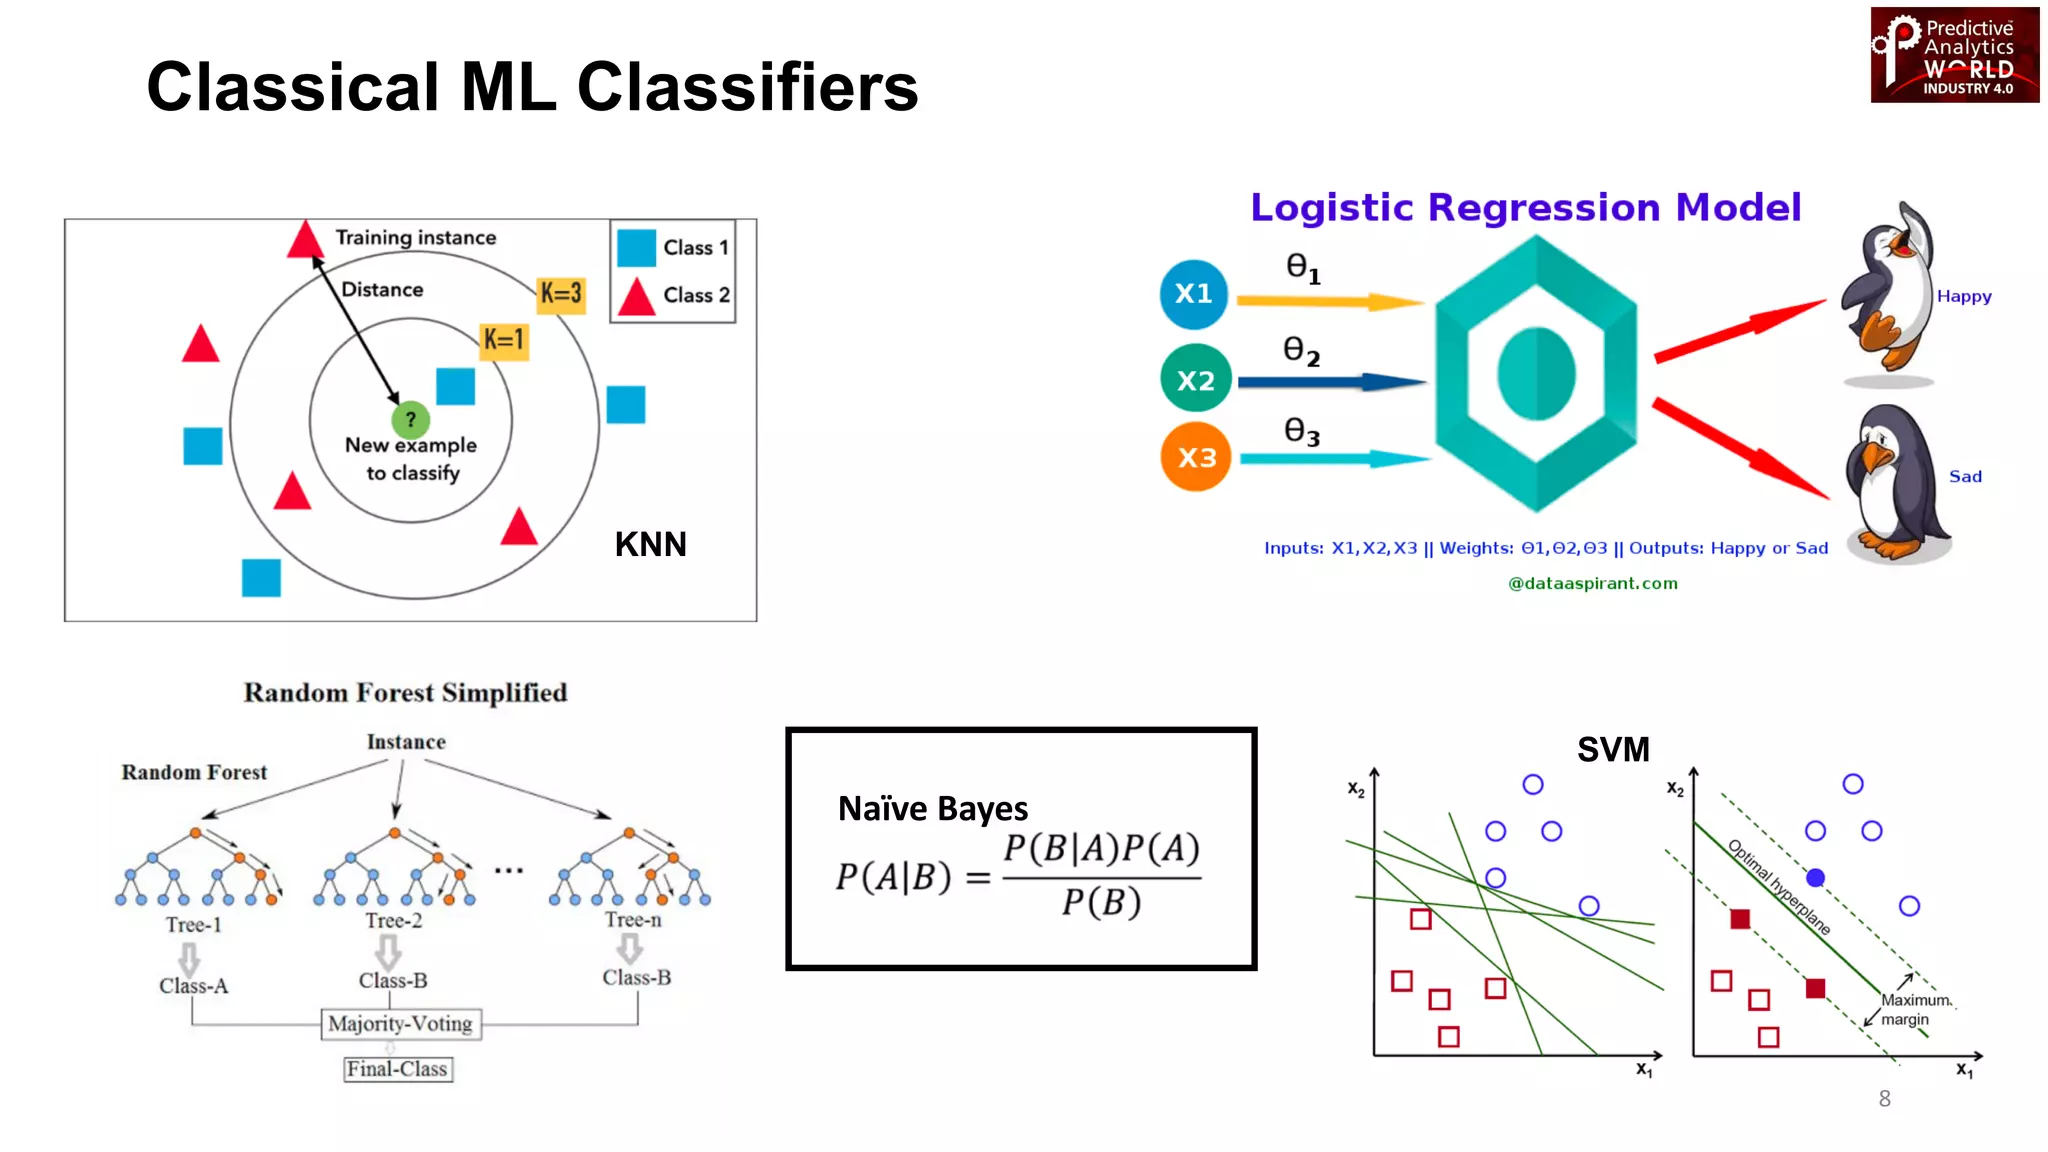
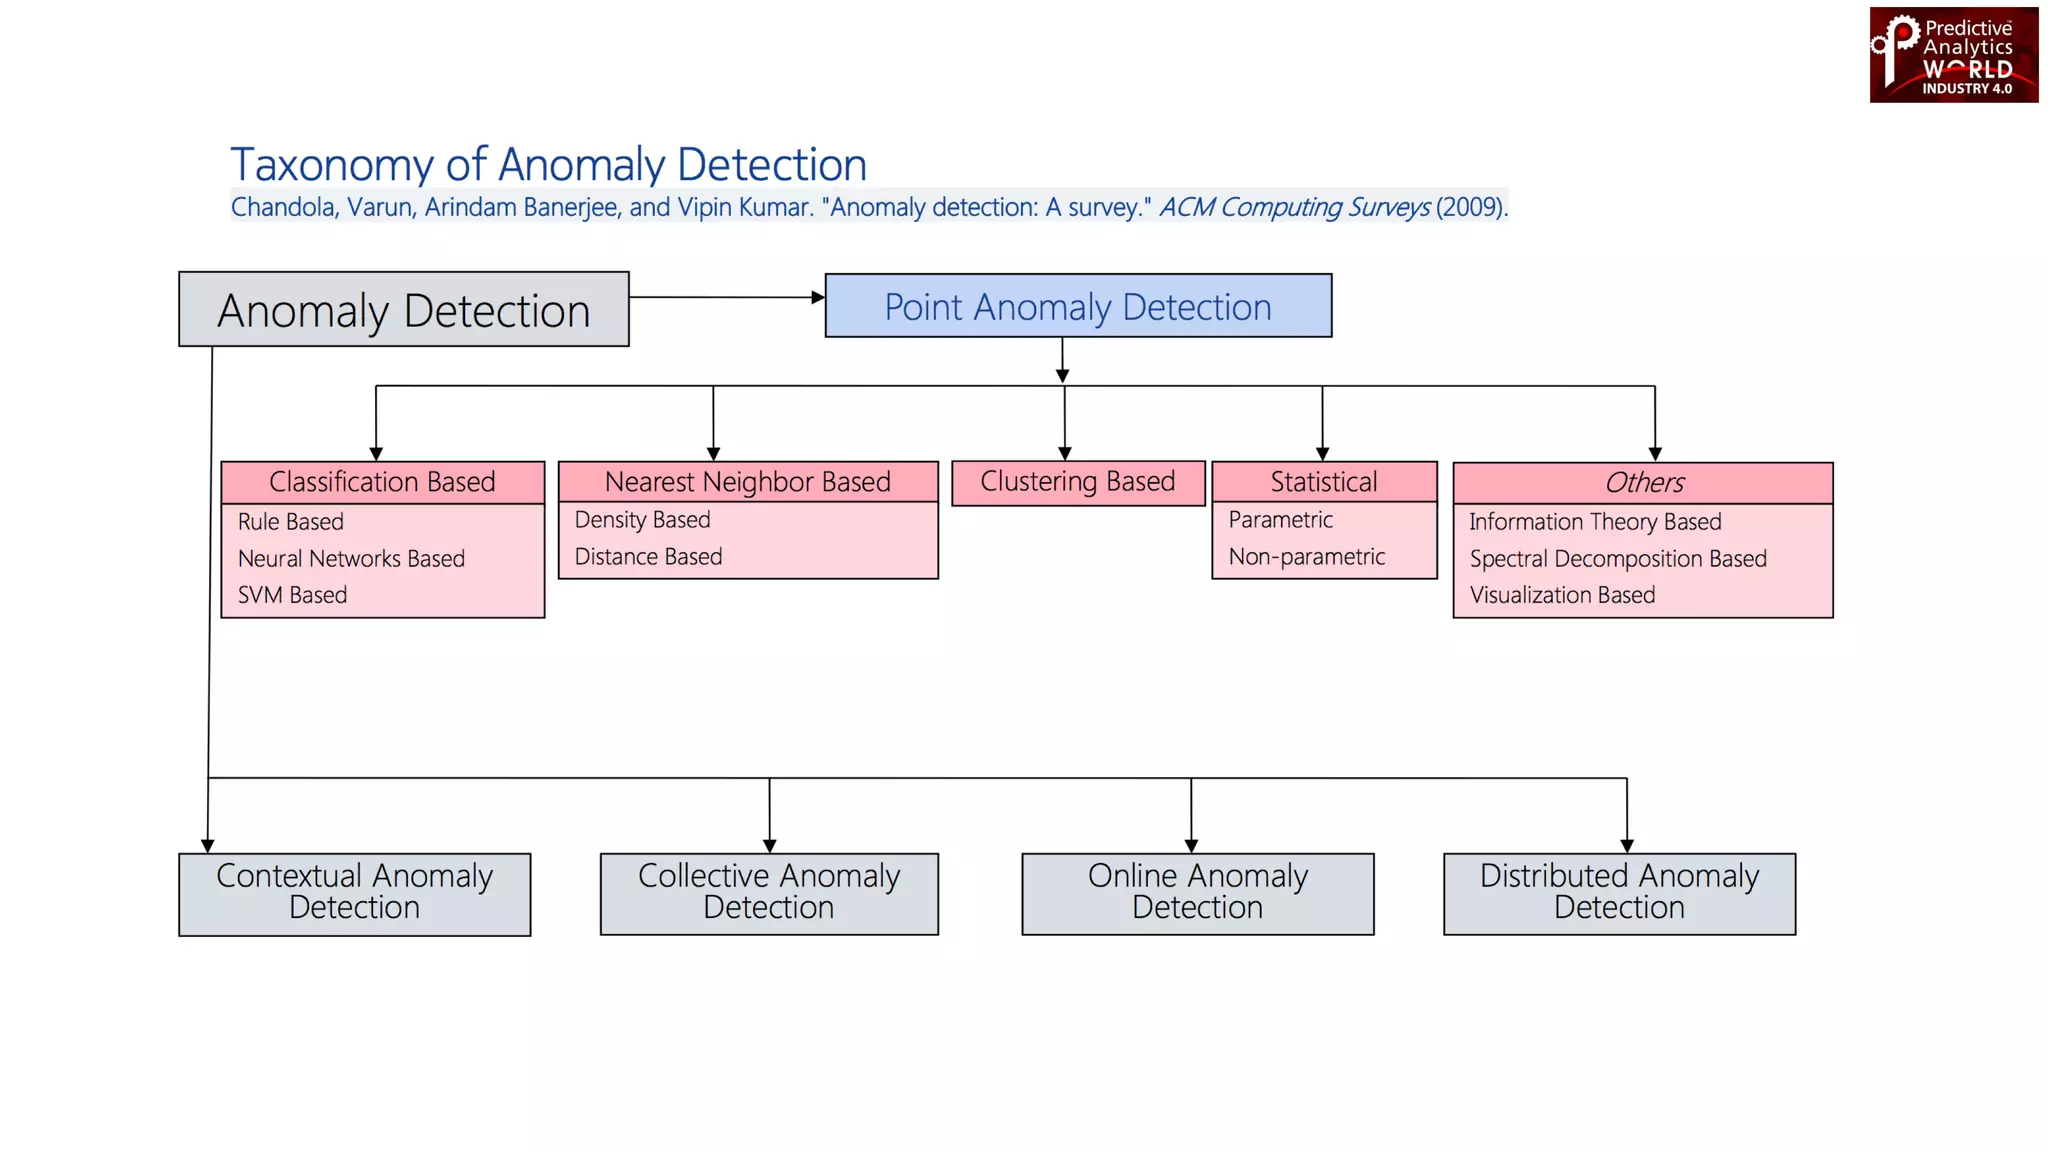
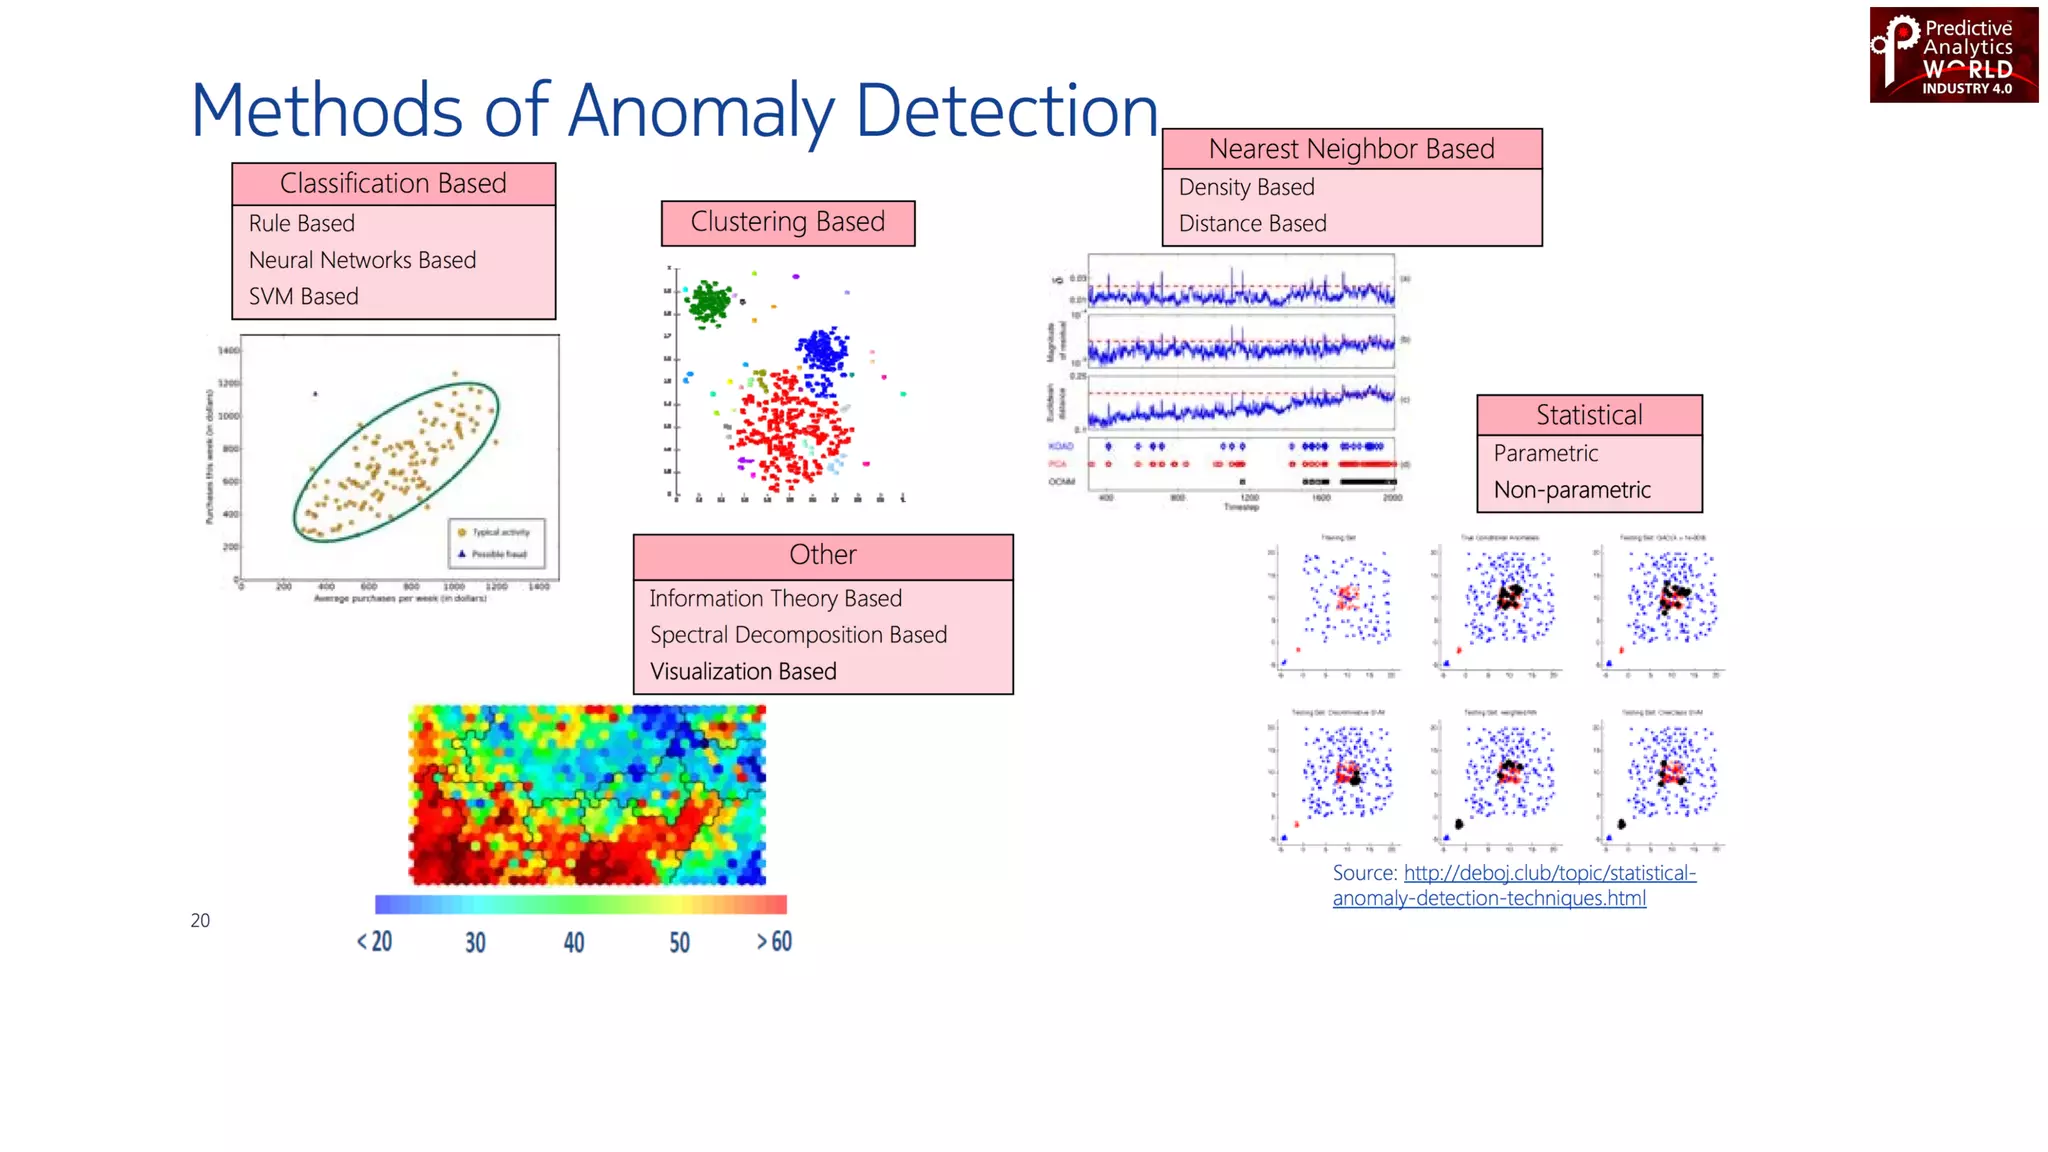
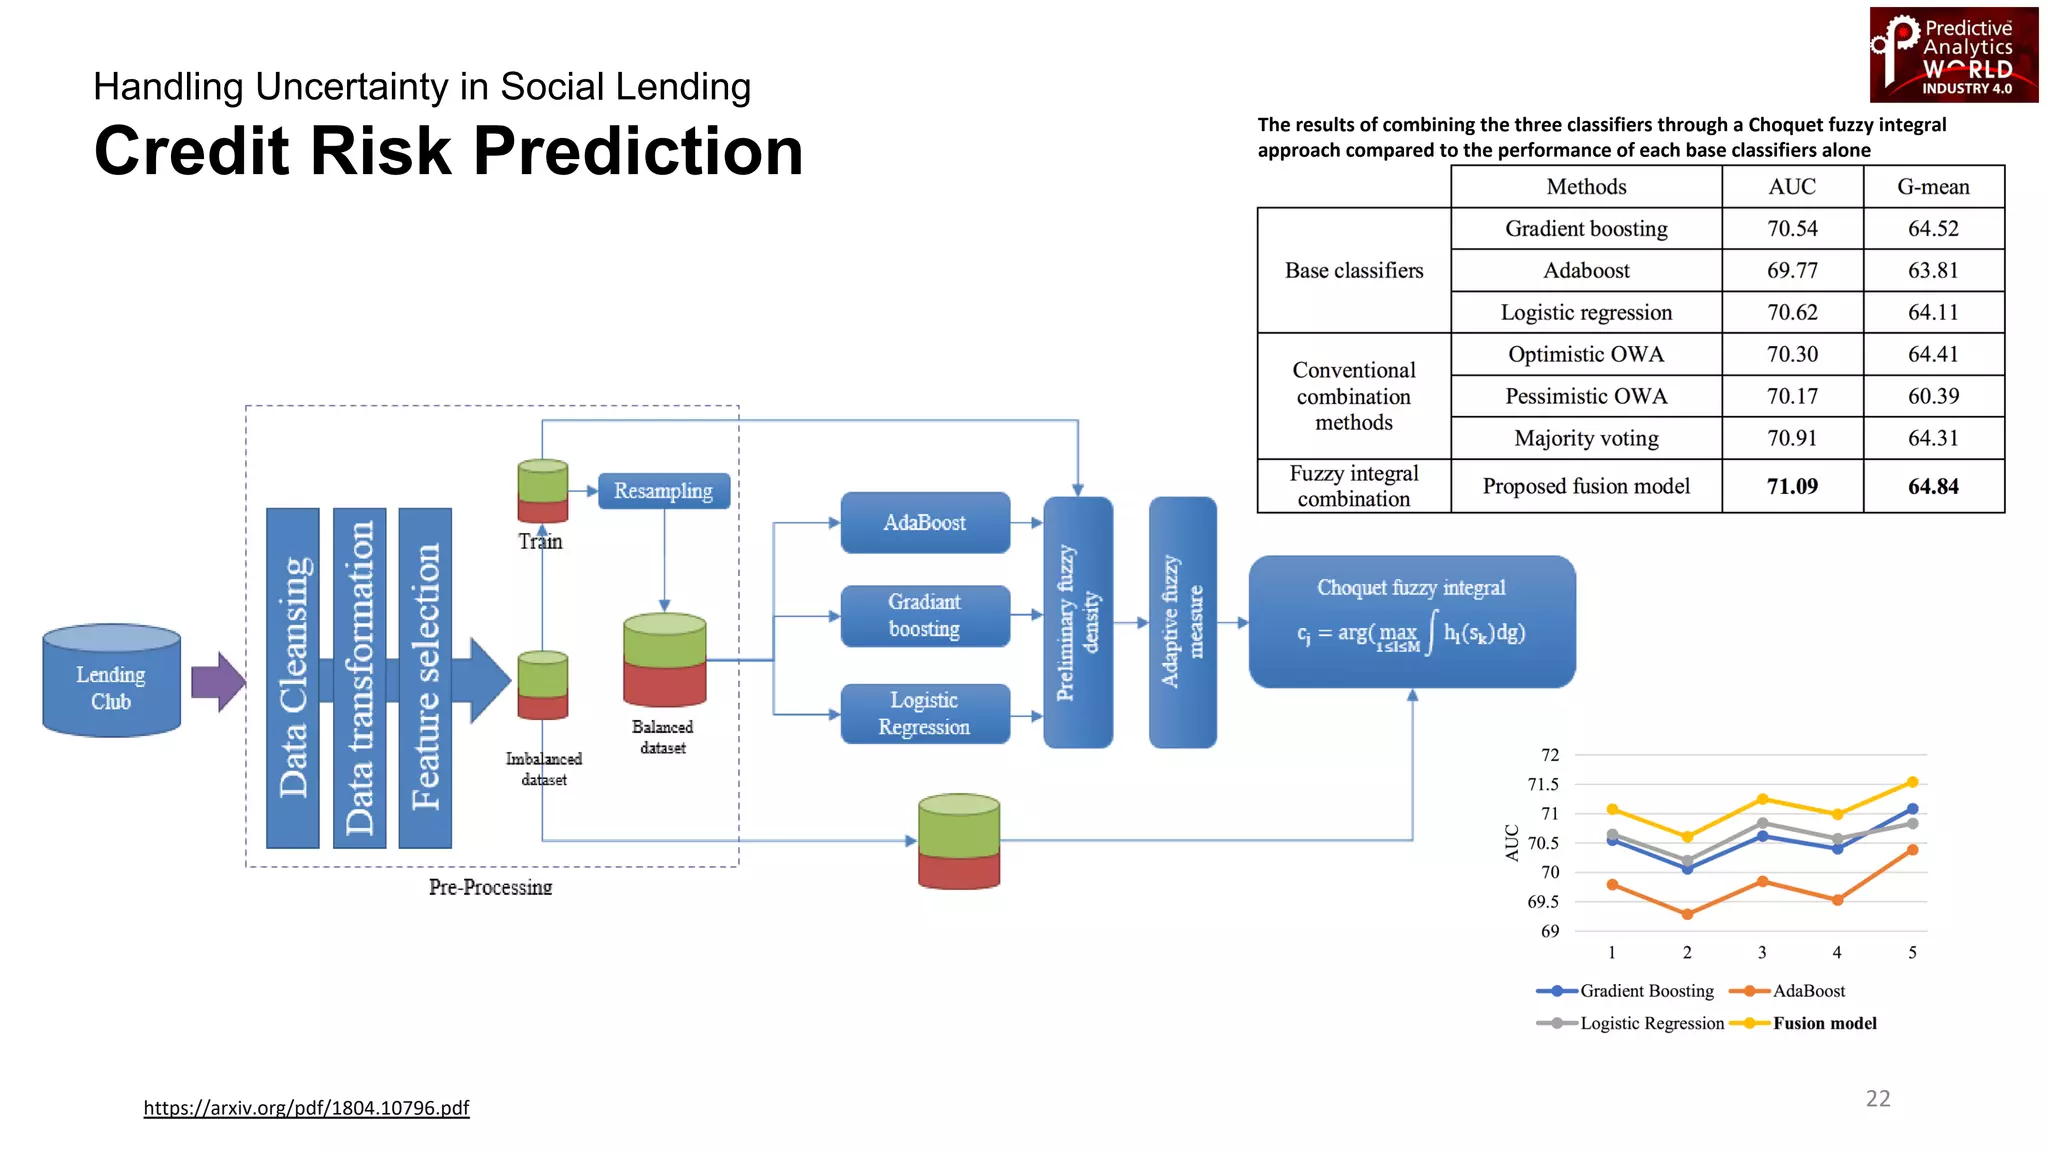
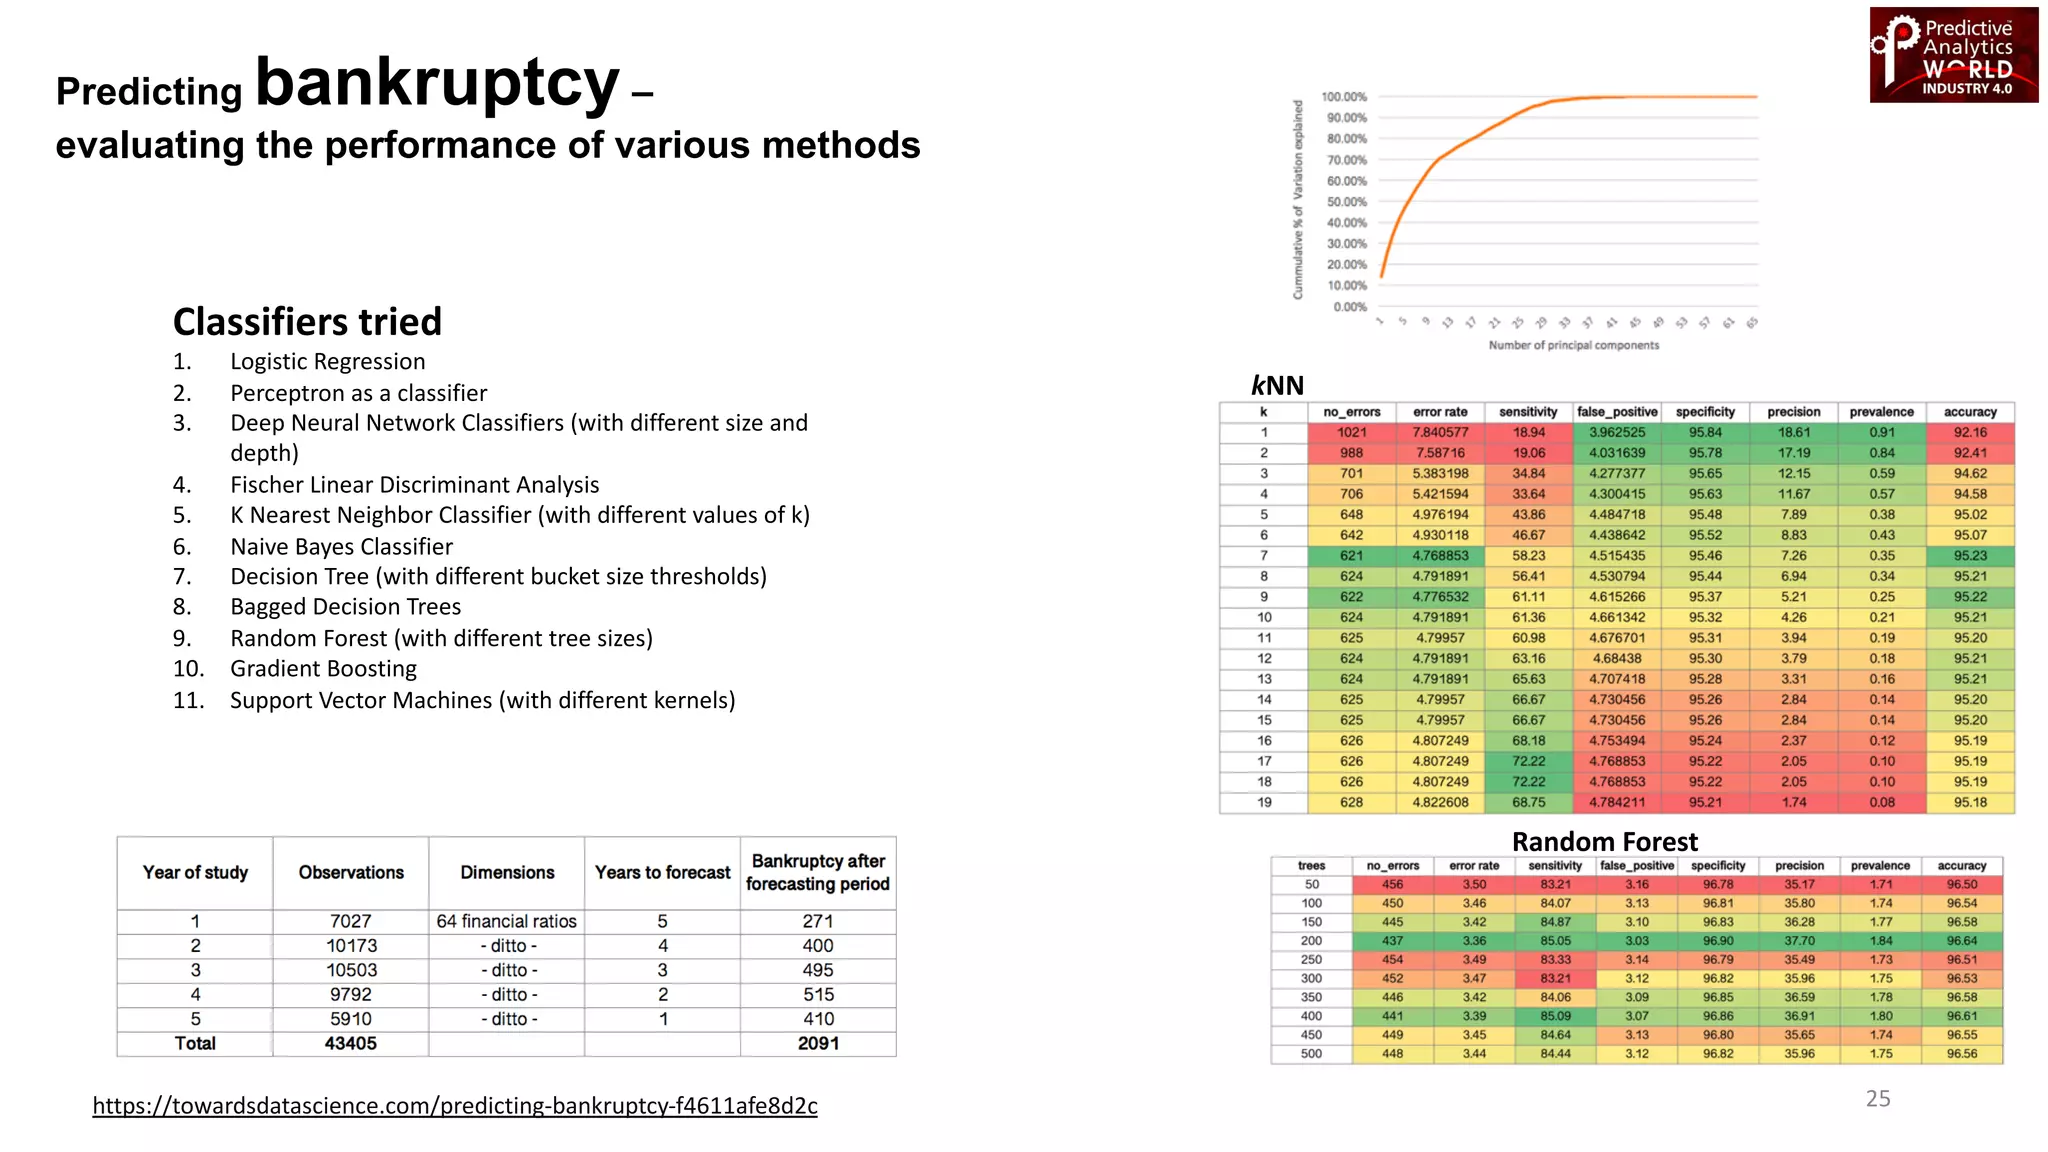
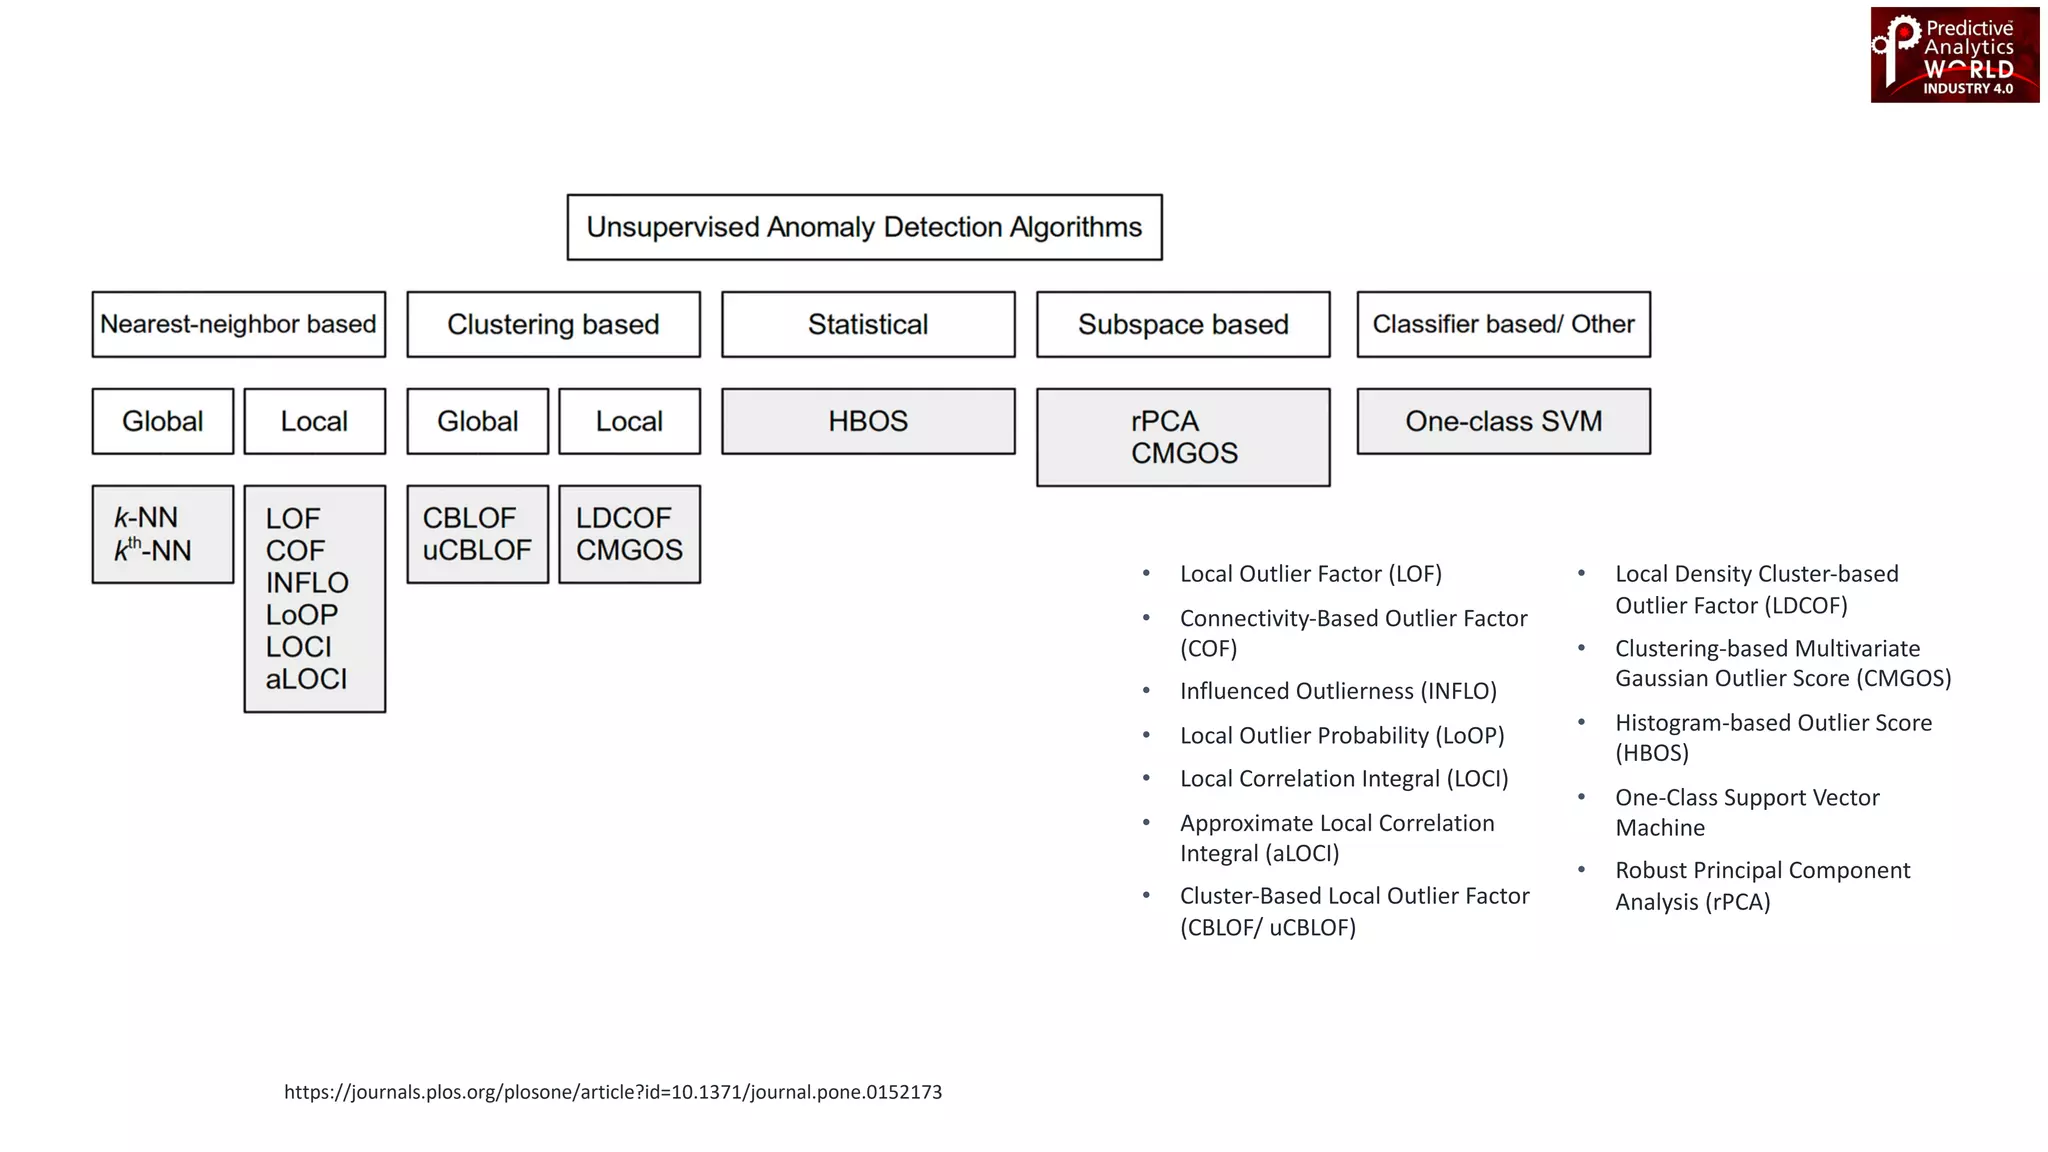
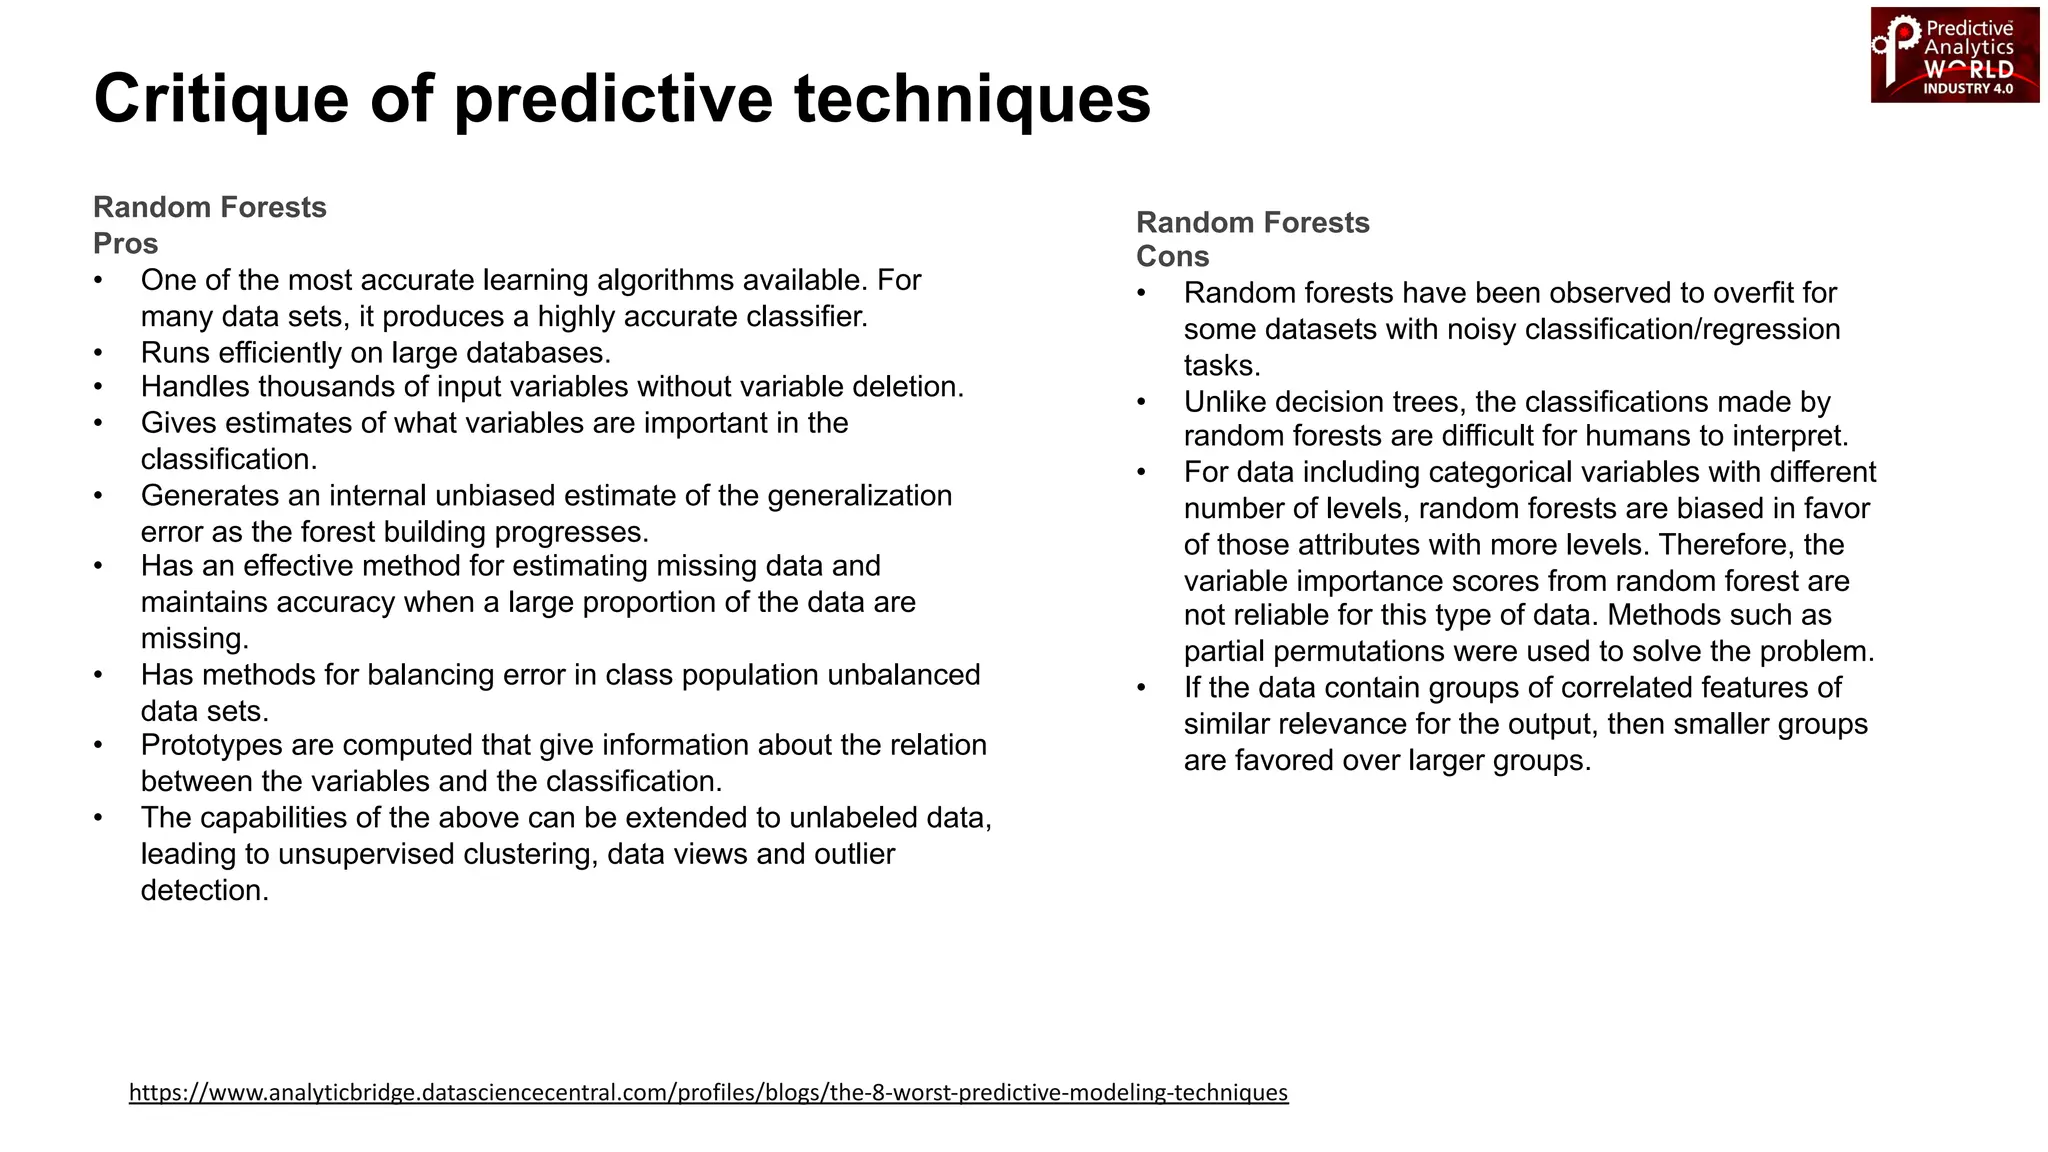
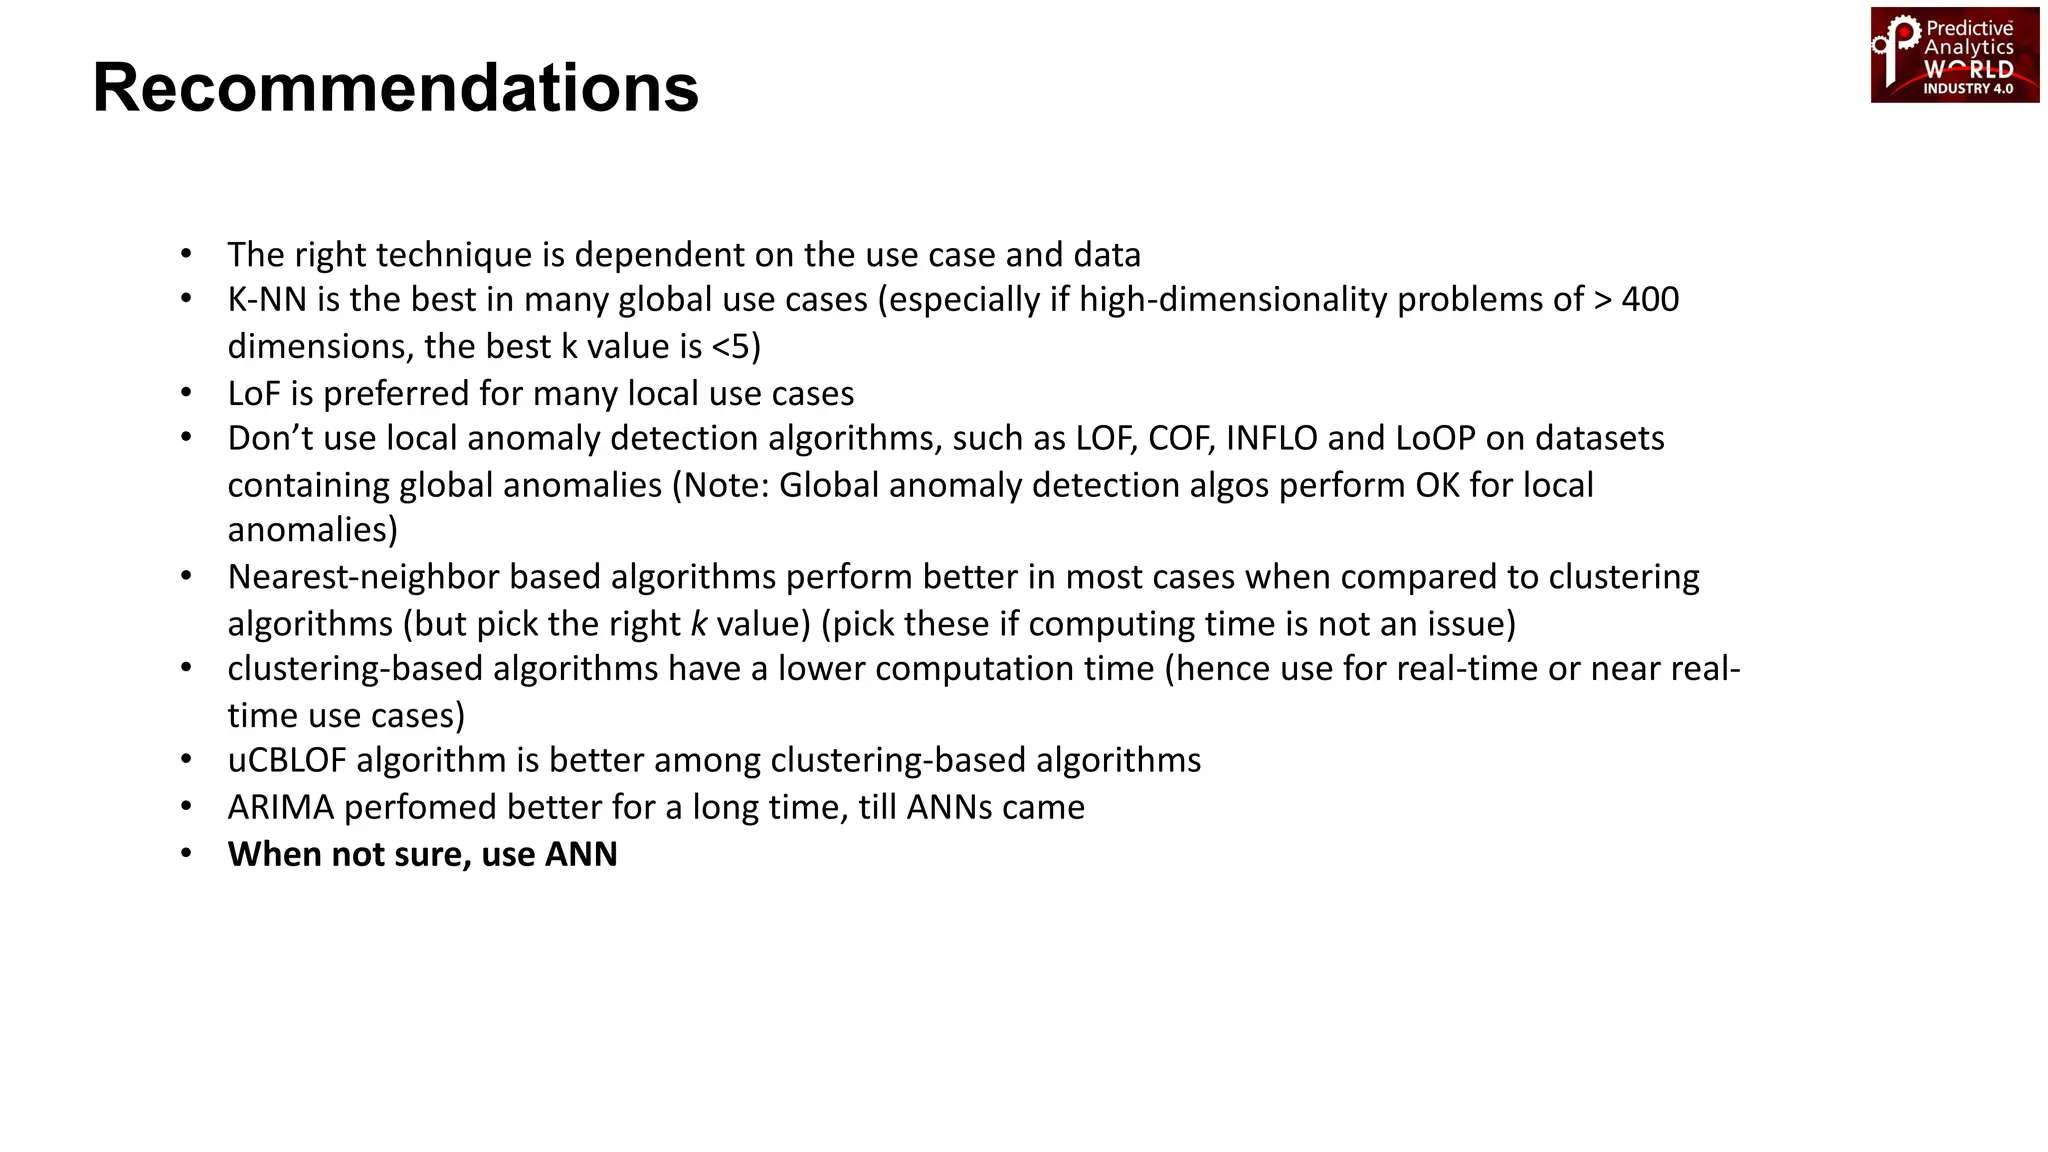
WSO2 Machine Learner takes data one step further, pairing data gathering and analytics with predictive intelligence: this helps you understand not just the present, but to predict scenarios and generate solutions for the future.
29 SETTEMBRE 2021 – Aula Magna – Corso Duca degli Abruzzi, 24 – Politecnico di Torino
Ricerca, trasferimento tecnologico e supporto alle aziende sui temi fondamentali dei Big Data, Intelligenza Artificiale, la robotica e la rivoluzione digitale
|QAB> : Quantum Computing, AI and BlockchainKan Yuenyong
The document discusses quantum computing, artificial intelligence, and blockchain. It describes how quantum computers could crack encryption like RSA much faster than classical computers. However, building a quantum computer with enough qubits to run algorithms like Shor's algorithm is not currently possible. The document also discusses how quantum computing could be a solution to problems caused by quantum effects at small scales. Photonic quantum computers that operate at room temperature and can scale to millions of qubits are also mentioned.
Smart E-Logistics for SCM Spend AnalysisIRJET Journal
This document discusses applying predictive analytics and machine learning techniques like LSTM models to supply chain management problems. It focuses on spend analysis and extracting fields from invoices and proofs of delivery using optical character recognition. The key points are:
1. LSTM models are applied to time series spend analysis data and shown to provide more accurate predictions than ARIMA models.
2. A technique is proposed to extract fields from printed and handwritten documents using models trained on Form Recognizer and then cleaning the extracted data.
3. The technique aims to reconcile invoices and proofs of delivery by comparing extracted data fields and calculating a match confidence score.
Auto-Train a Time-Series Forecast Model With AML + ADBDatabricks
Supply Chain, Healthcare, Insurance, and Finance often require highly accurate forecasting models in an enterprise large-scale fashion. With Azure Machine Learning on Azure Databricks, the scale and speed to large-scale many-models can be achieved and time-to-product decreases drastically. The better-together story poses an enterprise approach to AI/ML.
Azure AutoML offers an elegant solution efficiently to build forecasting models on Azure Databricks compute solving sophisticated business problems. The presentation covers the Azure Machine Learning + Azure Databricks approach (see slides attached) while the demo covers a hands-on business problem building a forecasting model in Azure Databricks using Azure Machine Learning. The AI/ML better-together story is elevated as MLFlow for Data Science Lifecycle Management and Hyperopt for distributed model execution completes AI/ML enterprise readiness for industry problems.
The document proposes a scalable constrained spectral clustering (SCACS) algorithm to improve the efficiency of existing constrained spectral clustering methods in handling moderate and large datasets. SCACS integrates sparse coding-based graph construction into the constrained normalized cuts framework. This allows it to scale to large datasets while maintaining high clustering accuracy comparable to state-of-the-art methods but with less computational time and side information. The algorithm is presented as the first efficient and scalable version for constrained spectral clustering.
Solving big data challenges for enterprise applicationTrieu Dao Minh
This document discusses the challenges of application performance monitoring (APM) systems that deal with "big data". APM systems instrument enterprise applications to monitor metrics like response times and failures across distributed systems. This generates enormous amounts of monitoring data. The document evaluates six open-source data stores (Cassandra, HBase, Voldemort, Redis, VoltDB, MySQL Cluster) for their ability to handle the throughput of APM workloads in memory-bound and disk-bound cluster setups. It aims to provide performance results, lessons learned on setup complexity, and insights for using these data stores in an industrial APM system context.
The Society of Petroleum Engineers Distinguished Lecturer Program provides funding through member donations and industry support to bring expert lecturers to discuss emerging topics. This lecture discusses how big data analytics can help petroleum engineers and geoscientists reduce costs, improve productivity and efficiency by analyzing large datasets to find patterns and relationships. Case studies demonstrate applications in reservoir modeling, production optimization, and predictive maintenance.
This article appeared in a journal published by Elsevier. The .docxhowardh5
This article appeared in a journal published by Elsevier. The attached
copy is furnished to the author for internal non-commercial research
and education use, including for instruction at the authors institution
and sharing with colleagues.
Other uses, including reproduction and distribution, or selling or
licensing copies, or posting to personal, institutional or third party
websites are prohibited.
In most cases authors are permitted to post their version of the
article (e.g. in Word or Tex form) to their personal website or
institutional repository. Authors requiring further information
regarding Elsevier’s archiving and manuscript policies are
encouraged to visit:
http://www.elsevier.com/authorsrights
Author's personal copy
A simheuristic algorithm for the Single-Period Stochastic
Inventory-Routing Problem with stock-outs
Angel A. Juan a,⇑, Scott E. Grasman b, Jose Caceres-Cruz a,1, Tolga Bektas� c
a Department of Computer Science, Multimedia, and Telecommunication, IN3-Open University of Catalonia, 08018 Barcelona, Spain
b Department of Industrial and Systems Engineering, Rochester Institute of Technology, USA
c Southampton Management School and Centre for Operational Research, Management Science and Information Systems (CORMSIS), University of Southampton, UK
a r t i c l e i n f o
Article history:
Available online 7 December 2013
Keywords:
Inventory-Routing Problem
Stochastic demands
Stock-outs
Simulation–optimization
Simheuristics
Randomized heuristics
a b s t r a c t
This paper describes a ‘simheuristic’ algorithm – one which combines simulation with
heuristics – for solving a stochastic variant of the well-known Inventory-Routing Problem.
The variant discussed here is integrated by a vehicle routing problem and several inventory
problems characterized by stochastic demands. Initial stock levels and potential stock-outs
are also considered, as well as a set of alternative refill policies for each retail center. The
goal is to find the personalized refill policies and associated routing plan that minimize, at
each single period, the expected total costs of the system, i.e., the sum of inventory and
routing costs. After motivating it, a detailed description of the problem is provided. Then,
a review of the related literature is performed and our simulation–optimization approach
is introduced. The paper presents a set of numerical experiments comparing the proposed
method against different refill strategies and discusses how total costs evolve as the level of
system uncertainty and the inventory-holding costs per unit are varied.
� 2013 Elsevier B.V. All rights reserved.
1. Introduction
One of the most important paradigms in supply chain management is to move from sequential decision making toward
integrated decision making, where all parties in the supply chain determine the best policy for the entire system. This is in
contrast to sequentially optimized decisions in supply chains.
Using Machine Learning to Quantify the Impact of Heterogeneous Data on Transf...Power System Operation
Using large-scale distributed computing and a variety of heterogeneous data sources including real-time sensor measurements, dissolved gas measurements, and localized historical weather, we construct a predictive model that allows us to accurately predict remaining useful life and failure probabilities for a fleet of network transformers. Our model is robust to highly variable data types, including both static and dynamic data, sparse and dense time series, and measurements of internal and external processes (such as weather). By comparing the predictive performance of models built on different combinations of these data sources, we can quantify the marginal benefit of including each additional data source in our model.
In order to relate each type of data to the risk of failure across a fleet of transformers, we have developed a novel class of survival models, the convex latent variable (CLV) model. This type of specialized survival model has several advantages. Rather than an opaque and subjective "health index", it produces interpretable predictions like the probability of failure within a given time window or the expected RUL of an asset. Our framework supports accurate estimates of the risk of equipment failure across a wide range of time-scales, from a few weeks to many years in the future, and can model not just the instantaneous risk of failure due to an event like a storm, but also the long-term impact on the risk of failure.
Real-Time Simulation for MBSE of Synchrophasor SystemsLuigi Vanfretti
This document discusses the development of a laboratory for testing and validating phasor measurement unit (PMU) applications using real-time hardware-in-the-loop (HIL) simulation. It describes the initial implementation of the lab in 2011 and outlines contributions to the model-based systems engineering foundations for cyber-physical power systems, including modeling for real-time simulation, experimental work developing and testing PMU applications using HIL, and several PMU-based monitoring applications that were implemented and tested.
The document outlines the phases and approach for developing a dynamic distribution model for a company. Phase 1 involves determining business objectives and key performance indicators. Phase 2 involves formulating a detailed mathematical model to optimize the supply chain network at both a strategic level, determining network structure, and operational level, generating schedules. The model will balance costs like transportation and inventory against objectives like delivery reliability.
The document outlines the phases and approach for developing a dynamic distribution model for a company. Phase 1 involves determining business objectives and key performance indicators. Phase 2 involves formulating a detailed mathematical model to optimize the supply chain network at both a strategic level, determining facility locations and inventory levels, and operational level, scheduling shipments. The model will balance costs like transportation and inventory against delivery reliability and customer service levels.
A Host Selection Algorithm for Dynamic Container Consolidation in Cloud Data ...IRJET Journal
This document proposes a novel host selection algorithm called Energy-Efficient Particle Swarm Optimization (EE-PSO) for dynamic container consolidation in cloud data centers. The goal of the algorithm is to reduce energy consumption while maintaining quality of service levels. It was tested using the ContainerCloudSim toolkit on real-world workloads and was found to outperform existing algorithms in terms of energy savings, quality of service guarantees, number of new virtual machines created, and number of container migrations.
Svm Classifier Algorithm for Data Stream Mining Using Hive and RIRJET Journal
This document proposes using Hive and R to perform data stream mining on big data. Hive is used to query and analyze large datasets stored in Hadoop. Test and trained datasets are extracted from the data using Hive queries. The Support Vector Machine (SVM) classifier algorithm analyzes the data to produce a statistical report in R, comparing the accuracy of linear and nonlinear models. The proposed method aims to improve data processing speed and ability to analyze large volumes of data as compared to other tools.
This document presents an approach for improving maintenance policies for multi-state systems. It first formalizes the transition process of a multi-state system using dynamic Bayesian networks. It then exhibits a cost function for preventive maintenance and an optimization method using reinforcement learning to identify the best combination of transition rates and preventive maintenance policy. The dynamic Bayesian network approach models the probability distributions of the system's state over time and allows for more compact representation compared to Markov chains. The reinforcement learning optimization seeks to minimize cost and maximize availability by learning the optimal preventive maintenance levels over the system's lifetime.
International Journal of Engineering Research and DevelopmentIJERD Editor
Electrical, Electronics and Computer Engineering,
Information Engineering and Technology,
Mechanical, Industrial and Manufacturing Engineering,
Automation and Mechatronics Engineering,
Material and Chemical Engineering,
Civil and Architecture Engineering,
Biotechnology and Bio Engineering,
Environmental Engineering,
Petroleum and Mining Engineering,
Marine and Agriculture engineering,
Aerospace Engineering.
Industrial IoT to Predictive Analytics: A Reverse Engineering Approach from S...Lokukaluge Prasad Perera
A novel mathematical framework to support industrial digitization of shipping is presented in this study. The framework supports a data flow path, i.e. from Industrial IoT (i.e. with Big Data) to Predictive Analytics, where digital models with advanced data analytics are introduced. The digital models are derived from ship performance and navigation data sets and a combination of such models facilitates towards the proposed Predictive Analytics. Since the respective data sets are used to derive the Predictive Analytics, this mathematical framework is also categorized as a reverse engineering approach. Furthermore, a data anomaly detection and recover procedure that is associated with the same framework to improve the respective data quality are also described in this study.
Data Mining: Mining stream time series and sequence dataDatamining Tools
This document discusses various methodologies for processing and analyzing stream data, time series data, and sequence data. It covers topics such as random sampling and sketches/synopses for stream data, data stream management systems and queries, the Hoeffding tree and Very Fast Decision Tree (VFDT) algorithms for classification, ensemble methods and concept drift, clustering of evolving data streams, trend analysis and similarity search for time series data, Markov chains for sequence analysis, and algorithms like the forward algorithm, Viterbi algorithm, and Baum-Welch algorithm for hidden Markov models.
This document discusses various methodologies for processing and analyzing stream data, time series data, and sequence data. It covers topics such as random sampling and sketches/synopses for stream data, data stream management systems, the Hoeffding tree and VFDT algorithms for stream data classification, concept-adapting algorithms, ensemble approaches, clustering of evolving data streams, time series databases, Markov chains for sequence analysis, and algorithms like the forward algorithm, Viterbi algorithm, and Baum-Welch algorithm for hidden Markov models.
"How to document your decisions", Dmytro Ovcharenko Fwdays
We will perform architecture kata around a proposed business case. We will review ADD in detail. How usually architecture vision document looks like. How to match your architecture drivers and proposed architecture decisions in architecture views. We will review what is ATAM and how to perform analysis of your decisions in the right way. And finally, we will create an architecture vision document from scratch.
Machine Learning and AI: Core Methods and ApplicationsQuantUniversity
This session was presented at the CFA Institute on May 6th 2020
This deep-dive session discusses core methods and applications to provide an understanding of supervised and unsupervised machine learning. Participants will be introduced to advanced topics that include time series analysis, reinforcement learning, anomaly detection, and natural language processing. Case studies will also examine how to predict interest rates and credit risk with alternative data sets and how to analyze earning calls from EDGAR using Natural Language Processing Techniques.
Towards a Better Comprehensibility of Web Applications: Lessons Learned from ...Porfirio Tramontana
The rapid diffusion of Internet has triggered a growing request for new Web sites and Web Applications (WA).
Due to the pressing market demand, new WAs are usually developed in a very short time, while existing WAs are modified frequently and quickly. In these conditions, the well-known software engineering principles are not usually applied, as well as well-defined software processes and methodologies are rarely adopted. As a consequence, WAs usually present disordered architectures, poor or non-existing documentation, and can be analyzed, comprehended and modified with a considerable effort.
Reverse engineering methods and tools are being proposed in order to reduce the effort required to comprehend existing WAs and to support their maintenance and evolution. In this paper, the experimentation of a reverse engineering approach is described. Experimentation was carried out with the aim of assessing which characteristics of a WA mostly affect comprehensibility. The results of the experiments highlighted a set of techniques and best practices that should be applied for producing best analyzable and maintainable WAs.
This document discusses challenges with running containers at scale and how artificial intelligence for IT operations (AIOps) can help address those challenges. It defines AIOps and outlines how it utilizes techniques like machine learning and analytics to provide proactive, personalized insights for infrastructure and application monitoring. Specific challenges covered include reactive monitoring of dynamic container environments, metrics explosions, and performing proactive tasks like capacity planning, cluster scheduling, and dynamic configuration optimization. The document provides examples of how AIOps has helped companies optimize infrastructure usage through techniques like exhaustive testing of hardware/software combinations, live traffic load testing, bottleneck identification, batch scheduling, and controlled resource oversubscription while maintaining service level objectives.
To Get any Project for CSE, IT ECE, EEE Contact Me @ 09666155510, 09849539085 or mail us - ieeefinalsemprojects@gmail.com-Visit Our Website: www.finalyearprojects.org
Application of Lotka-Volterra model to analyse Cloud behavior and optimise re...IJSRP Journal
Cloud is a complex distributed environment which has occupied the center stage in the modern-day service computing; allowing permissive resource provisioning with minimalistic conflict and enabling on-demand, pay-per-use benefits. Provisioning of resources in a dynamic environment, such that none are under-provisioned or over-provisioned is a primal challenge. The problem is analysed, and an optimal resource allocation strategy is formulated by the quantitative analysis of a biologically inspired model called Lotka-Volterra.
AI to open more doors in Personal Finance Management (PFM)SK Reddy
AI and machine learning techniques are increasingly being used in personal finance management and credit scoring applications. Some key points from the document:
1. AI and machine learning can help open more doors by using non-traditional data sources like mobile phone metadata to assess creditworthiness for those without credit histories.
2. Various machine learning classifiers like random forests, SVMs, and neural networks are being applied to tasks like credit fraud detection, predicting bankruptcies, and nowcasting recessions.
3. Emerging techniques like uplift modeling and autoencoders are helping financial institutions better understand customer behaviors and tailor marketing campaigns.
This document provides an overview of deep learning techniques for 3D point clouds. It summarizes several seminal papers that apply deep learning to point clouds, including PointNet, PointNet++, SplatNet, and MRTNet. It also lists popular 3D point cloud datasets and libraries like Point Cloud Library and Cilantro that are useful for deep learning on 3D point clouds.
More Related Content
Similar to Finding the right Machine Learning method for predictive modeling
This article appeared in a journal published by Elsevier. The .docxhowardh5
This article appeared in a journal published by Elsevier. The attached
copy is furnished to the author for internal non-commercial research
and education use, including for instruction at the authors institution
and sharing with colleagues.
Other uses, including reproduction and distribution, or selling or
licensing copies, or posting to personal, institutional or third party
websites are prohibited.
In most cases authors are permitted to post their version of the
article (e.g. in Word or Tex form) to their personal website or
institutional repository. Authors requiring further information
regarding Elsevier’s archiving and manuscript policies are
encouraged to visit:
http://www.elsevier.com/authorsrights
Author's personal copy
A simheuristic algorithm for the Single-Period Stochastic
Inventory-Routing Problem with stock-outs
Angel A. Juan a,⇑, Scott E. Grasman b, Jose Caceres-Cruz a,1, Tolga Bektas� c
a Department of Computer Science, Multimedia, and Telecommunication, IN3-Open University of Catalonia, 08018 Barcelona, Spain
b Department of Industrial and Systems Engineering, Rochester Institute of Technology, USA
c Southampton Management School and Centre for Operational Research, Management Science and Information Systems (CORMSIS), University of Southampton, UK
a r t i c l e i n f o
Article history:
Available online 7 December 2013
Keywords:
Inventory-Routing Problem
Stochastic demands
Stock-outs
Simulation–optimization
Simheuristics
Randomized heuristics
a b s t r a c t
This paper describes a ‘simheuristic’ algorithm – one which combines simulation with
heuristics – for solving a stochastic variant of the well-known Inventory-Routing Problem.
The variant discussed here is integrated by a vehicle routing problem and several inventory
problems characterized by stochastic demands. Initial stock levels and potential stock-outs
are also considered, as well as a set of alternative refill policies for each retail center. The
goal is to find the personalized refill policies and associated routing plan that minimize, at
each single period, the expected total costs of the system, i.e., the sum of inventory and
routing costs. After motivating it, a detailed description of the problem is provided. Then,
a review of the related literature is performed and our simulation–optimization approach
is introduced. The paper presents a set of numerical experiments comparing the proposed
method against different refill strategies and discusses how total costs evolve as the level of
system uncertainty and the inventory-holding costs per unit are varied.
� 2013 Elsevier B.V. All rights reserved.
1. Introduction
One of the most important paradigms in supply chain management is to move from sequential decision making toward
integrated decision making, where all parties in the supply chain determine the best policy for the entire system. This is in
contrast to sequentially optimized decisions in supply chains.
Using Machine Learning to Quantify the Impact of Heterogeneous Data on Transf...Power System Operation
Using large-scale distributed computing and a variety of heterogeneous data sources including real-time sensor measurements, dissolved gas measurements, and localized historical weather, we construct a predictive model that allows us to accurately predict remaining useful life and failure probabilities for a fleet of network transformers. Our model is robust to highly variable data types, including both static and dynamic data, sparse and dense time series, and measurements of internal and external processes (such as weather). By comparing the predictive performance of models built on different combinations of these data sources, we can quantify the marginal benefit of including each additional data source in our model.
In order to relate each type of data to the risk of failure across a fleet of transformers, we have developed a novel class of survival models, the convex latent variable (CLV) model. This type of specialized survival model has several advantages. Rather than an opaque and subjective "health index", it produces interpretable predictions like the probability of failure within a given time window or the expected RUL of an asset. Our framework supports accurate estimates of the risk of equipment failure across a wide range of time-scales, from a few weeks to many years in the future, and can model not just the instantaneous risk of failure due to an event like a storm, but also the long-term impact on the risk of failure.
Real-Time Simulation for MBSE of Synchrophasor SystemsLuigi Vanfretti
This document discusses the development of a laboratory for testing and validating phasor measurement unit (PMU) applications using real-time hardware-in-the-loop (HIL) simulation. It describes the initial implementation of the lab in 2011 and outlines contributions to the model-based systems engineering foundations for cyber-physical power systems, including modeling for real-time simulation, experimental work developing and testing PMU applications using HIL, and several PMU-based monitoring applications that were implemented and tested.
The document outlines the phases and approach for developing a dynamic distribution model for a company. Phase 1 involves determining business objectives and key performance indicators. Phase 2 involves formulating a detailed mathematical model to optimize the supply chain network at both a strategic level, determining network structure, and operational level, generating schedules. The model will balance costs like transportation and inventory against objectives like delivery reliability.
The document outlines the phases and approach for developing a dynamic distribution model for a company. Phase 1 involves determining business objectives and key performance indicators. Phase 2 involves formulating a detailed mathematical model to optimize the supply chain network at both a strategic level, determining facility locations and inventory levels, and operational level, scheduling shipments. The model will balance costs like transportation and inventory against delivery reliability and customer service levels.
A Host Selection Algorithm for Dynamic Container Consolidation in Cloud Data ...IRJET Journal
This document proposes a novel host selection algorithm called Energy-Efficient Particle Swarm Optimization (EE-PSO) for dynamic container consolidation in cloud data centers. The goal of the algorithm is to reduce energy consumption while maintaining quality of service levels. It was tested using the ContainerCloudSim toolkit on real-world workloads and was found to outperform existing algorithms in terms of energy savings, quality of service guarantees, number of new virtual machines created, and number of container migrations.
Svm Classifier Algorithm for Data Stream Mining Using Hive and RIRJET Journal
This document proposes using Hive and R to perform data stream mining on big data. Hive is used to query and analyze large datasets stored in Hadoop. Test and trained datasets are extracted from the data using Hive queries. The Support Vector Machine (SVM) classifier algorithm analyzes the data to produce a statistical report in R, comparing the accuracy of linear and nonlinear models. The proposed method aims to improve data processing speed and ability to analyze large volumes of data as compared to other tools.
This document presents an approach for improving maintenance policies for multi-state systems. It first formalizes the transition process of a multi-state system using dynamic Bayesian networks. It then exhibits a cost function for preventive maintenance and an optimization method using reinforcement learning to identify the best combination of transition rates and preventive maintenance policy. The dynamic Bayesian network approach models the probability distributions of the system's state over time and allows for more compact representation compared to Markov chains. The reinforcement learning optimization seeks to minimize cost and maximize availability by learning the optimal preventive maintenance levels over the system's lifetime.
International Journal of Engineering Research and DevelopmentIJERD Editor
Electrical, Electronics and Computer Engineering,
Information Engineering and Technology,
Mechanical, Industrial and Manufacturing Engineering,
Automation and Mechatronics Engineering,
Material and Chemical Engineering,
Civil and Architecture Engineering,
Biotechnology and Bio Engineering,
Environmental Engineering,
Petroleum and Mining Engineering,
Marine and Agriculture engineering,
Aerospace Engineering.
Industrial IoT to Predictive Analytics: A Reverse Engineering Approach from S...Lokukaluge Prasad Perera
A novel mathematical framework to support industrial digitization of shipping is presented in this study. The framework supports a data flow path, i.e. from Industrial IoT (i.e. with Big Data) to Predictive Analytics, where digital models with advanced data analytics are introduced. The digital models are derived from ship performance and navigation data sets and a combination of such models facilitates towards the proposed Predictive Analytics. Since the respective data sets are used to derive the Predictive Analytics, this mathematical framework is also categorized as a reverse engineering approach. Furthermore, a data anomaly detection and recover procedure that is associated with the same framework to improve the respective data quality are also described in this study.
Data Mining: Mining stream time series and sequence dataDatamining Tools
This document discusses various methodologies for processing and analyzing stream data, time series data, and sequence data. It covers topics such as random sampling and sketches/synopses for stream data, data stream management systems and queries, the Hoeffding tree and Very Fast Decision Tree (VFDT) algorithms for classification, ensemble methods and concept drift, clustering of evolving data streams, trend analysis and similarity search for time series data, Markov chains for sequence analysis, and algorithms like the forward algorithm, Viterbi algorithm, and Baum-Welch algorithm for hidden Markov models.
This document discusses various methodologies for processing and analyzing stream data, time series data, and sequence data. It covers topics such as random sampling and sketches/synopses for stream data, data stream management systems, the Hoeffding tree and VFDT algorithms for stream data classification, concept-adapting algorithms, ensemble approaches, clustering of evolving data streams, time series databases, Markov chains for sequence analysis, and algorithms like the forward algorithm, Viterbi algorithm, and Baum-Welch algorithm for hidden Markov models.
"How to document your decisions", Dmytro Ovcharenko Fwdays
We will perform architecture kata around a proposed business case. We will review ADD in detail. How usually architecture vision document looks like. How to match your architecture drivers and proposed architecture decisions in architecture views. We will review what is ATAM and how to perform analysis of your decisions in the right way. And finally, we will create an architecture vision document from scratch.
Machine Learning and AI: Core Methods and ApplicationsQuantUniversity
This session was presented at the CFA Institute on May 6th 2020
This deep-dive session discusses core methods and applications to provide an understanding of supervised and unsupervised machine learning. Participants will be introduced to advanced topics that include time series analysis, reinforcement learning, anomaly detection, and natural language processing. Case studies will also examine how to predict interest rates and credit risk with alternative data sets and how to analyze earning calls from EDGAR using Natural Language Processing Techniques.
Towards a Better Comprehensibility of Web Applications: Lessons Learned from ...Porfirio Tramontana
The rapid diffusion of Internet has triggered a growing request for new Web sites and Web Applications (WA).
Due to the pressing market demand, new WAs are usually developed in a very short time, while existing WAs are modified frequently and quickly. In these conditions, the well-known software engineering principles are not usually applied, as well as well-defined software processes and methodologies are rarely adopted. As a consequence, WAs usually present disordered architectures, poor or non-existing documentation, and can be analyzed, comprehended and modified with a considerable effort.
Reverse engineering methods and tools are being proposed in order to reduce the effort required to comprehend existing WAs and to support their maintenance and evolution. In this paper, the experimentation of a reverse engineering approach is described. Experimentation was carried out with the aim of assessing which characteristics of a WA mostly affect comprehensibility. The results of the experiments highlighted a set of techniques and best practices that should be applied for producing best analyzable and maintainable WAs.
This document discusses challenges with running containers at scale and how artificial intelligence for IT operations (AIOps) can help address those challenges. It defines AIOps and outlines how it utilizes techniques like machine learning and analytics to provide proactive, personalized insights for infrastructure and application monitoring. Specific challenges covered include reactive monitoring of dynamic container environments, metrics explosions, and performing proactive tasks like capacity planning, cluster scheduling, and dynamic configuration optimization. The document provides examples of how AIOps has helped companies optimize infrastructure usage through techniques like exhaustive testing of hardware/software combinations, live traffic load testing, bottleneck identification, batch scheduling, and controlled resource oversubscription while maintaining service level objectives.
To Get any Project for CSE, IT ECE, EEE Contact Me @ 09666155510, 09849539085 or mail us - ieeefinalsemprojects@gmail.com-Visit Our Website: www.finalyearprojects.org
Application of Lotka-Volterra model to analyse Cloud behavior and optimise re...IJSRP Journal
Cloud is a complex distributed environment which has occupied the center stage in the modern-day service computing; allowing permissive resource provisioning with minimalistic conflict and enabling on-demand, pay-per-use benefits. Provisioning of resources in a dynamic environment, such that none are under-provisioned or over-provisioned is a primal challenge. The problem is analysed, and an optimal resource allocation strategy is formulated by the quantitative analysis of a biologically inspired model called Lotka-Volterra.
Similar to Finding the right Machine Learning method for predictive modeling (20)
AI to open more doors in Personal Finance Management (PFM)SK Reddy
AI and machine learning techniques are increasingly being used in personal finance management and credit scoring applications. Some key points from the document:
1. AI and machine learning can help open more doors by using non-traditional data sources like mobile phone metadata to assess creditworthiness for those without credit histories.
2. Various machine learning classifiers like random forests, SVMs, and neural networks are being applied to tasks like credit fraud detection, predicting bankruptcies, and nowcasting recessions.
3. Emerging techniques like uplift modeling and autoencoders are helping financial institutions better understand customer behaviors and tailor marketing campaigns.
This document provides an overview of deep learning techniques for 3D point clouds. It summarizes several seminal papers that apply deep learning to point clouds, including PointNet, PointNet++, SplatNet, and MRTNet. It also lists popular 3D point cloud datasets and libraries like Point Cloud Library and Cilantro that are useful for deep learning on 3D point clouds.
This document provides guidance on how organizations can get ready for artificial intelligence (AI). It begins with definitions of common AI tasks like image recognition, games, and speech recognition. It then discusses challenges to AI adoption like expectations, talent shortages, and data issues. A checklist is provided for organizations to assess their AI readiness in areas like awareness, capability, data, plans, and getting external help. Key questions for executives are outlined. Case studies and approaches from companies that have successfully implemented AI strategies are referenced. The document aims to help organizations understand both the opportunities and challenges of AI, and develop plans to incorporate it effectively.
Practical implementation of AI solutions for Smart Cities SK Reddy
AI is helping smart cities in many ways such as:
1. Analyzing video data to detect human actions, traffic flow, and count cars in parking lots.
2. Using deep learning models and sensor data to predict taxi demand and optimize issues like parking availability, public transportation times, and traffic light timing.
3. Large-scale mapping applications using geo-tagged videos to map events like parades and analyze spatial data.
This document discusses various recommender systems that use deep learning techniques. It summarizes different recommendation models used by companies like Amazon, Google Play, and YouTube. It also outlines recommendation algorithms like matrix factorization, denoising autoencoders, and recurrent neural networks. Finally, it provides references to papers on embedding-based news recommendation and context-aware personalized point-of-interest sequence recommendation.
I spoke in Prepare AI conference (http://prepare.ai/conference/conference-agenda-details/) in May 2018. Though I spoke on a similar talk previously, this presentation is targeted to beginners in Recommendation Systems. In this presentation I talk a little more fundamental details.
Deep Learning (DL) Solutions for Smart City use casesSK Reddy
Deep Learning techniques are being used to address challenges in Smart Cities. Though many use cases have been solved independently, stitching these solutions together using a flexible, scalable and efficient architecture is difficult. We developed a platform for Smart Cities. Here are some technical papers and solutions that inspired us in the process. The youtube video could be found at https://youtu.be/LFB83yrbqEc .
This is a presentation I shared in Global BigData Conference in Apr2018 (http://www.globalbigdataconference.com/santa-clara/global-data-science-conference-98/speaker-details/sk-reddy-62567.html).
This document contains summaries and links related to various applications of artificial intelligence including generating structured queries from natural language using reinforcement learning, using AI in healthcare to direct clinical information to the right clinicians, generating fine-grained text to image translations with attentional GANs, detecting pneumonia from chest X-rays using a dense convolutional neural network, using AI for cross-modal fashion attribute search, counting cars in parking lots using object detection models, and analyzing videos of human actions using 3D convolutional neural networks. The document also lists potential applications of AI such as generating trendy names, designs, recipes, and more.
How NLP is revolutionizing marketing and communications SK Reddy
This presentation was shared on 6 March 2018 in Stockholm in AI Summit for Marketing conference (http://www.aiformarketingsummit.se/#talare). I explained some use cases for AI in Marketing and the implementation details.
This is a presentation I shared in Practically AI on 1 Mar 2018. I shared the architectural details of our Smart City platform and also some examples of prominent architectures that are used by organizations. I also discussed some specific implementation details of Smart City uses cases like Face Re-Id, Vehicle Re-Id, Detecting and Counting Cars in a parking lot, etc.
SF ACM Bay chapter meetup on NLP will revolutionize the world SK Reddy
The document discusses various topics related to natural language processing (NLP) including uses of NLP in different domains like healthcare, legal, publishing and financial services. It provides examples of how NLP is used in tasks like machine translation, question answering, text summarization and more. It also discusses different machine learning models used for NLP like RNNs, LSTMs, attention mechanisms, Transformer models and multi-task learning frameworks.
The Magic of Text Summarization using Deep NetworksSK Reddy
Slides used for presenting the topic "The Magic of Text Summarization using Deep Networks" on 12 Sep 2017 as part of H2O meetup. The video of the presentation could be found on YouTube at https://youtu.be/8IxKnOXMIzI
The magic of machine translation 20 july 2017SK Reddy
This is a presentation about Neural Machine Translation. I have discussed the 'what' and 'how' of language translation using neural networks. This tech talk was presented in Silicon Valley Indian professionals org (SIPA.org). In this presentation I discuss the basics of neural networks, the basics of Language Translation and various techniques of using neural networks to translate languages.
Summarization and Abstraction using deep learningSK Reddy
In this presentation I share the results of my research on how to summarize text using deep learning. I also talk about the contemporary research into summarization and the consequent results. Summarization and abstraction is a quite exciting area of research with huge business potential. Extracting wisdom from documentation using deep learning will quicken humankind's absorption of knowledge and information.
Question Answering in NLP on Mahabharata 24 may 2017SK Reddy
Here is a presentation about my research to train deep neural networks to comprehend text. I selected a famous and untouched epic Indian story to train an LSTM and a Bidirectional-LSTM to comprehend the story and answer questions. The experiment including pre-processing the text, creating word vectors, defining an LSTM and a BiLSTM model, training the model and testing the model
Learn SQL from basic queries to Advance queriesmanishkhaire30
Dive into the world of data analysis with our comprehensive guide on mastering SQL! This presentation offers a practical approach to learning SQL, focusing on real-world applications and hands-on practice. Whether you're a beginner or looking to sharpen your skills, this guide provides the tools you need to extract, analyze, and interpret data effectively.
Key Highlights:
Foundations of SQL: Understand the basics of SQL, including data retrieval, filtering, and aggregation.
Advanced Queries: Learn to craft complex queries to uncover deep insights from your data.
Data Trends and Patterns: Discover how to identify and interpret trends and patterns in your datasets.
Practical Examples: Follow step-by-step examples to apply SQL techniques in real-world scenarios.
Actionable Insights: Gain the skills to derive actionable insights that drive informed decision-making.
Join us on this journey to enhance your data analysis capabilities and unlock the full potential of SQL. Perfect for data enthusiasts, analysts, and anyone eager to harness the power of data!
#DataAnalysis #SQL #LearningSQL #DataInsights #DataScience #Analytics
The Ipsos - AI - Monitor 2024 Report.pdfSocial Samosa
According to Ipsos AI Monitor's 2024 report, 65% Indians said that products and services using AI have profoundly changed their daily life in the past 3-5 years.
Global Situational Awareness of A.I. and where its headedvikram sood
You can see the future first in San Francisco.
Over the past year, the talk of the town has shifted from $10 billion compute clusters to $100 billion clusters to trillion-dollar clusters. Every six months another zero is added to the boardroom plans. Behind the scenes, there’s a fierce scramble to secure every power contract still available for the rest of the decade, every voltage transformer that can possibly be procured. American big business is gearing up to pour trillions of dollars into a long-unseen mobilization of American industrial might. By the end of the decade, American electricity production will have grown tens of percent; from the shale fields of Pennsylvania to the solar farms of Nevada, hundreds of millions of GPUs will hum.
The AGI race has begun. We are building machines that can think and reason. By 2025/26, these machines will outpace college graduates. By the end of the decade, they will be smarter than you or I; we will have superintelligence, in the true sense of the word. Along the way, national security forces not seen in half a century will be un-leashed, and before long, The Project will be on. If we’re lucky, we’ll be in an all-out race with the CCP; if we’re unlucky, an all-out war.
Everyone is now talking about AI, but few have the faintest glimmer of what is about to hit them. Nvidia analysts still think 2024 might be close to the peak. Mainstream pundits are stuck on the wilful blindness of “it’s just predicting the next word”. They see only hype and business-as-usual; at most they entertain another internet-scale technological change.
Before long, the world will wake up. But right now, there are perhaps a few hundred people, most of them in San Francisco and the AI labs, that have situational awareness. Through whatever peculiar forces of fate, I have found myself amongst them. A few years ago, these people were derided as crazy—but they trusted the trendlines, which allowed them to correctly predict the AI advances of the past few years. Whether these people are also right about the next few years remains to be seen. But these are very smart people—the smartest people I have ever met—and they are the ones building this technology. Perhaps they will be an odd footnote in history, or perhaps they will go down in history like Szilard and Oppenheimer and Teller. If they are seeing the future even close to correctly, we are in for a wild ride.
Let me tell you what we see.
Predictably Improve Your B2B Tech Company's Performance by Leveraging DataKiwi Creative
Harness the power of AI-backed reports, benchmarking and data analysis to predict trends and detect anomalies in your marketing efforts.
Peter Caputa, CEO at Databox, reveals how you can discover the strategies and tools to increase your growth rate (and margins!).
From metrics to track to data habits to pick up, enhance your reporting for powerful insights to improve your B2B tech company's marketing.
- - -
This is the webinar recording from the June 2024 HubSpot User Group (HUG) for B2B Technology USA.
Watch the video recording at https://youtu.be/5vjwGfPN9lw
Sign up for future HUG events at https://events.hubspot.com/b2b-technology-usa/
Analysis insight about a Flyball dog competition team's performanceroli9797
Insight of my analysis about a Flyball dog competition team's last year performance. Find more: https://github.com/rolandnagy-ds/flyball_race_analysis/tree/main
ViewShift: Hassle-free Dynamic Policy Enforcement for Every Data LakeWalaa Eldin Moustafa
Dynamic policy enforcement is becoming an increasingly important topic in today’s world where data privacy and compliance is a top priority for companies, individuals, and regulators alike. In these slides, we discuss how LinkedIn implements a powerful dynamic policy enforcement engine, called ViewShift, and integrates it within its data lake. We show the query engine architecture and how catalog implementations can automatically route table resolutions to compliance-enforcing SQL views. Such views have a set of very interesting properties: (1) They are auto-generated from declarative data annotations. (2) They respect user-level consent and preferences (3) They are context-aware, encoding a different set of transformations for different use cases (4) They are portable; while the SQL logic is only implemented in one SQL dialect, it is accessible in all engines.
#SQL #Views #Privacy #Compliance #DataLake
STATATHON: Unleashing the Power of Statistics in a 48-Hour Knowledge Extravag...sameer shah
"Join us for STATATHON, a dynamic 2-day event dedicated to exploring statistical knowledge and its real-world applications. From theory to practice, participants engage in intensive learning sessions, workshops, and challenges, fostering a deeper understanding of statistical methodologies and their significance in various fields."
Open Source Contributions to Postgres: The Basics POSETTE 2024ElizabethGarrettChri
Postgres is the most advanced open-source database in the world and it's supported by a community, not a single company. So how does this work? How does code actually get into Postgres? I recently had a patch submitted and committed and I want to share what I learned in that process. I’ll give you an overview of Postgres versions and how the underlying project codebase functions. I’ll also show you the process for submitting a patch and getting that tested and committed.
12. Predicting the real-time availability of 200 million grocery items -
Instacart
https://tech.instacart.com/predicting-real-time-availability-of-200-million-grocery-items-in-us-canada-stores-61f43a16eafe
The problem:
understanding “not founds”
Routes followed by shoppers in SF, Austin, Boston and Miami
https://tech.instacart.com/space-time-and-groceries-a315925acf3a
14. Feature engineering: item level features, time-based features, and categorical features
https://tech.instacart.com/predicting-real-time-availability-of-200-million-grocery-items-in-us-canada-stores-61f43a16eafe
https://tech.instacart.com/3-million-instacart-orders-open-sourced-d40d29ead6f2
Predicting the real-time availability of 200 million grocery items -
Instacart
15. Leveraging Elastic Demand for Forecasting
https://tech.instacart.com/leveraging-elastic-demand-for-forecasting-6278b45f805f; https://arxiv.org/pdf/1809.03018.pdf
16. Goal: shifting the right amount of elastic demand to minimize the difference between the new
demand series
Input: historical demand series, and the amount of elastic demand
Output: shifted demand series
Leveraging Elastic Demand for Forecasting
https://tech.instacart.com/leveraging-elastic-demand-for-forecasting-6278b45f805f; https://arxiv.org/pdf/1809.03018.pdf
17. Leveraging Elastic Demand for Forecasting
https://tech.instacart.com/leveraging-elastic-demand-for-forecasting-6278b45f805f; https://arxiv.org/pdf/1809.03018.pdf
Demand Variance
18. Leveraging Elastic Demand for Forecasting
A larger amount of elastic demand leads to
a smaller variance. However, the first 10%
elastic demand produces the largest
variance reduction.
https://tech.instacart.com/leveraging-elastic-demand-for-forecasting-6278b45f805f; https://arxiv.org/pdf/1809.03018.pdf
19. Predicting creditworthiness in retail banking with limited scoring data
https://www.sciencedirect.com/science/article/pii/S0950705116300156?via%3Dihub 19
20. Credit Card Fraud Detection
http://isyou.info/inpra/papers/inpra-v5n4-02.pdf
Characteristic of the mobile payment dataset
F-measure after classification
20
21. “Nowcasting” Recession
https://arxiv.org/pdf/1903.03202.pdf
SVM:
• Linear (classes separable with a linear
hyperplane)
• Non-linear
Features
1. Monthly log difference in nonfarm payrolls
2. Log difference in average monthly price of
the S&P 500
3. Production index from Manufacturing ISM
Report (info about the goods market)
4. 10-year Treasury yield minus the federal
funds rate
SVM Dual Parameter and NBER Recessions
21
22. 22https://arxiv.org/pdf/1804.10796.pdf
Handling Uncertainty in Social Lending
Credit Risk Prediction
The results of combining the three classifiers through a Choquet fuzzy integral
approach compared to the performance of each base classifiers alone
25. 25
Predicting bankruptcy –
evaluating the performance of various methods
https://towardsdatascience.com/predicting-bankruptcy-f4611afe8d2c
Classifiers tried
1. Logistic Regression
2. Perceptron as a classifier
3. Deep Neural Network Classifiers (with different size and
depth)
4. Fischer Linear Discriminant Analysis
5. K Nearest Neighbor Classifier (with different values of k)
6. Naive Bayes Classifier
7. Decision Tree (with different bucket size thresholds)
8. Bagged Decision Trees
9. Random Forest (with different tree sizes)
10. Gradient Boosting
11. Support Vector Machines (with different kernels)
Random Forest
kNN
31. Anomaly detection approach within the context of an X-ray security screening problem
GANomaly: Semi-Supervised Anomaly Detection via
Adversarial Training; 2018
https://arxiv.org/pdf/1805.06725.pdf
32. AAD: Adaptive Anomaly Detection through traffic surveillance videos
Pixel movement across the frame after ∆t
PASCAL Visual Object Classes
https://arxiv.org/pdf/1808.10044.pdf
34. RADS: Real-time Anomaly Detection System for Cloud Data Centers
https://arxiv.org/pdf/1811.04481.pdf
35. 15 Million Battery Voltages and Current
Example: Anomaly Detection of Sensor Data Using
Distance-Based Failure Analysis
Sensor data from the same 15m Batteries
Can you find the anomaly?
37. The demand data over the 2010-2015 timeframe
Combining Multiple Methods To Improve Time Series Prediction
Step 1Step 2
Step 3
The estimated trend (Hodrick-Prescott Filter)
• Trend (the increase or decrease in the
series over a period of time),
• Seasonality (the fluctuation that occurs
within the series over each week, each
month, etc.)
• Residuals (the data point that falls outside
of the expected data range)
Multi-seasonality (Loess method)
Step 4
Step 5
(after Elastic Net Regression and Fourier
transformation)
https://labs.eleks.com/2016/10/combined-different-methods-create-advanced-time-series-prediction.html
39. Modeling and Forecasting
Vehicle Fleet Maintenance
https://arxiv.org/pdf/1710.06839.pdf
Vehicles
Maintenance
(a) 3-mode data tensor; (b) the same tensor as a stacked series of frontal slices, or
arrays; (c) an example single frontal slice of a vehicle data tensor used in this analysis
(each entry corresponds to the count of a specific job type for a vehicle at a fixed time)
40. Vehicle Fleet Maintenance
PARAFAC 3-way plot of absolute-time analysis. High factor weights in
the top panel are for 2014 Terrastar Horton vehicles, an ambulance.
The bottom two panels show systems (Body, Cab/Sheet Metal,
Engine and Motor, and Preventive Maintenance Service) and time
frames where this maintenance most often occurs.
https://arxiv.org/pdf/1710.06839.pdf
PARAFAC 3-way plot of vehicle lifetime analysis revealing a simple
pattern common to almost all vehicles, as demonstrated by the
consistent loading across the vehicle factor (top panel):
tires/tubes/valves/liners replacement during the second year of
lifetime, with few repairs to this system either before or after.
41. Vehicle Fleet Maintenance
https://arxiv.org/pdf/1710.06839.pdf
PARAFAC 3-way plot of vehicle lifetime analysis showing the
2012 Freightliner M2112V, a Department of Solid Waste
garbage truck. This plot reveals a strong pattern of increased
maintenance in years 2-4 after purchase, focusing on a variety
of technical systems: hydraulics, lighting, gauges and warning
devices, and cooling systems.
PARAFAC 3-way plot of absolute-time analysis. This plot demonstrates
strong and specific maintenance patterns for the 2015 Smeal SST
Pumper fire truck. It shows extensive and specific repair to the engine
systems with little other maintenance, from late 2015 through 2016.
42. • Local Outlier Factor (LOF)
• Connectivity-Based Outlier Factor
(COF)
• Influenced Outlierness (INFLO)
• Local Outlier Probability (LoOP)
• Local Correlation Integral (LOCI)
• Approximate Local Correlation
Integral (aLOCI)
• Cluster-Based Local Outlier Factor
(CBLOF/ uCBLOF)
• Local Density Cluster-based
Outlier Factor (LDCOF)
• Clustering-based Multivariate
Gaussian Outlier Score (CMGOS)
• Histogram-based Outlier Score
(HBOS)
• One-Class Support Vector
Machine
• Robust Principal Component
Analysis (rPCA)
https://journals.plos.org/plosone/article?id=10.1371/journal.pone.0152173
43. Nearest-Neighbor based algorithms on the breast-cancer dataset Clustering-based anomaly detection algorithms
https://journals.plos.org/plosone/article?id=10.1371/journal.pone.0152173
46. Autoencoder architectures for anomaly detection
Other DAD Anomaly detection models
• Transfer Learning based anomaly
detection
• Zero Shot learning based anomaly
detection
• Ensemble based anomaly detection
• Clustering based anomaly detection
• Deep Reinforcement Learning (DRL)
based anomaly detection
https://arxiv.org/pdf/1901.03407v1.pdf
SDAE: Stacked Denoising Autoencoder, DAE : Denoising Autoencoders
GRU: Gated Recurrent Unit, CNN: Convolutional Neural Networks
LSTM: Long Short Term Memory, AE: Autoencoders
CAE: Convolutional Autoencoders
47. • Classification - predicts a failure in next n-steps.
• Logistic Regression
• Perceptron as a classifier
• Deep Neural Network Classifiers (with different size
and depth)
• Fischer Linear Discriminant Analysis
• K Nearest Neighbor Classifier (with different values
of k)
• Naive Bayes Classifier
• Decision Tree (with different bucket size
thresholds)
• Bagged Decision Trees
• Random Forest (with different tree sizes)
• Gradient Boosting
• Support Vector Machines (with different kernels)
• Regression - predicts how much time is left before the
next failure called Remaining Useful Life .
ML Techniques for Predictive Maintenance
• Supervised Anomaly Detection: fully labeled
training and test data sets.
• Comments: Decision trees like C4.5
cannot deal well with unbalanced data,
whereas SVM or ANNs should perform
better.
• Semi-supervised Anomaly Detection: training
data only consists of normal data without any
anomalies.
• Comments: One-class SVMs and
autoencoders. Density modeling models
like Gaussian Mixture Models (many
variants exist), Kernel Density Estimation
• Unsupervised Anomaly Detection: no labels.
• Comments: distances or densities are
used to give an estimation what is normal
and what is an outlier.
https://journals.plos.org/plosone/article?id=10.1371/journal.pone.0152173#pone.0152173.ref033
https://towardsdatascience.com/predicting-bankruptcy-f4611afe8d2c
49. Linear regression:
• Relies on the normal, heteroscedasticity and other assumptions,
• does not capture highly non-linear, chaotic patterns.
• Prone to over-fitting.
• Parameters difficult to interpret.
• Very unstable when independent variables are highly correlated.
• Fixes: variable reduction, apply a transformation to your variables,
use constrained regression (e.g. ridge or Lasso regression)
Decision trees:
• Very large decision trees are very unstable and impossible to
interpret, and
• prone to over-fitting.
• Fix: combine multiple small decision trees together instead of using
a large decision tree.
Naive Bayes:
• Used e.g. in fraud and spam detection, and for scoring. Assumes
that variables are independent, if not it will fail miserably. In the
context of fraud or spam detection, variables (sometimes called
rules) are highly correlated.
• Fix: group variables into independent clusters of variables (in each
cluster, variables are highly correlated).
• Apply naive Bayes to the clusters. Or use data reduction techniques.
K-means clustering:
• Used for clustering, tends to produce circular clusters.
• Does not work well with data points that are not a mixture of
Gaussian distributions.
Neural networks:
• Difficult to interpret, unstable, subject to over-fitting.
Maximum Likelihood estimation:
• Requires your data to fit with a prespecified probabilistic
distribution. Not data-driven. In many cases the pre-specified
Gaussian distribution is a terrible fit for your data.
Density estimation in high dimensions:
• Subject to what is referred to as the curse of dimensionality.
Fix: use (non parametric) kernel density estimators with
adaptive bandwidths.
Linear discriminant analysis (LDA):
• Used for supervised clustering. Bad technique because it
assumes that clusters do not overlap, and are well
separated by hyper-planes. In practice, they never do. Use
density estimation techniques instead.
Critique of predictive techniques
50. Critique of predictive techniques
https://www.analyticbridge.datasciencecentral.com/profiles/blogs/the-8-worst-predictive-modeling-techniques
Random Forests
Pros
• One of the most accurate learning algorithms available. For
many data sets, it produces a highly accurate classifier.
• Runs efficiently on large databases.
• Handles thousands of input variables without variable deletion.
• Gives estimates of what variables are important in the
classification.
• Generates an internal unbiased estimate of the generalization
error as the forest building progresses.
• Has an effective method for estimating missing data and
maintains accuracy when a large proportion of the data are
missing.
• Has methods for balancing error in class population unbalanced
data sets.
• Prototypes are computed that give information about the relation
between the variables and the classification.
• The capabilities of the above can be extended to unlabeled data,
leading to unsupervised clustering, data views and outlier
detection.
Random Forests
Cons
• Random forests have been observed to overfit for
some datasets with noisy classification/regression
tasks.
• Unlike decision trees, the classifications made by
random forests are difficult for humans to interpret.
• For data including categorical variables with different
number of levels, random forests are biased in favor
of those attributes with more levels. Therefore, the
variable importance scores from random forest are
not reliable for this type of data. Methods such as
partial permutations were used to solve the problem.
• If the data contain groups of correlated features of
similar relevance for the output, then smaller groups
are favored over larger groups.
51. • The right technique is dependent on the use case and data
• K-NN is the best in many global use cases (especially if high-dimensionality problems of > 400
dimensions, the best k value is <5)
• LoF is preferred for many local use cases
• Don’t use local anomaly detection algorithms, such as LOF, COF, INFLO and LoOP on datasets
containing global anomalies (Note: Global anomaly detection algos perform OK for local
anomalies)
• Nearest-neighbor based algorithms perform better in most cases when compared to clustering
algorithms (but pick the right k value) (pick these if computing time is not an issue)
• clustering-based algorithms have a lower computation time (hence use for real-time or near real-
time use cases)
• uCBLOF algorithm is better among clustering-based algorithms
• ARIMA perfomed better for a long time, till ANNs came
• When not sure, use ANN
Recommendations