Logistic Regression with R - Not for beginners One should have the basic concept in statistics to understand this and the different terms associated with this work sheet. #Logistic Regression #R #Data & Analytics
Regression diagnostics - Checking if linear regression assumptions are violat...Jerome Gomes
Checking if linear regression assumptions ( Linearity, Normality, Independence and Constant variance) are violated with R - Not for beginners One should have the basic concept in statistics to understand this and the different terms associated with this work sheet. #Regression diagnostics #R #Data & Analytics
This presentation educates you about R - Vectors, Vector Creation, Single Element Vector, Multiple Elements Vector, Multiple Elements Vector, Multiple Elements Vector and Accessing Vector Elements.
For more topics stay tuned with Learnbay.
Data Science: Prediction analysis for houses in Ames, Iowa.ASHISH MENKUDALE
For the vastly diversified realty market, with prices of properties increasing exponentially, it becomes essential to study the factors which affect directly or indirectly when a customer decides to buy a house and to predict the market trend. In general, for any purchase, a potential customer makes the decision based on the value for the money.
The problem statement was taken from the website Kaggle. We chose this specific problem because it provided us an opportunity to build a prediction model for real-life problems like the prediction of prices for houses in Ames, Iowa.
Slides presented at the Greater Cleveland R User Meetup group on the statistical concept of mediation using the lavaan package for structural equation modeling.
Bank - Loan Purchase Modeling
This case is about a bank which has a growing customer base. Majority of these customers are liability customers (depositors) with varying size of deposits. The number of customers who are also borrowers (asset customers) is quite small, and the bank is interested in expanding this base rapidly to bring in more loan business and in the process, earn more through the interest on loans. In particular, the management wants to explore ways of converting its liability customers to personal loan customers (while retaining them as depositors). A campaign that the bank ran last year for liability customers showed a healthy conversion rate of over 9% success. This has encouraged the retail marketing department to devise campaigns with better target marketing to increase the success ratio with a minimal budget. The department wants to build a model that will help them identify the potential customers who have a higher probability of purchasing the loan. This will increase the success ratio while at the same time reduce the cost of the campaign. The dataset has data on 5000 customers. The data include customer demographic information (age, income, etc.), the customer's relationship with the bank (mortgage, securities account, etc.), and the customer response to the last personal loan campaign (Personal Loan). Among these 5000 customers, only 480 (= 9.6%) accepted the personal loan that was offered to them in the earlier campaign.
Our job is to build the best model which can classify the right customers who have a higher probability of purchasing the loan. We are expected to do the following:
EDA of the data available. Showcase the results using appropriate graphs
Apply appropriate clustering on the data and interpret the output .
Build appropriate models on both the test and train data (CART & Random Forest). Interpret all the model outputs and do the necessary modifications wherever eligible (such as pruning).
Check the performance of all the models that you have built (test and train). Use all the model performance measures you have learned so far. Share your remarks on which model performs the best.
This is an PPT of C++. This includes the topic of Parameter such as"Reference Parameter, Passing object by reference, constant parameter & Default parameter. "
Dear students get fully solved assignments
Send your semester & Specialization name to our mail id :
“ help.mbaassignments@gmail.com ”
or
Call us at : 08263069601
(Prefer mailing. Call in emergency )
The determination of complex underlying relationships between system parameters from simulated and/or recorded data requires advanced interpolating functions, also known as surrogates. The development of surrogates for such complex relationships often requires the modeling of high dimensional and non-smooth functions using limited information. To this end, the hybrid surrogate modeling paradigm, where different surrogate models are aggregated, offers a robust solution. In this paper, we develop a new high fidelity surro- gate modeling technique that we call the Reliability Based Hybrid Functions (RBHF). The RBHF formulates a reliable Crowding Distance-Based Trust Region (CD-TR), and adap- tively combines the favorable characteristics of different surrogate models. The weight of each contributing surrogate model is determined based on the local reliability measure for that surrogate model in the pertinent trust region. Such an approach is intended to ex- ploit the advantages of each component surrogate. This approach seeks to simultaneously capture the global trend of the function and the local deviations. In this paper, the RBHF integrates four component surrogate models: (i) the Quadratic Response Surface Model (QRSM), (ii) the Radial Basis Functions (RBF), (iii) the Extended Radial Basis Functions (E-RBF), and (iv) the Kriging model. The RBHF is applied to standard test problems. Subsequent evaluations of the Root Mean Squared Error (RMSE) and the Maximum Ab- solute Error (MAE), illustrate the promising potential of this hybrid surrogate modeling approach.
Introduction to use machine learning in python and pascal to do such a thing like train prime numbers when there are algorithms in place to determine prime numbers. See a dataframe, feature extracting and a few plots to re-search for another hot experiment to predict prime numbers.
Intro To C++ - Class 13 - Char, Switch, Break, Continue, Logical OperatorsBlue Elephant Consulting
This presentation is a part of the COP2272C college level course taught at the Florida Polytechnic University located in Lakeland Florida. The purpose of this course is to introduce students to the C++ language and the fundamentals of object orientated programming..
The course is one semester in length and meets for 2 hours twice a week. The Instructor is Dr. Jim Anderson.
Lab 2: Classification and Regression Prediction Models, training and testing ...Yao Yao
https://github.com/yaowser/data_mining_group_project
https://www.kaggle.com/c/zillow-prize-1/data
From the Zillow real estate data set of properties in the southern California area, conduct the following data cleaning, data analysis, predictive analysis, and machine learning algorithms:
Lab 2: Classification and Regression Prediction Models, training and testing splits, optimization of K Nearest Neighbors (KD tree), optimization of Random Forest, optimization of Naive Bayes (Gaussian), advantages and model comparisons, feature importance, Feature ranking with recursive feature elimination, Two dimensional Linear Discriminant Analysis
I am Boris M. I am a Computer Science Assignment Help Expert at programminghomeworkhelp.com. I hold MSc. in Programming, McGill University, Canada. I have been helping students with their homework for the past 7 years. I solve assignments related to Computer Science.
Visit programminghomeworkhelp.com or email support@programminghomeworkhelp.com.You can also call on +1 678 648 4277 for any assistance with Computer Science assignments.
Mini-lab 1: Stochastic Gradient Descent classifier, Optimizing Logistic Regre...Yao Yao
https://github.com/yaowser/data_mining_group_project
https://www.kaggle.com/c/zillow-prize-1/data
From the Zillow real estate data set of properties in the southern California area, conduct the following data cleaning, data analysis, predictive analysis, and machine learning algorithms:
Mini-lab 1: Stochastic Gradient Descent classifier, Optimizing Logistic Regression Model Performance, Optimizing Support Vector Machine Classifier, Accuracy of results and efficiency, Logistic Regression Feature Importance, interpretation of support vectors, Density Graph
In this article you will learn hot to use tensorflow Softmax Classifier estimator to classify MNIST dataset in one script.
This paper introduces also the basic idea of a artificial neural network.
Our fall 12-Week Data Science bootcamp starts on Sept 21st,2015. Apply now to get a spot!
If you are hiring Data Scientists, call us at (1)888-752-7585 or reach info@nycdatascience.com to share your openings and set up interviews with our excellent students.
---------------------------------------------------------------
Come join our meet-up and learn how easily you can use R for advanced Machine learning. In this meet-up, we will demonstrate how to understand and use Xgboost for Kaggle competition. Tong is in Canada and will do remote session with us through google hangout.
---------------------------------------------------------------
Speaker Bio:
Tong is a data scientist in Supstat Inc and also a master students of Data Mining. He has been an active R programmer and developer for 5 years. He is the author of the R package of XGBoost, one of the most popular and contest-winning tools on kaggle.com nowadays.
Pre-requisite(if any): R /Calculus
Preparation: A laptop with R installed. Windows users might need to have RTools installed as well.
Agenda:
Introduction of Xgboost
Real World Application
Model Specification
Parameter Introduction
Advanced Features
Kaggle Winning Solution
Event arrangement:
6:45pm Doors open. Come early to network, grab a beer and settle in.
7:00-9:00pm XgBoost Demo
Reference:
https://github.com/dmlc/xgboost
I am Samuel H. I am a Mechanical Engineering Assignment Expert at matlabassignmentexperts.com. I hold a Ph.D. Matlab, University of Alberta, Canada. I have been helping students with their homework for the past 12 years. I solve assignments related to Mechanical Engineering.
Visit matlabassignmentexperts.com or email info@matlabassignmentexperts.com.
You can also call on +1 678 648 4277 for any assistance with Mechanical Engineering Assignments.
As Europe's leading economic powerhouse and the fourth-largest hashtag#economy globally, Germany stands at the forefront of innovation and industrial might. Renowned for its precision engineering and high-tech sectors, Germany's economic structure is heavily supported by a robust service industry, accounting for approximately 68% of its GDP. This economic clout and strategic geopolitical stance position Germany as a focal point in the global cyber threat landscape.
In the face of escalating global tensions, particularly those emanating from geopolitical disputes with nations like hashtag#Russia and hashtag#China, hashtag#Germany has witnessed a significant uptick in targeted cyber operations. Our analysis indicates a marked increase in hashtag#cyberattack sophistication aimed at critical infrastructure and key industrial sectors. These attacks range from ransomware campaigns to hashtag#AdvancedPersistentThreats (hashtag#APTs), threatening national security and business integrity.
🔑 Key findings include:
🔍 Increased frequency and complexity of cyber threats.
🔍 Escalation of state-sponsored and criminally motivated cyber operations.
🔍 Active dark web exchanges of malicious tools and tactics.
Our comprehensive report delves into these challenges, using a blend of open-source and proprietary data collection techniques. By monitoring activity on critical networks and analyzing attack patterns, our team provides a detailed overview of the threats facing German entities.
This report aims to equip stakeholders across public and private sectors with the knowledge to enhance their defensive strategies, reduce exposure to cyber risks, and reinforce Germany's resilience against cyber threats.
Show drafts
volume_up
Empowering the Data Analytics Ecosystem: A Laser Focus on Value
The data analytics ecosystem thrives when every component functions at its peak, unlocking the true potential of data. Here's a laser focus on key areas for an empowered ecosystem:
1. Democratize Access, Not Data:
Granular Access Controls: Provide users with self-service tools tailored to their specific needs, preventing data overload and misuse.
Data Catalogs: Implement robust data catalogs for easy discovery and understanding of available data sources.
2. Foster Collaboration with Clear Roles:
Data Mesh Architecture: Break down data silos by creating a distributed data ownership model with clear ownership and responsibilities.
Collaborative Workspaces: Utilize interactive platforms where data scientists, analysts, and domain experts can work seamlessly together.
3. Leverage Advanced Analytics Strategically:
AI-powered Automation: Automate repetitive tasks like data cleaning and feature engineering, freeing up data talent for higher-level analysis.
Right-Tool Selection: Strategically choose the most effective advanced analytics techniques (e.g., AI, ML) based on specific business problems.
4. Prioritize Data Quality with Automation:
Automated Data Validation: Implement automated data quality checks to identify and rectify errors at the source, minimizing downstream issues.
Data Lineage Tracking: Track the flow of data throughout the ecosystem, ensuring transparency and facilitating root cause analysis for errors.
5. Cultivate a Data-Driven Mindset:
Metrics-Driven Performance Management: Align KPIs and performance metrics with data-driven insights to ensure actionable decision making.
Data Storytelling Workshops: Equip stakeholders with the skills to translate complex data findings into compelling narratives that drive action.
Benefits of a Precise Ecosystem:
Sharpened Focus: Precise access and clear roles ensure everyone works with the most relevant data, maximizing efficiency.
Actionable Insights: Strategic analytics and automated quality checks lead to more reliable and actionable data insights.
Continuous Improvement: Data-driven performance management fosters a culture of learning and continuous improvement.
Sustainable Growth: Empowered by data, organizations can make informed decisions to drive sustainable growth and innovation.
By focusing on these precise actions, organizations can create an empowered data analytics ecosystem that delivers real value by driving data-driven decisions and maximizing the return on their data investment.
Techniques to optimize the pagerank algorithm usually fall in two categories. One is to try reducing the work per iteration, and the other is to try reducing the number of iterations. These goals are often at odds with one another. Skipping computation on vertices which have already converged has the potential to save iteration time. Skipping in-identical vertices, with the same in-links, helps reduce duplicate computations and thus could help reduce iteration time. Road networks often have chains which can be short-circuited before pagerank computation to improve performance. Final ranks of chain nodes can be easily calculated. This could reduce both the iteration time, and the number of iterations. If a graph has no dangling nodes, pagerank of each strongly connected component can be computed in topological order. This could help reduce the iteration time, no. of iterations, and also enable multi-iteration concurrency in pagerank computation. The combination of all of the above methods is the STICD algorithm. [sticd] For dynamic graphs, unchanged components whose ranks are unaffected can be skipped altogether.
Explore our comprehensive data analysis project presentation on predicting product ad campaign performance. Learn how data-driven insights can optimize your marketing strategies and enhance campaign effectiveness. Perfect for professionals and students looking to understand the power of data analysis in advertising. for more details visit: https://bostoninstituteofanalytics.org/data-science-and-artificial-intelligence/
Opendatabay - Open Data Marketplace.pptxOpendatabay
Opendatabay.com unlocks the power of data for everyone. Open Data Marketplace fosters a collaborative hub for data enthusiasts to explore, share, and contribute to a vast collection of datasets.
First ever open hub for data enthusiasts to collaborate and innovate. A platform to explore, share, and contribute to a vast collection of datasets. Through robust quality control and innovative technologies like blockchain verification, opendatabay ensures the authenticity and reliability of datasets, empowering users to make data-driven decisions with confidence. Leverage cutting-edge AI technologies to enhance the data exploration, analysis, and discovery experience.
From intelligent search and recommendations to automated data productisation and quotation, Opendatabay AI-driven features streamline the data workflow. Finding the data you need shouldn't be a complex. Opendatabay simplifies the data acquisition process with an intuitive interface and robust search tools. Effortlessly explore, discover, and access the data you need, allowing you to focus on extracting valuable insights. Opendatabay breaks new ground with a dedicated, AI-generated, synthetic datasets.
Leverage these privacy-preserving datasets for training and testing AI models without compromising sensitive information. Opendatabay prioritizes transparency by providing detailed metadata, provenance information, and usage guidelines for each dataset, ensuring users have a comprehensive understanding of the data they're working with. By leveraging a powerful combination of distributed ledger technology and rigorous third-party audits Opendatabay ensures the authenticity and reliability of every dataset. Security is at the core of Opendatabay. Marketplace implements stringent security measures, including encryption, access controls, and regular vulnerability assessments, to safeguard your data and protect your privacy.
Machine learning and optimization techniques for electrical drives.pptx
Finding the best K- Knn
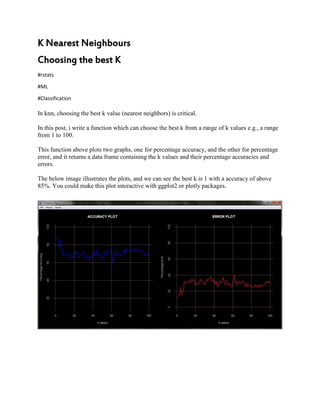
1. K Nearest Neighbours
Choosing the best K
#rstats
#ML
#Classification
In knn, choosing the best k value (nearest neighbors) is critical.
In this post, i write a function which can choose the best k from a range of k values e.g., a range
from 1 to 100.
This function above plots two graphs, one for percentage accuracy, and the other for percentage
error, and it returns a data frame containing the k values and their percentage accuracies and
errors.
The below image illustrates the plots, and we can see the best k is 1 with a accuracy of above
85%. You could make this plot interactive with ggplot2 or plotly packages.
2. The code is shown below:
analyze_k<-function(train, test, train_labels, test_labels, k_range)
{
# train - the training dataset
#test - the test dataset
#train_labels
#test_labels
#k_range - the max number of k values to
# use(should be numeric and greater than 0)
## the classification package
require(class)
prediction_table<-data.frame() # to store predicted classes
prediction_table[1:nrow(test), 1]<-seq(1, nrow(test), 1)
for (i in 1:k_range)
{ ### storing predicted-class columns
prediction_table[, i]<-knn(train, test, train_labels, k=i)
}
# a list of all tables comparing actual and predicted classes
tab_list<-list()
### storing crosstable lists for all values of k
for (i in 1:k_range)
{
tab_list[[i]]<-table(prediction_table[, i], test_labels)
}
l<-length(unique(train_labels))
sq<-seq(1, (l**2), l+1) # indexer sequence
# stores percentage accuracy and errors
d_f<-data.frame()
d_f[1:k_range, 1]<-1:k_range
# storing percentage accuracy and errors
for (i in 1:k_range)
{
d_f[i, 2]<-sum(tab_list[[i]][sq])
}
d_f[, 3]<-(d_f[, 2]/nrow(test))*100
d_f[, 4]<-100 - d_f[, 3]
colnames(d_f)<-c("k values", "index vector", "Percentage_accuracy",
"Percentage_error")
par(bg="black",mfrow=c(1, 2))
plot(d_f[, 1], d_f[, 3], type="l", xlab="k values", col="blue",
ylab="Percentage Accuracy", main="ACCURACY PLOT", col.main="white",
ylim=c(10, 100), lwd=2, col.axis="azure3", col.lab="azure3")
abline(h=max(d_f[, 3]), lty=1)
grid(,lty=1, col="wheat4")
3. plot(d_f[, 1], d_f[, 4], type="l", xlab="k values", col="red",
ylab="Percentage error",
main="ERROR PLOT",
col.main="white",
ylim=c(0, 100), lwd=2, col.axis="azure3", col.lab="azure3")
abline(h=min(d_f[, 4]), lty=1)
grid(,lty=1, col="wheat4")
analyze_k_table<-d_f[-2]
## returns an object of type dataframe containing k values and their
## respective accuracy and errors
return(analyze_k_table)
}