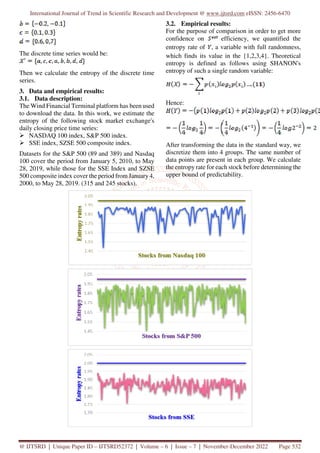
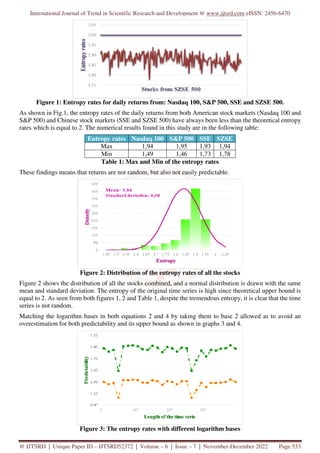
This document summarizes a study that investigated the predictability of stock market returns using entropy rates. The study analyzed daily closing price data from four major stock market indices: Nasdaq 100, S&P 500, SSE and SZSE 500. It calculated the entropy rates of returns and found they were all less than the theoretical maximum, indicating returns are not completely random but not highly predictable either. The study estimated the theoretical maximum predictability of returns could reach 66% by properly accounting for the logarithm base used in entropy calculations.
![International Journal of Trend in Scientific Research and Development (IJTSRD)
Volume 6 Issue 7, November-December 2022 Available Online: www.ijtsrd.com e-ISSN: 2456 – 6470
@ IJTSRD | Unique Paper ID – IJTSRD52372 | Volume – 6 | Issue – 7 | November-December 2022 Page 529
Financial Time Series: How Predictable are they?
Dioubi Fatene
College of Mathematics and Computer Science, Zhejiang Normal University, Jinhua, China
ABSTRACT
The goal of stock market forecasts is to predict how the stock value
of a financial exchange will change in the future. Interest rates,
politics, economic growth and many other factors affect the stock
prediction. More accurate predictions lead investors to make more
profit. Making decisions depends on the ability of foreseeing the
stock market changes, consequently, digging out the role of
randomness in financial time series behaviour and quantifying how
predictable are financial time series is of great interest. This paper
explores the limits of predictability on return’s dynamics using
different stock markets. To determine the theoretical maximum
prediction accuracy for the returns, we solve a limited case of
the Fano inequality while taking in consideration some previous
studies suggestion to avoid an incorrect and overestimated results of
81%. The findings of this study showed that returns predictability
could reach 66% by measuring the entropy of four major American
and Chinese indices namely Nasdaq 100, S&P 500, SSE and SZSE
500.
KEYWORDS: stock market, stock prediction, financial time series,
predictability, returns
How to cite this paper: Dioubi Fatene
"Financial Time Series: How Predictable
are they?" Published
in International
Journal of Trend in
Scientific Research
and Development
(ijtsrd), ISSN:
2456-6470,
Volume-6 | Issue-7,
December 2022, pp.529-536, URL:
www.ijtsrd.com/papers/ijtsrd52372.pdf
Copyright © 2022 by author (s) and
International Journal of Trend in
Scientific Research and Development
Journal. This is an
Open Access article
distributed under the
terms of the Creative Commons
Attribution License (CC BY 4.0)
(http://creativecommons.org/licenses/by/4.0)
1. INTRODUCTION
There is considerable interest in stock return
predictability. The literature, which has taken two
strands, reflects the subject's appeal in terms of both
practical and theoretical implications [1]. Some of
these papers deals with the theoretical issues
surrounding testing for stock market returns
predictability [2, 3, 4, 5]. While other researches
focus on the importance of stock return predictability
to the economy [6, 7, 8]. There is a growing
consensus from in-sample studies that there is a
strong predictable component to stock returns [9].
Although there is significant evidence of in-sample
predictability, several widely used predictors do not
consistently produce out-of-sample predictability [7].
Significant improvement of the out-of-sample
predictability has been demonstrated and supported
by imposing theoretically grounded limits on
forecasting regressions [10]. Additionally, a
straightforward forecast using the mean of all
economic factors can result in considerable out-of-
sample gains [8].
Because there are so many factors that affect stock
expectations, such as political events, economic
conditions, and expectations among traders,
predicting how the market will move is one of the
most difficult tasks. Those variables and many others
make the stock unstable, volatile and hence,
extremely difficult to precisely anticipate [11]. The
majority of researchers fundamental stimulus in the
field of market prediction, is that it provides lucrative
profit opportunities. Therefore, it should not come as
a surprise that the predictability of stock returns is a
topic on which a lot of research has been done, where
many different economic factors being proposed as
potential predictors. [12, 13, 14, 15]. Furthermore, a
lot of studies that proposed and used different
methods (such as: deep learning, neural networks…)
and models to get the better possible predictions of
the stock market returns [16, 17, 18, 19].
Due to the availabilityof sophisticated algorithms and
crucial stock market information, returns forecast is
becoming more accurate (on web: BBC, Bloomberg,
and Yahoo Finance…). However, it's unclear how
well these algorithms work in comparison to the ideal
scenario. Finding out to what degree are they
predictable would be interesting to know the limit of
the best predictions that can be done. Accordingly,
this paper investigates how predictable they are by
IJTSRD52372](https://image.slidesharecdn.com/62financialtimeserieshowpredictablearethey-230110102731-ac7ff804/85/Financial-Time-Series-How-Predictable-are-they-1-320.jpg)
![International Journal of Trend in Scientific Research and Development (IJTSRD)
Volume 6 Issue 7, November-December 2022 Available Online: www.ijtsrd.com e-ISSN: 2456 – 6470
@ IJTSRD | Unique Paper ID – IJTSRD52372 | Volume – 6 | Issue – 7 | November-December 2022 Page 529
Financial Time Series: How Predictable are they?
Dioubi Fatene
College of Mathematics and Computer Science, Zhejiang Normal University, Jinhua, China
ABSTRACT
The goal of stock market forecasts is to predict how the stock value
of a financial exchange will change in the future. Interest rates,
politics, economic growth and many other factors affect the stock
prediction. More accurate predictions lead investors to make more
profit. Making decisions depends on the ability of foreseeing the
stock market changes, consequently, digging out the role of
randomness in financial time series behaviour and quantifying how
predictable are financial time series is of great interest. This paper
explores the limits of predictability on return’s dynamics using
different stock markets. To determine the theoretical maximum
prediction accuracy for the returns, we solve a limited case of
the Fano inequality while taking in consideration some previous
studies suggestion to avoid an incorrect and overestimated results of
81%. The findings of this study showed that returns predictability
could reach 66% by measuring the entropy of four major American
and Chinese indices namely Nasdaq 100, S&P 500, SSE and SZSE
500.
KEYWORDS: stock market, stock prediction, financial time series,
predictability, returns
How to cite this paper: Dioubi Fatene
"Financial Time Series: How Predictable
are they?" Published
in International
Journal of Trend in
Scientific Research
and Development
(ijtsrd), ISSN:
2456-6470,
Volume-6 | Issue-7,
December 2022, pp.529-536, URL:
www.ijtsrd.com/papers/ijtsrd52372.pdf
Copyright © 2022 by author (s) and
International Journal of Trend in
Scientific Research and Development
Journal. This is an
Open Access article
distributed under the
terms of the Creative Commons
Attribution License (CC BY 4.0)
(http://creativecommons.org/licenses/by/4.0)
1. INTRODUCTION
There is considerable interest in stock return
predictability. The literature, which has taken two
strands, reflects the subject's appeal in terms of both
practical and theoretical implications [1]. Some of
these papers deals with the theoretical issues
surrounding testing for stock market returns
predictability [2, 3, 4, 5]. While other researches
focus on the importance of stock return predictability
to the economy [6, 7, 8]. There is a growing
consensus from in-sample studies that there is a
strong predictable component to stock returns [9].
Although there is significant evidence of in-sample
predictability, several widely used predictors do not
consistently produce out-of-sample predictability [7].
Significant improvement of the out-of-sample
predictability has been demonstrated and supported
by imposing theoretically grounded limits on
forecasting regressions [10]. Additionally, a
straightforward forecast using the mean of all
economic factors can result in considerable out-of-
sample gains [8].
Because there are so many factors that affect stock
expectations, such as political events, economic
conditions, and expectations among traders,
predicting how the market will move is one of the
most difficult tasks. Those variables and many others
make the stock unstable, volatile and hence,
extremely difficult to precisely anticipate [11]. The
majority of researchers fundamental stimulus in the
field of market prediction, is that it provides lucrative
profit opportunities. Therefore, it should not come as
a surprise that the predictability of stock returns is a
topic on which a lot of research has been done, where
many different economic factors being proposed as
potential predictors. [12, 13, 14, 15]. Furthermore, a
lot of studies that proposed and used different
methods (such as: deep learning, neural networks…)
and models to get the better possible predictions of
the stock market returns [16, 17, 18, 19].
Due to the availabilityof sophisticated algorithms and
crucial stock market information, returns forecast is
becoming more accurate (on web: BBC, Bloomberg,
and Yahoo Finance…). However, it's unclear how
well these algorithms work in comparison to the ideal
scenario. Finding out to what degree are they
predictable would be interesting to know the limit of
the best predictions that can be done. Accordingly,
this paper investigates how predictable they are by
IJTSRD52372](https://image.slidesharecdn.com/62financialtimeserieshowpredictablearethey-230110102731-ac7ff804/75/Financial-Time-Series-How-Predictable-are-they-1-2048.jpg)
![International Journal of Trend in Scientific Research and Development @ www.ijtsrd.com eISSN: 2456-6470
@ IJTSRD | Unique Paper ID – IJTSRD52372 | Volume – 6 | Issue – 7 | November-December 2022 Page 530
adopting [20] analytical framework that has been
extensively used different type of data and showed to
be efficient [21, 22, 23, 24, 25, 26, 27, 28]. Unlike the
other recent survey articles that emphasize analysing
the prediction model or investigating the sources of
the predictability [29, 30, 31], our aim is to explore
how predictable are financial time series. Many
reasons motivate this research such as the good
empirical demonstrating that stock market returns are
predictable based on previous returns [9].
Only monthly data serve as the basis for the study by
[1]. Due to the data-frequency argument that was
previously discussed, the question that emerges is
whether their outcomes regarding predictability will
endure when applied to a daily data collection, which
contains more information than monthly data. In
order to determine whether or not the results of a
particular hypothesis test are reliable, it became then
necessary to take into account using at least the data
frequencies that are most frequently used. In our case,
the returns are generally taken on daily frequencies
[32, 33, 34]. According to some recent studies, daily
price movements are statistically significantly less
predictable than high-frequency price changes. [21].
To avoid predictability overestimation, we use daily
data from four major American and Chinese indices:
Nasdaq 100, S&P 500, SSE and SZSE 500.
The reminder for the paper is structured as follows:
The methodology is presented in Section 2. The
findings are described in Section 3, along with the
study's conclusions and next research. Finlay, this
paper is concluded with Section 4.
2. Methodology
Entropy is a concept that has been usually used to
measure the predictability. Low entropy denotes
strong certainty and information availability, while
high entropy indicates low predictability. The
predictability of time series can be calculated by
using entropy rates, which quantify the level of
uncertainty in random variables. We expanded the
analytical framework suggested by SONG. Et al [20],
which is closely followed in examining the
predictability of other types of time series, in order to
determine the role of randomness in time series
behaviour and the extent to which financial time
series changes are predictable. In order to obtain
accurate estimates of our time series predictability,
this study will take into consideration some
modifications due to some imprecise descriptions in
their publication, which according to [35] findings led
to some overestimations.
SONG et al. [20], used the real entropy in their work,
which depends on the order in which nodes were
visited as well as visitation frequency. Considering a
historical sequence , to assess the
sequence's information capacity.:
where identifies the probability that a
subsequence will be found in the trajectory .
Methods for estimating entropy can be divided into
two categories:
Maximum likelihood estimators:
These estimators cannot be used to analyze mid- and
long-term relationships, which are crucial in
economics and finance. As a result, these techniques
are waning in popularity, hence we are not using them
in this research.
Estimators based on data compression algorithm:
Such as the estimator based on the Lempel-Zif
compression (LZ) and which shows in manyprevious
studies its usefulness and precision even for a limited
sample size.
Since the direct calculation of the actual entropytakes
too long, it is impractical for real-time series. One of
the estimators based on the LZ estimators that has
been demonstrated to have superior statistical
qualities in comparison to earlier estimators based on
the same technique is defined as:
Where:
= the length of time series
= the smallest length at which the sequence
commencing at location and having length does
not appear to be a continuous series from time 1 to
.
Example:
For time series: ,
When :
To obtain the upper limits for human mobility pattern
, Song et al have solved the following Fano’s
inequality:
And is given by:](https://image.slidesharecdn.com/62financialtimeserieshowpredictablearethey-230110102731-ac7ff804/85/Financial-Time-Series-How-Predictable-are-they-2-320.jpg)
![International Journal of Trend in Scientific Research and Development @ www.ijtsrd.com eISSN: 2456-6470
@ IJTSRD | Unique Paper ID – IJTSRD52372 | Volume – 6 | Issue – 7 | November-December 2022 Page 531
Where:
And indicates how many different places were
seen in T
According to Xu, P et. al [35], some explanation in
[20] were ambiguous for the following reasons:
Eq. 2 doesn't explicitly provide the logarithm
base.
Determining is a puzzle if each subsequence
beginning at position is a continuous
subsequence of .
To clarify the descriptions and avoid the
misunderstanding, which lead to an overestimation of
the predictability, it has been suggested that:
In order to prevent the error brought on by
unmatched bases, the two logarithm bases in
equations 1 and 2 should be identical. To obtain
in bits, taking the logarithm bases down to
base 2 has been suggested [36], hence we
estimate the entropy by:
The unified explanation of is determine by:
Where:
= length of the longest continuous sub-sequence
of the sequences beginning at
position .
Every sub-sequence beginning at position
appearing as a sub-sequence of in
this scenario:
And thus:
This estimator demonstrated a correct and coherent
comprehension of . It has proved by many studies
to perform better than any other estimator previously
proposed. Indeed, it has been applied in our study.
In their research, SONG et al. [20] applied three
entropy metrics to each person's movement pattern:
Random entropy: demonstrates how predictable a
user's location is if each place is visited with an
equal probability.
The temporal uncorrelated entropy: defining the
variety of visitation patterns.
The actual entropy: depends on the order in which
the nodes were visited and the amount of time
spent at each location, in addition to the
frequency of visitation, thereby capturing the
whole spatiotemporal order present in a person's
mobility pattern.
The results of calculating the upper bound of
predictability for both of the random entropy and the
temporal uncorrelated entropies indicated that the
temporal order of the visiting pattern contains a major
portion of predictability and therefore they are
inefficient as a tool for prediction. Therefore, we are
estimating in our study the actual entropy utilizing a
Lempel Ziv estimator with stronger statistical features
to estimate the entropy rate [37].
Stocks with incomplete data are excluded, the log
ratios between successive daily closing prices are the
data points, which are transformed using the
conventional method for analysing price movements:
And: and are the prices at the instants and
respectively.
For the benefit of the estimators and to remove any
extraneous factors from the model that might have an
impact on the outcomes and conclusions drawn from
the data. Those data points have been discretized into
4 different states. Previous studies have discretized
their data to 4, 8 or even 16 states, in order to keep
things simple and make it simpler to interpret the
discrete states economically, we use 4 since it is
mainly irrelevant to the outcomes. The discretization
procedure is really straightforward. We have n
observations of log returns which are real numbers.
We sort them in ascending order and divide into 4
equal parts, each with observations (i.e.
quartiles). So that first quartile is the
observations with lowest values:
Where is the lowest observation and is the 25th
percentile observation when ordered). Hence, we end
up with 4 buckets and we assign values to each them.
As we use discrete mathematics, it doesn't really
matter what value we assign to each bucket/quantile,
can be or . For the simple example,
starting with time series :
We assign and got:](https://image.slidesharecdn.com/62financialtimeserieshowpredictablearethey-230110102731-ac7ff804/85/Financial-Time-Series-How-Predictable-are-they-3-320.jpg)
![International Journal of Trend in Scientific Research and Development @ www.ijtsrd.com eISSN: 2456-6470
@ IJTSRD | Unique Paper ID – IJTSRD52372 | Volume – 6 | Issue – 7 | November-December 2022 Page 535
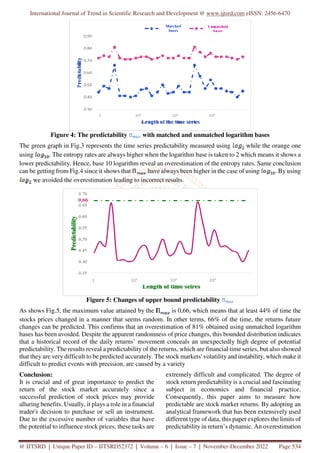
of this limit has been avoided, and the findings of this
study present a 66% potential predictabilityin returns
changes instead of 81% which is higher than expected
because of the difficulty of the return’s predictions.
Further investigations ought to be performed to affirm
whether this outcome is hearty and shows up on other
stock market also.
References:
[1] Narayan, P. K., & Bannigidadmath, D. (2015).
Are Indian stock returns predictable? Journal of
Banking & Finance, 58, 506-531.
[2] Lanne, M. (2002). Testing the predictability of
stock returns. Review of Economics and
Statistics, 84(3), 407-415.
[3] Lewellen, J. (2004). Predicting returns with
financial ratios. Journal of Financial
Economics, 74(2), 209-235.
[4] Campbell, J. Y., & Yogo, M. (2006). Efficient
tests of stock return predictability. Journal of
financial economics, 81(1), 27-60.
[5] Westerlund, J., & Narayan, P. K. (2012). Does
the choice of estimator matter when forecasting
returns?. Journal of Banking & Finance, 36(9),
2632-2640.
[6] Lamont, O. (1998). Earnings and expected
returns. The journal of Finance, 53(5), 1563-
1587.
[7] Welch, I., & Goyal, A. (2008). A
comprehensive look at the empirical
performance of equity premium prediction. The
Review of Financial Studies, 21(4), 1455-1508.
[8] Rapach, D. E., Strauss, J. K., & Zhou, G.
(2010). Out-of-sample equity premium
prediction: Combination forecasts and links to
the real economy. The Review of Financial
Studies, 23(2), 821-862.
[9] Campbell, J. Y. (2000). Asset pricing at the
millennium. The Journal of Finance, 55(4),
1515-1567.
[10] Campbell, J. Y., & Thompson, S. B. (2008).
Predicting excess stock returns out of sample:
Can anything beat the historical average? The
Review of Financial Studies, 21(4), 1509-1531.
[11] Boyacioglu, M. A., & Avci, D. (2010). An
adaptive network-based fuzzyinference system
(ANFIS) for the prediction of stock market
return: the case of the Istanbul stock exchange.
Expert Systems with Applications, 37(12),
7908-7912.
[12] Campbell, J. Y., & Vuolteenaho, T. (2004).
Inflation illusion and stock prices. American
Economic Review, 94(2), 19-23.
[13] Guo, H. (2006). On the out‐of‐sample
predictability of stock market returns. The
Journal of Business, 79(2), 645-670.
[14] Fama, E. F., & French, K. R. (1988). Dividend
yields and expected stock returns. Journal of
financial economics, 22(1), 3-25.
[15] Gupta, R., Hammoudeh, S., Modise, M. P., &
Nguyen, D. K. (2014). Can economic
uncertainty, financial stress and consumer
sentiments predict US equitypremium? Journal
of International Financial Markets, Institutions
and Money, 33, 367-378.
[16] Song, Y., & Akagi, F. (2016). Application of
artificial neural network for the prediction of
stock market returns: the case of the Japanese
stock marketAuthor-Name: qiu, Mingyue.
Chaos, Solitons & Fractals, 85(C), 1-7.
[17] De Faria, E. L., Albuquerque, M. P., Gonzalez,
J. L., Cavalcante, J. T. P., & Albuquerque, M.
P. (2009). Predicting the Brazilian stock market
through neural networks and adaptive
exponential smoothing methods. Expert
Systems with Applications, 36(10), 12506-
12509.
[18] Zhong, X., & Enke, D. (2019). Predicting the
daily return direction of the stock market using
hybrid machine learning algorithms. Financial
Innovation, 5(1), 1-20.
[19] Rossi, A. G. (2018). Predicting stock market
returns with machine learning. Georgetown
University.
[20] Song, C., Qu, Z., Blumm, N., & Barabási, A. L.
(2010). Limits of predictability in human
mobility. Science, 327(5968), 1018-1021.
[21] Fiedor, P. (2014, March). Frequency effects on
predictability of stock returns. In 2014 IEEE
Conference on Computational Intelligence for
Financial Engineering & Economics (CIFEr)
(pp. 247-254). IEEE.
[22] Zhang, L., Liu, Y., Wu, Y., & Xiao, J. (2014).
Analysis of the origin of predictability in
human communications. Physica A: Statistical
Mechanics and its Applications, 393, 513-518.
[23] Takaguchi, T., Nakamura, M., Sato, N., Yano,
K., & Masuda, N. (2011). Predictability of
conversation partners. Physical Review X, 1(1),
011008.](https://image.slidesharecdn.com/62financialtimeserieshowpredictablearethey-230110102731-ac7ff804/85/Financial-Time-Series-How-Predictable-are-they-7-320.jpg)
![International Journal of Trend in Scientific Research and Development @ www.ijtsrd.com eISSN: 2456-6470
@ IJTSRD | Unique Paper ID – IJTSRD52372 | Volume – 6 | Issue – 7 | November-December 2022 Page 536
[24] Xu, T., Xu, X., Hu, Y., & Li, X. (2017). An
entropy-based approach for evaluating travel
time predictability based on vehicle trajectory
data. Entropy, 19(4), 165.
[25] Chen, W., Gao, Q., & Xiong, H. (2016).
Temporal predictability of online behavior in
foursquare. Entropy, 18(8), 296.
[26] Dahlem, D., Maniloff, D., & Ratti, C. (2015).
Predictability bounds of electronic health
records. Scientific reports, 5(1), 1-9.
[27] Krumme, C., Llorente, A., Cebrian, M.,
Pentland, A., & Moro, E. (2013). The
predictability of consumer visitation patterns.
Scientific reports, 3(1), 1-5.
[28] Cao, Y., Gao, J., & Zhou, T. (2023).
Orderliness of campus lifestyle predicts
academic performance: a case study in Chinese
university. In Digital phenotyping and mobile
sensing (pp. 137-149). Springer, Cham.
[29] Gencay, R. (1998). The predictability of
security returns with simple technical trading
rules. Journal of Empirical Finance, 5(4), 347-
359.
[30] Debray, T. P., Damen, J. A., Snell, K. I., Ensor,
J., Hooft, L., Reitsma, J. B., . . . & Moons, K.
G. (2017). A guide to systematic review and
meta-analysis of prediction model performance.
bmj, 356.
[31] Gil, J. D., Ruiz-Aguirre, A., Roca, L.,
Zaragoza, G., & Berenguel, M. (2018).
Prediction models to analyse the performance
of a commercial-scale membrane distillation
unit for desalting brines from RO plants.
Desalination, 445, 15-28.
[32] Harvey, C. R. (1995). Predictable risk and
returns in emerging markets. The review of
financial studies, 8(3), 773-816.
[33] Dicle, M. F., Beyhan, A., & Yao, L. J. (2010).
Market efficiency and international
diversification: Evidence from India.
International Review of Economics & Finance,
19(2), 313-339.
[34] Gupta, R., & Modise, M. P. (2012). South
African stock return predictability in the
context data mining: The role of financial
variables and international stock returns.
Economic Modelling, 29(3), 908-916
[35] Xu, P., Yin, L., Yue, Z., & Zhou, T. (2019). On
predictability of time series. Physica A:
Statistical Mechanics and its Applications, 523,
345-351.
[36] Grassberger, P. (1989). Estimating the
information content of symbol sequences and
efficient codes. IEEE Transactions on
Information Theory, 35(3), 669-675.
[37] Navet, N., & Chen, S. H. (2008). On
predictability and profitability: Would GP
induced trading rules be sensitive to the
observed entropy of time series? In Natural
Computing in Computational Finance (pp. 197-
210). Springer, Berlin, Heidelberg.](https://image.slidesharecdn.com/62financialtimeserieshowpredictablearethey-230110102731-ac7ff804/85/Financial-Time-Series-How-Predictable-are-they-8-320.jpg)