Download to read offline

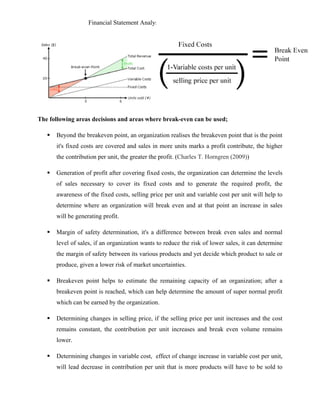
![Financial Statement Analysis - Julius Noble Ssekazinga
REFERENCES:
Financial management by pandey,I.M. (2009) Vikes Mumbai
Financial Management by C. Paramasivan and T. Subramanian
Financial and management Accounting by Pauline Weetman 2006
Pauline Weetman, (2006), ‘Management Accounting Second Edition’ Chapter 11: Page
271,published 2010. © Pearson Education Limited 2006
Marty Schmidt, (2004), ‘Business Encyclopedia’ [Online]
Available <https://www.business-case-analysis.com/internal-rate-of-return.html#redefine>
retrieved on 27/10/2014
Charles T. Horngren, (2009:53), [online] Available
<http://digilib.itb.ac.id/files/disk1/454/jbptitbpp-gdl-sigitadria-22679-3-2010ta-2.pdf>retrieved
on 19/10/2014
P. K. Sikda Faculty EIRC of ICWAI - The Management Accountant - Volume 42 - Page 77
Jain PK, Kumar M (2000) Comparative financial management Practices of India and South-East
Asia
AWOMEWE & Oludele Olawale OGUNDELE. (2008), ‘The importance of the payback
method in capital budgeting decision’ [Online]
Available
<http://www.bth.se/fou/cuppsats.nsf/all/96459e3b71bce192c1257507003ae68f/$file/The%20Imp
ortance%20of%20the%20Payback%20Method%20in%20Capital%20Budgeting%20Decision.pd
f> retrieved on 25/10/2014
Prof. R. Madumathi, (2006), ‘Management Science II’ [Online] Available
<http://nptel.ac.in/courses/IIT-MADRAS/Management_Science_II/index.php>retrieved on
25/10/2014](https://image.slidesharecdn.com/financialmoduleassigmentmba-it-0218-t-2014-ssekazinga-150513144454-lva1-app6892/85/Financial-Statement-Analysis-20-320.jpg)
![Financial Statement Analysis - Julius Noble Ssekazinga
Steven. Bragg, (2014), Accounting Tools’ [Online]
Available <http://www.accountingtools.com/questions-and-answers/cost-concepts-in-decision-
making.html> retrieved on 22/10/2014
http://www.investopedia.com/articles/stocks/06/opleverage.asp
Allen Mursau (Nov 27, 2013) Accounting for Cost-Volume-Profit Analysis: Understanding &
calculating Operating Leverage Cost
Available <http://www.youtube.com/watch?v=3dLHHQ6qcV8 > retrieved on 30/10/2014
http://www.readyratios.com/reference/analysis/break_even_point.html
Harold Averkamp, (2003), ‘Accounting Coach’ [Online] Available
<http://www.accountingcoach.com/blog/vertical-analysis-horizontal-analysis>
retrieved on 22/10/2014
Steven. Bragg, (2014), Accounting Tools’ [Online]
Available <http://www.accountingtools.com/financial-statement-analysis> retrieved on
22/10/2014
Chris gallant, 2013 [Online]
Available <http://www.investopedia.com/ask/answers/06/npvdisadvantages.asp> retrieved on
29/10/2014](https://image.slidesharecdn.com/financialmoduleassigmentmba-it-0218-t-2014-ssekazinga-150513144454-lva1-app6892/85/Financial-Statement-Analysis-21-320.jpg)

The document outlines a financial statement analysis assignment by Julius Noble Ssekazinga at Coventry University, detailing intended learning outcomes and various coursework questions related to cost classification, financial analysis techniques, and investment appraisal methods. It emphasizes the use of analytical tools to evaluate company performance, analyze cost behaviors, and assess divisional performance. Additionally, the assignment explores critical concepts like marginal and absorption costing, operating leverage, and break-even analysis in making informed business decisions.


