
Recommended
Recommended
More Related Content
Similar to Financial Risk, Capital Adequacy and Liquidity Performance of Deposit Money Banks in Nigeria
Similar to Financial Risk, Capital Adequacy and Liquidity Performance of Deposit Money Banks in Nigeria (20)
More from ijtsrd
More from ijtsrd (20)
Recently uploaded
Recently uploaded (20)
Financial Risk, Capital Adequacy and Liquidity Performance of Deposit Money Banks in Nigeria
- 1. International Journal of Trend in Scientific Research and Development (IJTSRD) Volume 8 Issue 1, January-February 2024 Available Online: www.ijtsrd.com e-ISSN: 2456 – 6470 @ IJTSRD | Unique Paper ID – IJTSRD61356 | Volume – 8 | Issue – 1 | Jan-Feb 2024 Page 175 Financial Risk, Capital Adequacy and Liquidity Performance of Deposit Money Banks in Nigeria Odinaka Frank Igbojindu, Gloria Ogochukwu Okafor, Chinedu Jonathan Ndubuisi Department of Accountancy, Nnamdi Azikiwe University, Awka, Nigeria ABSTRACT The objective of this study was to examine the effect of financial risk on liquidity performance of Deposit Money Banks (DMBs) in Nigeria, with capital adequacy as a moderator. The study specifically examined the mediating role of capital adequacy on the effect of operational risk, market risk and credit risk on liquidity performance. The study adopted the ex-post facto research design; as the goal was not to manipulate any variable but rather to establish effect and mediation. The population comprised listed Deposit Money Banks and the sample restricted to a purposive sample of ten (10) banks whose annual reports were accessible for the period of 13 years from 2010-2022 which was the time scope of this study. The data were analysed using structural equation model. The study found that capital adequacy does not significantly mediate the effect of operational, market and credit risks on liquidity performance. Based on these findings, the study recommended that: Banks need to create a capital adequacy mechanism necessary for hedging against operating risks inherent in the financial market; Banks need to develop a capital adequacy framework to guide them to optimally disclose their market risks, enhance the quality of their disclosure practices, improve the quality of their financial reports and more efficiently manage their liquidity; The Nigerian Central Bank need to develop a statutory requirement that will demand a certain level of capital adequacy by the banks before granting a certain level of credit. KEYWORDS: Financial Risk, Capital Adequacy and Liquidity Performance How to cite this paper: Odinaka Frank Igbojindu | Gloria Ogochukwu Okafor | Chinedu Jonathan Ndubuisi "Financial Risk, Capital Adequacy and Liquidity Performance of Deposit Money Banks in Nigeria" Published in International Journal of Trend in Scientific Research and Development (ijtsrd), ISSN: 2456-6470, Volume-8 | Issue-1, February 2024, pp.175-186, URL: www.ijtsrd.com/papers/ijtsrd61356.pdf Copyright © 2024 by author (s) and International Journal of Trend in Scientific Research and Development Journal. This is an Open Access article distributed under the terms of the Creative Commons Attribution License (CC BY 4.0) (http://creativecommons.org/licenses/by/4.0) 1. INTRODUCTION More than a decade after the 2008 financial crisis, Nigeria’s banking sector continues to grapple with macroeconomic pressures including declining real gross domestic product (GDP) growth rates, rising inflation, unemployment rates, and fluctuating naira- to-dollar exchange rates. These pressures have exposed the banks to financial risk by creating high level of uncertainties in their investment portfolio. At the same time, policy measures to stabilize the financial system and increase lending to stimulate the production of goods and services have increased pressures on banks. The banks’ fees and commission income are being stifled also by the CBN’s downward fee revisions of electronic banking charges which were designed to ensure the protection of consumer rights (Yousef, Taha and Muhmad, 2022). The issue of liquidity for organizations is very vital to the existence of any organization especially the deposit money banks. However, illiquidity of banks can lead to loss of businesses thereby reducing the potential of earnings and profitability. This is because high liquidity position of banks helps them to meet up with the obligations of which some lead to funding of loans and advances that could aid the bank to earn income in form of interests and loans. Profitability is also being dampened by the Cash Reserve Requirement (CRR), which, at 27.5 percent, is among the highest in the world. The CRR requires banks to keep an increasing amount of local-currency deposits with the central bank, and restricts their ability to lend as these reserves are only available for intervention funds (Ali and Dhiman, 2019). IJTSRD61356
- 2. International Journal of Trend in Scientific Research and Development @ www.ijtsrd.com eISSN: 2456-6470 @ IJTSRD | Unique Paper ID – IJTSRD61356 | Volume – 8 | Issue – 1 | Jan-Feb 2024 Page 176 In the light of this, prior researchers have focused on the effect financial risk will have on performance or profitability, thereby neglecting the core determinant of solvency which is cash generated from daily operations of the banks. Financial risk has been empirically measured using operational risk, market risk and credit risk. This present study also adopts these three measures of financial risk. From the empirical review, it was discovered that these three measures of financial risk have severally been used to ascertain their effect on financial performance usually measured by ROA, ROE and ROCE. For operational risk, the studies include: Ishmail, Memba and Muriithi (2023); Kaddumi and Al-kilani (2022); Falih, Kasim and Yaseen (2022). For market risk, the studies include: Orjinata and Ighosewe (2022); Agubata and Odubuasi (2021); Karugu, Mutari and Muathe (2020). For credit risk, the studies include: Yousef, Taha and Muhmad (2022); Oke and Tiamiyu (2022); Waitherero and Wangari (2022). This study introduced liquidity performance as the dependent variable and capital adequacy as the mediator variable. These to the best of the researchers’ knowledge, are yet to be fully harnessed in contemporary studies on financial risk. This also has not been seen in prior studies. The closest attempts were the works of Walela, Omagwa and Muathe (2022) that used firm size as a moderator while Aliyu, Badara and Nurudeen (2022) used board equity ownership as a moderator too. Capital adequacy however, measures a bank’s financial strength expressed by the ratio of its capital (net worth and subordinated debt) to it weighted credit exposure in terms of loans (Mendoza and Rivera, 2017). Some scholars defined capital adequacy as capital risk-weighted asset ratio and it is used to assure depositors’ confidence in the banking system and by extension the financial system stability. Without any prejudice banks need to hold substantial amount of owner’s capital in relation to the amount of loan involve as well as the riskiness. 1.1. Objectives of the Study The broad objective of the study is to examine the mediating effect of capital adequacy on the relationship between financial risk and liquidity performance of deposit money banks in Nigeria. The specific objectives are: 1. Ascertain the mediating effect of capital adequacy on the relationship between operational risk and liquidity performance of Deposit Money Banks in Nigeria. 2. Investigate the mediating effect of capital adequacy on the relationship between market risk and liquidity performance of Deposit Money Banks in Nigeria. 3. Determine the mediating effect of capital adequacy on the relationship between credit risk and liquidity performance of Deposit Money Banks in Nigeria. 2. LITERATURE REVIEW Financial risk includes credit risk, liquidity risk, market risk and operational risk, which, together, contribute to the volatility of financial performance (Aliu and Sahiti, 2016). Generally, based on the risk and performance literature, performance and financial risk are two components that have a two-way interaction. Each component is important to the other to sustain the operation of the business. According to Hawley’s (1893) risk theory of profit as cited in Bhattarai, (2015), profit is considered to be the return of risk as an additional factor of production and has a positive relationship with the risk. This means that the higher the factor (i.e., risk), the higher the profit and the higher the distributable return for the risk. This idea is supported by Aaker and Jacobson (1987), as cited in Bhattarai, (2015) argued that risk has a positive correlation with return on investment. These ideas become true when the banks manage risk by relocating funds in high-risk investments or loans with high return. Alternatively, the theory becomes fantasy when the banks face high risk and management fails to manage its occurrence and return. Conversely, Bowman (1979), as cited in Bhattarai, (2015) in his paradox theory of risk and return, propounded that risk and return have a negative relation because managers can increase returns and reduce risk at the same time. In reality, this idea is true. When a bank fails to manage risk, the risk is high and the profit is low, and when the bank succeeds in managing risk, the risk is low and the profit is high. Similarly, Aliu and Sahiti, (2016), in his study regarding firm performance under financial constraints and risks: recent evidence from microfinance clients in Tanzania has shown a strong negative connection between financial constraints, risk and profits. This idea is similar to the outlook of Qin and Pastory (2012). There has been a significant amount of empirical research in recent years on the impact of financial risk management on financial performance. Subsequently, a multitude of these studies demonstrates the significant role played by the country's financial system as the cornerstone of a stable and productive economy. The banking moderator main player in the role of financial intermediation in developing countries is at the heart of the financial system as per (Sathyamoorthi, Mapharing, Mphoeng, and Dzimiri,
- 3. International Journal of Trend in Scientific Research and Development @ www.ijtsrd.com eISSN: 2456-6470 @ IJTSRD | Unique Paper ID – IJTSRD61356 | Volume – 8 | Issue – 1 | Jan-Feb 2024 Page 177 2020). Financial risk can be triggered by changes in interest rates, currency exchange rates, stock price fluctuations, default risk and liquidity differences that affect cash flows and competitive position in commodity markets. The best approach to understanding financial risk and lessen its impact is to analyse the financial performance of banks (Bhattarai, 2015). When banks issue credit there is uncertainty which surrounds the outcome on returns. Banks take risks and are rewarded well when borrowers do not default. Empirical evidence from previous studies show mixed results on the nexus between financial risk and financial performance of banks. Some studies revealed that those banks that tend to have more losses harbour a greater risk appetite (Khemraj and Pasha, 2013). In order for banks to monitor risk appetite and be in charge of financial risk, policies that ensure loans are accorded to those with the ability to pay back what they owe and minimise loan delinquency are essential (Karuri, 2014). Arguably, effective risk management would mitigate the high incidence of nonperforming loans which diminish profits (Aliu and Sahiti, 2016). Walela, Omagwa and Muathe (2022) examined how firm Size moderates the relationship between various variables and financial distress of firms listed at the Nairobi Securities Exchange in Kenya for the period 2009-2018. Using Binary Logistic regression model, they found that Firm size indeed moderates the relationship between financial risk and financial distress of firms listed at the NSE, Kenya at 5% significance levels. Aliyu, Badara and Nurudeen (2022) examined the moderating effect of board equity ownership on the relationship between credit risk and financial performance of listed deposit money banks in Nigeria for the period 2013-2020. The result showed that there is a positive and significant relationship between board equity ownership and financial performance of listed deposit money banks in Nigeria. However, a negative significant relationship was found between credit risk and financial performance. In addition, the study found that board equity ownership had a positive and significant moderating effect on the relationship between credit risks. 3. METHODOLOGY This research adopted the ex-post facto research design because the event under investigation had already taken place. The population of the study was made up of the thirteen (13) Deposit Money Banks currently listed on the Nigerian Exchange Group. Judgemental sampling technique being a type of non- probability sampling method was used to select ten (10) Deposit Money Banks that were sampled. The selection was based on the Deposit Money Banks that have their annual reports on their websites for the period under study. The Deposit Money Banks that formed part of the sample size are: Access Bank Nig. Plc, Eco Bank Nig. Plc, Fidelity Bank Nig. Plc, Guarantee Trust Bank Nig. Plc, Sterling Bank Nig. PLC, Union Bank Nigeria PLC, United Bank for Africa Nig. Plc, Unity Bank Nig. PLC, Wema Bank Nig. Plc and Zenith Bank Nig. Plc. Descriptive statistics was computed such as the mean, median, standard deviation, minimum, maximum values statistics. This was used to describe the nature of data and also aid data visualization. The structural equation modelling was used to validate the hypotheses. Table 3.1 Definition of Variables/Proxies VARIABLES DEFINITION Previous Research with Similar Approach Dependent Variables Liquidity Performance (LIPF) CurrentAssets/Short Term Liabilities Hacini, Boulenfad and Dahou (2021); Khan et al. (2020). Independent Variables Operational Risk (OPR) Operating expenses/ operating income Simamora and Oswari (2019) Market Risk (MAKR) EBIT/EBIT-Interest Muriithi, (2016); Gatsi et al., (2013). Credit Risk (CRER) Non-performing loans/Total gross loans Chimkono et al., (2016); Al-shakrchy, (2017). MediatorVariable Capital Adequacy (CAQ) Shareholders’ Fund Total Assets Adamgbo et al, (2019); Mendoza et al, (2017). Control Variables Firm Size (SIZE) The natural log of total assets Aliyu, Badara and Nurudeen (2022); Al- slehat and Altameemi, (2021). Leverage (LEV) Total Debt / Total Assets Le and Phan (2017); Davydov, (2016).
- 4. International Journal of Trend in Scientific Research and Development @ www.ijtsrd.com eISSN: 2456-6470 @ IJTSRD | Unique Paper ID – IJTSRD61356 | Volume – 8 | Issue – 1 | Jan-Feb 2024 Page 178 3.1. Model Specification The model that was adopted for this study was the mediating effect model adapted from the work of Wiguna and Murwaningsari (2022). Their model is stated below: FERCit = ßa+ ßSRit + ßOCFit + ßGROWTHit + ßSRit*WCR + ßOCFit*WCR + ßGROWTHit*WCR + ßSIZE + ßTIME + ßPRO + ßLEV + et The model was modified by the researcher and restated as follows below: LIPF i, t = β0 + + β1 CAQ*OPR i, t + β2 CAQ*MAKR i, t + β3 CAQ*CRER + β4 SIZE i, t + β5 LEV + ε i, t Where: LIPF = Liquidity Performance LIQR = Liquidity Risk OPR = Operational Risk MAKR = Market Risk CRER = Credit Risk SIZE = Firm Size LEV = Leverage CAQ = Capital Adequacy 4. DATA PRESENTATION AND ANALYSIS The descriptive statistics of the main independent variables utilized in the study are presented in Table 4.1 below; the table shows the number of observations, mean, standard deviation, minimum and maximum values of the variables. The description helps in showing the nature of the data. Table 4.1: Summary statistics of variables Source: STATA 15 Outputs, 2023 The Obs. column (i.e., observations) shows the number of observations included in the analysis of the independent variables of the study as one hundred and thirty (130). The Mean is a measure of central tendency which calculates the average of a set of observations; while, the Standard Deviation (SD) is a measure of the average distance between the values of the data in the set and the mean. A low SD indicates that the data points tend to be very close to the mean; a high SD indicates that the data points are spread out over a large range of values. The mean value for assets which depicts firm size is 2.48, with a SD of 2.67 that shows that the values are spread out over a large range of values, a minimum value of 1.57 and a maximum value of 1.34. The mean value for capital adequacy is 0.08, with a SD of 0.23 which shows that the values are spread out over a small range of values, a minimum value of -1.54 and a maximum value of 0.65.The mean value for leverage is 0.92, with a SD of 0.23 which shows that the values are spread out over a small range of values, a minimum value of 0.69 and a maximum value of 2.55.The mean value for operational risk is 0.74, with a SD of 0.27 which shows that the values are spread out over a small range of values, a minimum value of 0.32 and a maximum value of 2.78.The mean value for market risk is -2.70, with a SD of 44.30 which shows that the values are spread out over a very large range of values, a minimum value of -502.39 and a maximum value of 6.16. The mean value for liquidity performance is 13.95, with a SD of 17.58 which shows that the values are spread out over a very large range of
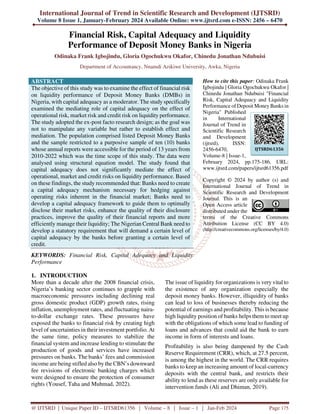
- 5. International Journal of Trend in Scientific Research and Development @ www.ijtsrd.com eISSN: 2456-6470 @ IJTSRD | Unique Paper ID – IJTSRD61356 | Volume – 8 | Issue – 1 | Jan-Feb 2024 Page 179 values, a minimum value of 0.34 and a maximum value of 140.50.The mean value for credit risk is 0.07, with a SD of 0.09 which shows that the values are spread out over a small range of values, a minimum value of 0 and a maximum value of 0.76. Table 4.2: Correlation Matrix Credit_Risk -0.1469 0.1205 -0.1455 0.0428 -0.3065 0.0439 1.0000 Liquidity_~e -0.2374 0.1624 -0.1783 -0.0359 0.0562 1.0000 Market_Risk 0.0508 0.0802 -0.0224 -0.0652 1.0000 Operationa~k -0.3151 -0.1244 0.1129 1.0000 Leverage -0.1206 -0.9779 1.0000 Capital_Ad~y 0.1736 1.0000 Assets 1.0000 Assets Capita~y Leverage Operat~k Market~k Liquid~e Credit~k Source: STATA 15 Outputs, 2023 Table 4.2 shows the result of correlation analyses. The table indicate the relationship between variables of the study. From the table, liquidity performance being the dependent variable has less than 25% relationship with all the independent variables. However, the relationship is positive in case of capital adequacy and market risk while is negative in the case of other variables. Asset (Firm size) has the highest relationship of 31% with operational risk, though negative. Capital adequacy has the highest relationship of 97.8% with leverage, though negative also. All other variables have less than 17% relationship with capital adequacy. Apart from capital adequacy, leverage has a negative relationship of 17.8% with liquidity performance. Market risk has less than 8% relationship with all the other variables, though negative for leverage, operational risk and credit risk. Credit risk has less than 15% relationship with all other variables. The overall result shows a weak relationship between the independent variables of the study which signifies the absence of multicollinearity among the independent variables. 4.1. Test of Hypotheses Hypothesis One Ho: Capital adequacy does not moderate the relationship between operational risk and liquidity performance of DMBs in Nigeria. Figure 4.1: SEM diagram for Hypothesis 1 Source: STATA 15 Outputs, 2023 Figure 4.1 shows the path analysis diagram of structural equation model. The paths in the diagram are the operation risk to capital adequacy path that has a coefficient of -0.11 and variance of 0.053. The second path is the capital adequacy to liquidity performance path that has a coefficient of 12.0 and a variance of 298. The third path is the operational risk to liquidity performance path that has a coefficient of -1 and variance of 298. The indirect path which is the moderating path shown as operational risk to capital adequacy multiplied by capital adequacy to liquidity performance has a coefficient of -1.3 (-0.11 x 12).
- 6. International Journal of Trend in Scientific Research and Development @ www.ijtsrd.com eISSN: 2456-6470 @ IJTSRD | Unique Paper ID – IJTSRD61356 | Volume – 8 | Issue – 1 | Jan-Feb 2024 Page 180 Table 4.3: Structural Equation Model for Hypothesis 1 . estat teffects . LR test of model vs. saturated: chi2(0) = 0.00, Prob > chi2 = . var(e.Liquidity_Performance) 298.3496 37.00572 233.9629 380.4557 var(e.Capital_Adequacy) .0534261 .0066267 .0418962 .068129 _cons 13.65472 4.527624 3.02 0.003 4.780742 22.5287 Operational_risk -1.026527 5.615605 -0.18 0.855 -12.03291 9.979857 Capital_Adequacy 12.05602 6.554118 1.84 0.066 -.7898194 24.90185 Liquidity_Performance _cons .1665269 .0588009 2.83 0.005 .0512791 .2817746 Operational_risk -.10657 .0745633 -1.43 0.153 -.2527114 .0395713 Capital_Adequacy Structural Coef. Std. Err. z P>|z| [95% Conf. Interval] OIM Log likelihood = -564.0483 Estimation method = ml Structural equation model Number of obs = 130 Iteration 1: log likelihood = -564.0483 Iteration 0: log likelihood = -564.0483 Fitting target model: Observed: Operational_risk Exogenous variables Observed: Capital_Adequacy Liquidity_Performance Endogenous variables Source: STATA 15 Outputs, 2023 Table 4.3 shows the same result as Figure 4.1 except that it include the number of iteration done to have a converge and also produced the log likelihood. It also showed the p-value of the various paths. The iteration was only once and had a log likelihood of -564.05. The p-value for the path operation risk to capital adequacy is 0.153. The second path which is the capital adequacy to liquidity performance path has a p-value of 0.066 while the third path which is the operational risk to liquidity performance path has a p-value of 0.855 The p-value of the indirect path which is the moderating path will be determined from the indirect effect model. Table 4.4: Structural Equation Model Indirect Effect for Hypothesis 1 Operational_risk -1.28481 1.138398 -1.13 0.259 -3.516029 .946409 Capital_Adequacy 0 (no path) Liquidity_Performance Operational_risk 0 (no path) Capital_Adequacy Structural Coef. Std. Err. z P>|z| [95% Conf. Interval] OIM Indirect effects Source: STATA 15 Outputs, 2023
- 7. International Journal of Trend in Scientific Research and Development @ www.ijtsrd.com eISSN: 2456-6470 @ IJTSRD | Unique Paper ID – IJTSRD61356 | Volume – 8 | Issue – 1 | Jan-Feb 2024 Page 181 Table 4.4 shows the indirect effect which is the moderating effect of the structural equation model. In our analysis, the p-value for the moderating path is 0.259 which means that capital adequacy does not have a moderating effect on the relationship between operational risk and liquidity performance of DMBs in Nigeria. Table 4.5: Structural Equation Model Total Effect for Hypothesis 1 Operational_risk -2.311337 5.644045 -0.41 0.682 -13.37346 8.750788 Capital_Adequacy 12.05602 6.554118 1.84 0.066 -.7898194 24.90185 Liquidity_Performance Operational_risk -.10657 .0745633 -1.43 0.153 -.2527114 .0395713 Capital_Adequacy Structural Coef. Std. Err. z P>|z| [95% Conf. Interval] OIM Total effects Source: STATA 15 Outputs, 2023 Table 4.5 shows the total effect that is the direct effect of operational risk on liquidity performance and the indirect effect via capital adequacy. In our analysis, the p-value for the total effect is 0.682 which means that operational risk does not have a significant effect on the liquidity performance of DMBs in Nigeria both directly and indirectly. Decision: since the p-value for the indirect effect of 0.259 is higher than the margin of error of 0.05, we therefore accept the null hypothesis: capital adequacy does not significantly moderate the relationship between operational risk and liquidity performance of DMBs in Nigeria. Hypothesis Two Ho: Capital adequacy does not moderate the relationship between market risk and liquidity performance of DMBs in Nigeria. Figure 4.2: SEM diagram for Hypothesis 2 Source: STATA 15 Outputs, 2023 Figure 4.2 shows the path analysis diagram of structural equation model. The paths in the diagram are the market risk to capital adequacy path that has a coefficient of 0.00042 and variance of 0.054. The second path is the capital adequacy to liquidity performance path that has a coefficient of 12.0 and a variance of 298. The third path is the market risk to liquidity performance path that has a coefficient of 0.017 and variance of 298. The indirect path which is the moderating path shown as market risk to capital adequacy multiplied by capital adequacy to liquidity performance has a coefficient of 0.00504 (0.00042 x 12).
- 8. International Journal of Trend in Scientific Research and Development @ www.ijtsrd.com eISSN: 2456-6470 @ IJTSRD | Unique Paper ID – IJTSRD61356 | Volume – 8 | Issue – 1 | Jan-Feb 2024 Page 182 Table 4.6: Structural Equation Model for Hypothesis 2 . estat teffects . LR test of model vs. saturated: chi2(0) = 0.00, Prob > chi2 = . var(e.Liquidity_Performance) 297.8503 36.94378 233.5713 379.8189 var(e.Capital_Adequacy) .0539165 .0066875 .0422808 .0687543 _cons 12.95126 1.623157 7.98 0.000 9.769935 16.13259 Market_Risk .0172542 .0344102 0.50 0.616 -.0501887 .084697 Capital_Adequacy 11.94284 6.518784 1.83 0.067 -.833741 24.71942 Liquidity_Performance _cons .0887793 .0204032 4.35 0.000 .0487898 .1287688 Market_Risk .0004234 .0004615 0.92 0.359 -.0004811 .0013279 Capital_Adequacy Structural Coef. Std. Err. z P>|z| [95% Conf. Interval] OIM Log likelihood = -1226.1741 Estimation method = ml Structural equation model Number of obs = 130 Iteration 1: log likelihood = -1226.1741 Iteration 0: log likelihood = -1226.1741 Fitting target model: Observed: Market_Risk Exogenous variables Observed: Capital_Adequacy Liquidity_Performance Endogenous variables Source: STATA 15 Outputs, 2023 Table 4.6 shows the same result as Figure 4.2 except that it include the number of iteration done to have a converge and also produced the log likelihood. It also showed the p-value of the various paths. The iteration was only once and had a log likelihood of 1226.17. The p-value for the path market risk to capital adequacy is 0.359. The second path which is the capital adequacy to liquidity performance path has a p-value of 0.067 while the third path which is the market risk to liquidity performance path has a p-value of 0.616 The p-value of the indirect path which is the moderating path will be determined from the indirect effect model. Table 4.7: Structural Equation Model Indirect Effect for Hypothesis 2 Market_Risk .0050568 .0061639 0.82 0.412 -.0070241 .0171378 Capital_Adequacy 0 (no path) Liquidity_Performance Market_Risk 0 (no path) Capital_Adequacy Structural Coef. Std. Err. z P>|z| [95% Conf. Interval] OIM Indirect effects Source: STATA 15 Outputs, 2023
- 9. International Journal of Trend in Scientific Research and Development @ www.ijtsrd.com eISSN: 2456-6470 @ IJTSRD | Unique Paper ID – IJTSRD61356 | Volume – 8 | Issue – 1 | Jan-Feb 2024 Page 183 Table 4.7 shows the indirect effect which is the moderating effect of the structural equation model. In our analysis, the p-value for the moderating path is 0.412 which means that capital adequacy does not have a moderating effect on the relationship between market risk and liquidity performance of DMBs in Nigeria. Table 4.8: Structural Equation Model Total Effect for Hypothesis 2 Market_Risk .022311 .0347393 0.64 0.521 -.0457768 .0903988 Capital_Adequacy 11.94284 6.518784 1.83 0.067 -.833741 24.71942 Liquidity_Performance Market_Risk .0004234 .0004615 0.92 0.359 -.0004811 .0013279 Capital_Adequacy Structural Coef. Std. Err. z P>|z| [95% Conf. Interval] OIM Total effects Source: STATA 15 Outputs, 2023 Table 4.8 shows the total effect which is the direct effect of market risk on liquidity performance and the indirect effect via capital adequacy. In our analysis, the p-value for the total effect is 0.521 which means that market risk does not have a significant effect on the liquidity performance of DMBs in Nigeria both directly and indirectly. Decision: since the p-value for the indirect effect of 0.412 is higher than the margin of error of 0.05, we therefore accept the null hypothesis: capital adequacy does not significantly moderate the relationship between market risk and liquidity performance of DMBs in Nigeria. Hypothesis Three Ho: Capital adequacy does not moderate the relationship between credit risk and liquidity performance of DMBs in Nigeria. Figure 4.3: SEM diagram for Hypothesis 3 Source: STATA 15 Outputs, 2023 Figure 4.3 shows the path analysis diagram of structural equation model. The paths in the diagram are the credit risk to capital adequacy path that has a coefficient of 0.3 and variance of 0.053. The second path is the capital adequacy to liquidity performance path that has a coefficient of 12.0 and a variance of 298. The third path is the credit risk to liquidity performance path that has a coefficient of 4.6 and variance of 298. The indirect path which is the moderating path shown as credit risk to capital adequacy multiplied by capital adequacy to liquidity performance has a coefficient of 3.6 (0.3 x 12).
- 10. International Journal of Trend in Scientific Research and Development @ www.ijtsrd.com eISSN: 2456-6470 @ IJTSRD | Unique Paper ID – IJTSRD61356 | Volume – 8 | Issue – 1 | Jan-Feb 2024 Page 184 Table 4.9: Structural Equation Model for Hypothesis 3 . estat teffects . LR test of model vs. saturated: chi2(0) = 0.00, Prob > chi2 = . var(e.Liquidity_Performance) 298.2416 36.99232 233.8781 380.3179 var(e.Capital_Adequacy) .0534782 .0066331 .0419371 .0681954 _cons 12.5777 1.940913 6.48 0.000 8.773585 16.38182 Credit_Risk 4.631056 16.32058 0.28 0.777 -27.35668 36.6188 Capital_Adequacy 11.98115 6.549742 1.83 0.067 -.8561079 24.81841 Liquidity_Performance _cons .0666576 .0253242 2.63 0.008 .0170231 .116292 Credit_Risk .3001695 .2169529 1.38 0.166 -.1250503 .7253893 Capital_Adequacy Structural Coef. Std. Err. z P>|z| [95% Conf. Interval] OIM Log likelihood = -425.30716 Estimation method = ml Structural equation model Number of obs = 130 Iteration 1: log likelihood = -425.30716 Iteration 0: log likelihood = -425.30716 Fitting target model: Observed: Credit_Risk Exogenous variables Source: STATA 15 Outputs, 2023 Table 4.9 shows the same result as Figure 4.3 except that it include the number of iteration done to have a converge and also produced the log likelihood. It also showed the p-value of the various paths. The iteration was only once and had a log likelihood of -425.31. The p-value for the path credit risk to capital adequacy is 0.166. The second path which is the capital adequacy to liquidity performance path has a p-value of 0.067 while the third path which is the market risk to liquidity performance path has a p-value of 0.777 The p-value of the indirect path which is the moderating path will be determined from the indirect effect model. Table 4.10: Structural Equation Model Indirect Effect for Hypothesis 3 Credit_Risk 3.596376 3.259122 1.10 0.270 -2.791387 9.984139 Capital_Adequacy 0 (no path) Liquidity_Performance Credit_Risk 0 (no path) Capital_Adequacy Structural Coef. Std. Err. z P>|z| [95% Conf. Interval] OIM Indirect effects Source: STATA 15 Outputs, 2023 Table 4.10 shows the indirect effect which is the moderating effect of the structural equation model. In our analysis, the p-value for the moderating path is 0.270 which means that capital adequacy does not have a moderating effect on the relationship between credit risk and liquidity performance of DMBs in Nigeria.
- 11. International Journal of Trend in Scientific Research and Development @ www.ijtsrd.com eISSN: 2456-6470 @ IJTSRD | Unique Paper ID – IJTSRD61356 | Volume – 8 | Issue – 1 | Jan-Feb 2024 Page 185 Table 4.11: Structural Equation Model Total Effect for Hypothesis 3 Credit_Risk 8.227432 16.40892 0.50 0.616 -23.93345 40.38831 Capital_Adequacy 11.98115 6.549742 1.83 0.067 -.8561079 24.81841 Liquidity_Performance Credit_Risk .3001695 .2169529 1.38 0.166 -.1250503 .7253893 Capital_Adequacy Structural Coef. Std. Err. z P>|z| [95% Conf. Interval] OIM Total effects Source: STATA 15 Outputs, 2023 Table 4.11 shows the total effect which is the direct effect of credit risk on liquidity performance and the indirect effect via capital adequacy. In our analysis, the p-value for the total effect is 0.616 which means that credit risk does not have a significant effect on the liquidity performance of DMBs in Nigeria both directly and indirectly. Decision: since the p-value for the indirect effect of 0.270 is higher than the margin of error of 0.05, we therefore accept the null hypothesis: capital adequacy does not significantly moderate the relationship between credit risk and liquidity performance of DMBs in Nigeria. 5. Conclusion Few studies have tried to find a suitable moderator or mediator for the effect of financial risk on various performance indices of different industries. This study however examined what effect financial risk will have on liquidity performance of DMBs in Nigeria when meditated capital adequacy. Several empirical literatures were reviewed both locally and internationally. Ex post facto research design was adopted for this study because of the unalterable nature of the independent variables utilized in the study. The population of the study comprised the DMBs listed on the Nigerian Exchange Group. The sample was delimited to six (10) DMBs that has their annual reports from 2010-2022 online. The study employed the structural equation modelling technique to analyse the data. This study thus concluded that capital adequacy does not mediate the relationship between financial risk and liquidity performance of DMBs in Nigeria. The following recommendations were made: 1. Banks need to create a capital adequacy mechanism necessary for hedging against operating risks inherent in the financial market. 2. Banks need to develop a capital adequacy framework to guide them to optimally disclose their market risks, enhance the quality of their disclosure practices, improve the quality of their financial reports and more efficiently manage their liquidity. 3. The Nigerian Central Bank need to develop a statutory requirement that will demand a certain level of capital adequacy by the banks before granting a certain level of credit. References [1] Agubata, S. N., and Odubuasi, A. C. (2021). Market risk and earnings capacity of agricultural firms in Nigeria. European Journal of Accounting, Auditing and Finance Research, 9(9), 30-40. https://doi.org/10.37745/ejaafr.2013 [2] Aliu, M., and Sahiti, A. (2016). The effect of credit risk management on banks profitability in Kosovo. European Journal of Economic Studies, (4), 492-515. [3] Aliyu, N.S., Badara, M.S., and Nurudeen, S.O. (2022). Credit risk and financial performance of banks in Nigeria: moderating effect of board equity ownership. Accounting and Taxation Review, 6(2): 1-13. [4] Bhattarai, Y. (2015). The effect of credit risk on the performance of Nepalese commercial banks. African Journal of Accounting, Auditing and Finance, 4(1), 81–87. [5] Falih, F. S., Kasim, R. and Yaseen, M. H. (2022). The effect of operational risk management on the financial performance of Iraqi commercial banks. Journal of Positive School Psychology, 6(3), 6493-6504. [6] Ishmail, D. M., Memba, F., and Muriithi, J. (2023). Operational risk and financial performance of microfinance banks in Kenya. International Academic Journal of Economics and Finance, 3(8), 265-278. [7] Kaddumi, T. and Al-Kilani, Q. A. (2022). Operational risks and financial performance –
- 12. International Journal of Trend in Scientific Research and Development @ www.ijtsrd.com eISSN: 2456-6470 @ IJTSRD | Unique Paper ID – IJTSRD61356 | Volume – 8 | Issue – 1 | Jan-Feb 2024 Page 186 the context of the Jordanian banking environment. Journal of Southwest Jiaotong University, 57(4), 340-349. DOI:10.35741/issn.0258-2724.57.4.30 [8] Karugu, K. P., Muturi, W. D. and Muathe, S. M. A. (2020). Market risks, firms’ size and financial performance: reality or illusion in microfinance institutions in Kenya. International Journal of Economics and Finance, 12(11), 118-129. doi:10.5539/ijef.v12n11p118 [9] Karuri, N.A. (2014). The relationship between interest rates and mortgage default rate among financial institutions in Kenya. Retrieved from http://erepository.uonbi.ac.ke/handle/11295/767 89 [10] Khemraj, T., and Pasha, S. (2013). Determinants of non-performing loans in licensed commercial banks: Evidence from Sri Lanka. Asian Economic and Financial Review, 5(6), 868–882. [11] Mendoza, R. and Rivera, J. P. R. (2017). The effect of credit risk and capital adequacy on the profitability of Rural Banks in the Philippines. Scientific Annals of Economics and Business 64(1), 83 – 96. [12] Oke, L. A., and Tiamiyu, S. (2022). Credit risk, market risk and financial performance of selected deposit money banks in Nigeria. Amity Journal of Management Research, 5(1), 221- 234. [13] Orjinta, H. I., and Ighosewe, E. F. (2022). Market risks management and performance of deposit money banks in Nigeria: the challenges of 4th industrial revolution. Modern Economy, 13, 1508-1520. https://doi.org/10.4236/me.2022.1311081 [14] Qin, X., and Pastory, D. (2012). Commercial banks profitability position: the case of Tanzania, International Journal of Business and Management, 7(13), 136-144 [15] Sathyamoorthi, C., Mapharing, M., Mphoeng, M., and Dzimiri, M. (2020). Impact of financial risk management practices on financial performance: Evidence from commercial banks in Botswana. Applied Finance and Accounting, 6(1), 25-39. [16] Waitherero, K. F., and Wangari, M. G. (2022). Influence of credit risk on value of private equity firms: An empirical survey of savings and credit cooperatives in Kenya. International Academic Journal of Economics and Finance, 3(7), 190-204. https://iajournals.org/articles/iajef_v3_i7_190_ 204.pdf [17] Walela, E., Omagwa, J. and Muathe, S. (2022). Financial risk, firm size and financial distress: Turbulent times for firms listed at the Nairobi Securities Exchange, Kenya. Advance Journal of Social Science, 10(1), 88-102. https://doi.org/10.21467/ajss.10.1.88-102 [18] Yousef, A. N. B., Taha, R., and Muhmad, S.N. (2022). Credit risk and financial performance in the middle-east and North Africa banks. Journal of Tianjin University Science and Technology, 55(6), 1-20. DOI:10.17605/OSF.IO/4RA5D