
Recommended
Recommended
More Related Content
Similar to Financial analysis.docx
Similar to Financial analysis.docx (20)
More from Zeyad43
More from Zeyad43 (20)
Recently uploaded
Recently uploaded (20)
Financial analysis.docx
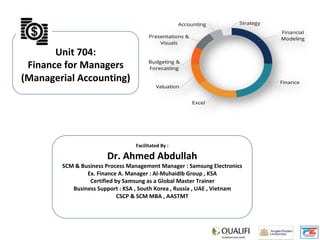
- 1. Unit 704: Finance for Managers (Managerial Accounting) Facilitated By : Dr. Ahmed Abdullah SCM & Business Process Management Manager : Samsung Electronics Ex. Finance A. Manager : Al-Muhaidib Group , KSA Certified by Samsung as a Global Master Trainer Business Support : KSA , South Korea , Russia , UAE , Vietnam CSCP & SCM MBA , AASTMT
- 2. Economic activities Accounting “links” decision makers with economic activities and with the results of their decisions. Actions (decisions) Decision makers The accounting process A i ccounting nformation
- 3. Information System Performance evaluations Stock investments Tax strategies Labor relations Resource allocations Lending decisions Borrowing Decisions Supported Cash flows Financial position Profitability Financial Information Provided Investors Creditors Managers Owners Customers Employees Information Users
- 4. Types of Accounting •Preparation •Analysis •Auditing •Regulatory •Consulting •Planning •Criminal investigatio n Financial •General accounting •Cost accounting •Budgeting •Internal auditing •Consulting •Controller •Treasurer •Strategy Managerial •Preparation •Planning •Regulatory •Investigations •Consulting •Enforcement •Legal services •Estate plans Taxation 1-4
- 6. Interpret and record business transactions. Classify similar transactions into useful reports. Summarize and communicate information to decision makers. Basic Functions of an Accounting System
- 7. Importance of Accounting Accounting is a system that information that is to help users make better decisions. 1-7 Records Reliable Comparable Communicates Relevant Identifies
- 8. 1-8 Relevant Information Affects the decision of its users. Reliable Information Is trusted by users. Comparable Information Used in comparisons across years & companies. Generally Accepted Accounting Principles Financial accounting practice is governed by concepts and rules known as generally accepted accounting principles (GAAP).
- 9. Role of Financial Information • Financial information pervades our economy – It is the primary means of communication between profit seeking organizations and their stakeholders – For this reason organizations use financial measures internally as a broad indicator of performance • This financial information provides a signal that something is wrong, but not what is wrong • Financial information summarizes underlying activities – But to explain financial results, managers need to dig deeper – Detailed information provides additional insight into what is happening to profits 1-9 2003 Prentice Hall Business Publishing, PowerPoint supplement to Management Accounting, 4rd ed.,
- 10. 1-10 Users of Financial Information External Users •Lenders •Consumer Group •Shareholders •ExternalAuditors •Governments •Customers Internal Users s •Managers •Sales Staff •Officers •Budget Officers •Internal Auditors •Controllers
- 11. 1-11 Users of Financial Information External Users Financial accounting provides external users with financial statements. Internal Users Managerial accounting provides information needs for internal decision makers.
- 12. Principles of Accounting Objectivity Principle Accounting information is supported by independent, unbiased evidence. Going-Concern Principle Reflects assumption that the business will continue operating instead of being closed or sold. Future Now Cost Principle Accounting information is based on actual cost.
- 13. Principles of Accounting Monetary Unit Principle Express transactions and events in monetary, or money, units. Revenue Recognition Principle 1. Recognize revenue when it is earned. 2. Proceeds need not be in cash. 3. Measure revenue by cash received plus cash value of items received. Business Entity Principle A business is accounted for separately from other business entities, including its owner.
- 14. Principles of Accounting Going-concern means that accounting information reflects a presumption the business will continue operating. Business entity means that a business is accounted for separately from its owner or other business entities. Cost principle means that accounting information is based on actual cost. Revenue recognition principle provides guidance on when a company must recognize revenue. Monetary unit means we can express transactions in money. Matching Principle prescribes that a company must record its expenses incurred to generate the revenue. 1-14 Full disclosure principle requires a company to report the details behind financial statements that would impact users’ decisions.
- 15. 1-15 Business Entity Forms Sole Proprietorship Partnership Corporation
- 16. 1-16 Accounting Equation Assets Liabilities & Equity = + Equity Liabilities Assets
- 18. 1-17
- 21. Assets = Liabilities + Equity Liabilities Expanded Accounting Equation _ Dividends + Revenues _ Retained Earnings = + 1-20 Expenses Common Stock Equity Assets
- 22. Accounting and Financial statements WHAT IS ACCOUNTING AND FINANCIAL STATEMENTS? WHAT ARE TYPES OF FINANCIAL STATEMENTS? Copyright © 2016 by McGraw-Hill Global Education LLC. All rights reserved.
- 23. Accounting and Financial Statements • Financial statements arewritten records that convey the business activities and the financial performance of a company. • Financial statements include Balance sheet. Incomestatement. Cash flow statement. • income statement, • statement of financial position, • statement of change in equity, • statement of cash flow, • Noted (disclosure) tofinancial statements. •A balance sheet is a financial statement that reports a company's assets, liabilities and shareholders' equity. • Assets, • liabilities, • equity, • revenue • expenses. What is a Balance Sheet Types of accounts What is accounting and financial statements? What are the major types of financial statements?
- 24. 2-23 Copyright © 2016 by McGraw-Hill Global Education LLC. All rights reserved. Balance Sheet •The balance sheet is a snapshot of the firm’s assets and liabilities at a given point intime •Assets = Liabilities + Stockholders’ Equity •A number of ratios can be derived from the balance sheet, helping investors get a senseof how healthy a company is. •These include the debt-to-equity ratio and the acid-test ratio, along with manyothers Balance Sheet formula Definition of balance sheet Rations
- 25. 2-24 Copyright © 2016 by McGraw-Hill Global Education LLC. All rights reserved. Example: U.S. Corporation Balance Sheet
- 26. 2-25 Copyright © 2016 by McGraw-Hill Global Education LLC. All rights reserved. Example: Balance sheet for Klingon Corporation
- 27. 2-26 Copyright © 2016 by McGraw-Hill Global Education LLC. All rights reserved. Income Statement An income statement or profit and loss account is one of the financial statements of a company and shows the company's revenues and expenses during a particular period. Income statement indicates how the revenues are transformed into the net income or net profit. An income statement is one of the three (along with balance sheet and statement of cash flows) major financial statements that reports a company's financial performance over a specific accounting period. Net Income = (Total Revenue + Gains) – (Total Expenses + Losses) Total revenue is the sum of both operating and non-operating revenues while total expenses include those incurred by primary and secondary activities. Revenues are not receipts. Revenue is earned and reported on the income statement. Receipts (cash received or paid out) are not. An income statement provides valuable insights into a company’s operations, the efficiency of its management, under- performing sectors and its performance relative to industry peers.
- 28. 2-27 Copyright © 2016 by McGraw-Hill Global Education LLC. All rights reserved. Corporation Income Statement
- 29. What is the difference between Accounting income and cash flow • Accounting income = revenue - expenses • Cash flow represents cash in and cash out • Net cash = Cash inflow –Cash outflow • A cash flow statement shows the exact amount of a company's cash inflows and outflows over a period of time. • The income statement (accounting financial statement) is the most common financial statement and shows a company's revenues and total expenses, including noncash accounting, such as depreciation over a period of time Cash flow Accounting income The difference between accounting income and cash flow
- 30. How to determine a firm’s cash flow from its financial statements • Use the cash flow statement and balance sheet to obtain cash flow from operations by adding net income, depreciation and amortization together with income from other sources or charges, then subtract the net increasein working capital (current assets minus current liabilities). • Free Cash Flow = Net income + Depreciation/Amortization – (Change in Working Capital – Capital Expenditure). • Operating Cash Flow = Operating Income + Depreciation – Taxes + Changein Working Capital. • Cash Flow Forecast = Beginning Cash + Projected Inflows – ProjectedOutflows = Ending Cash Cash flow formula Calculating Cash Flow from the Income Statement
- 31. 4-30 © 2012 Pearson Prentice Hall. All rightsreserved. Depreciation • Depreciation is the portion of the costs of fixed assets charged against annual revenues over time. • Depreciation for tax purposes is determined by using the modified accelerated cost recovery system (MACRS). • On the other hand, a variety of other depreciation methods are often used for reporting purposes.
- 32. 4-31 © 2012 Pearson Prentice Hall. All rightsreserved. Baker Corporation acquired a new machine at a cost of $38,000, with installation costs of $2,000. When the machine is retired from service, Baker expects that it will sell it for scrap metal and receive $1,000. What is the depreciable value of the machine? – Regardless of its expected salvage value, the depreciable value of the machine is $40,000: $38,000 cost + $2,000 installation cost. Depreciation: An Example
- 33. 4-32 © 2012 Pearson Prentice Hall. All rightsreserved. • Under the basic MACRS procedures, the depreciable value of an asset is its full cost, including outlays for installation. • No adjustment is required for expected salvage value. • For tax purposes, the depreciable life of an asset is determined by its MACRS recovery predetermined period. • MACRS property classes and rates are shown in Table 4.1 on the following slides. Depreciation: Depreciable Value and Depreciable Life
- 34. 4-33 © 2012 Pearson Prentice Hall. All rightsreserved. Table 4.1 First Four Property Classes under MACRS
- 35. Copyright © 2016 by McGraw-Hill Global Education LLC. All rights reserved. Financial Analysis / Ratios Calculation Sources and uses of cash and the Statement of Cash Flows How to compute and interpret important financial ratios Be able to compute and interpret the DuPont Identity Understand the problems and pitfalls in financial statement analysis
- 36. Copyright © 2016 by McGraw-Hill Global Education LLC. All rights reserved. Why Evaluate Financial Statements? • Performance evaluation –compensation and comparison between divisions • Planning for the future – guide in estimating future cash flow • Creditors • Suppliers • Customers • Stockholders Internal uses External uses Evaluation of the statement of cash flows helps in understanding the impact of the firm's liquidity position from itsoperations, investments and financial activities over the period—in essence, where funds came from, where they went, and how the overall liquidity of the firm wasaffected.
- 37. Financial Ratios purposes Financial ratios are grouped into the following categories: • Liquidity ratios • Leverage ratios • Efficiency ratios • Profitability ratios • Market value ratios Track company performance • Determining individual financial ratios per period and tracking the change in their values over time is done to spot trends that may be Ma d ke evc eo lo m pp in a g ra in tiv ae co ju m dp gm an e yn . ts regarding company performance • Comparing financial ratios with that of major competitors is done to identify whether a company is performing better or worse than the industry average.
- 38. Statement of Cash Flows A cash flow statement is a financial statement that summarizes the amount of cash and cash equivalents entering and leaving a company. The main components of the cash flow statement are cash from operating activities, cash from investing activities, and cash from financing activities
- 39. Developing the Statement of Cash Flows 4-38 • The statement of cash flows summarizes the firm’s cash flow over a given period of time. • Firm’s cash flows fall into three categories: – Operating flows: cash flows directly related to sale and production of the firm’s products and services. – Investment flows: cash flows associated with purchase and sale of both fixed assets and equity investments in other firms. – Financing flows: cash flows that result from debt and equity financing transactions; include incurrence and repayment of debt, cash inflow from the sale of stock, and cash outflows to repurchase stock or pay cash dividends. © 2012 Pearson Prentice Hall. All rights reserved.
- 40. How do you determine sources and uses of cash • existing cash on the balance sheet, revolver, new debt issuances, new equity issuances. • purchasing the target's equity, repaying the target's debt or refinancing the target's debt, as well as the financingand transaction expenses. Uses of cash include: Sources of cash include: Sources of cash are things that yield cash and uses of cash drain the cash balance. Assets are typically liabilities are uses of cash as they turn into an expense down the line either paying accrued expenses or long-term liabilities.
- 41. Inflows and Outflows of Cash 4-40 © 2012 Pearson Prentice Hall. All rights reserved.
- 42. How to compute and interpret important financial ratios Financial ratios are created with the use of numerical values taken from financial statements to gain meaningful information about a company By understanding what each key financial ratio is assessing, we can more easily derive the ratios with a quick look at the financial statements. A ratio takes one number and divides it into another number to determine a decimal that can later be converted to a percentage> The numbers found on a company’s financial statements – balance sheet, income statement, and cash flow statement – are used to perform quantitative analysis and assess a company’s liquidity, leverage, growth, margins, profitability, rates of return
- 43. Liquidity ratios Financial ratios that measure a company’s ability to repay both short- and long- term obligations. The current ratio measures a company’s ability to pay off short-term liabilities with current assets Current ratio = Current assets / Current liabilities The acid-test ratio measures a company’s ability to pay off short-term liabilities with quick assets Acid-test ratio = Current assets – Inventories / Current liabilities The cash ratio measures a company’s ability to pay off short-term liabilities with cash and cash equivalents Cash ratio = Cash and Cash equivalents / Current Liabilities The operating cash flow ratio is a measure of the number of times a company can pay off current liabilities with the cash generated in a given period:
- 44. Operating cash flow ratio = Operating cash flow / Current liabilities
- 45. Example of acid test ratio • Company A: ($95,125 – $5,412) / ($75,231 – $45,232) = 2.99 • Company B: ($102,343 – $6,454) / ($85,010 – $34,142) = 1.89 • Company C: ($152,342 – $10,343) / ($95,010 – $53,434) = 3.42 Acid Test Ratio:
- 46. Computing Liquidity Ratios Current Ratio = CA / CL 2,256 / 1,995 = 1.13 times Quick Ratio = (CA – Inventory) / CL (2,256 – 301) / 1,995 = .98 times Cash Ratio = Cash / CL 696 / 1,995 = .35 times NWC to Total Assets = NWC / TA (2,256 – 1,995) / 5,394 = .05 Interval Measure = CA / average daily operating cost 2,256 / ((2,006 + 1,740)/365) = 219.8 days Copyright © 2016 by McGraw-Hill Global Education LLC. All rights reserved.
- 47. Leverage Financial Ratios Leverage ratios measure the amount of capital that comes from debt. The debt ratio measures the relative amount of a company’s assets that are provided from debt Debt ratio = Total liabilities / Total assets The debt to equity ratio calculates the weight of total debt and financial liabilities against shareholders’ equity: Debt to equity ratio = Total liabilities / Shareholder’s equity The interest coverage ratio shows how easily a company can pay its interest expenses Interest coverage ratio = Operating income / Interest expenses The debt service coverage ratio reveals how easily a company can pay its debt obligations: Debt service coverage ratio = Operating income / Total debt service
- 49. Efficiency Ratios Efficiency ratios, also known as activity financial ratios, are used to measure how well a company is utilizing its assets and resources. The asset turnover ratio measures a company’s ability to generate sales from assets: Asset turnover ratio = Net sales / Average total assets The inventory turnover ratio measures how many times a company’s inventory is sold and replaced over a given period: Inventory turnover ratio = Cost of goods sold / Average inventory The accounts receivable turnover ratio measures how many times a company can turn receivables into cash over a given period: The days sales in inventory ratio measures the average number of days that a company holds on to inventory before selling it to customers:
- 50. Receivables turnover ratio = Net credit sales / Average accounts receivable Days sales in inventory ratio = 365 days / Inventory turnover ratio
- 51. Profitability Ratios Profitability ratios measure a company’s ability to generate income relative to revenue, balance sheet assets, operating costs, and equity. The gross margin ratio compares the gross profit of a company to its net sales to show how much profit a company makes after paying its cost of goods sold: Gross margin ratio = Gross profit / Net sales The operating margin ratio compares the operating income of a company to its net sales to determine operating efficiency: Operating margin ratio = Operating income / Net sales The return on assets ratio measures how efficiently a company is using its assets to generate profit: Return on assets ratio = Net income / Total assets The return on equity ratio measures how efficiently a company is using its equity to generate profit: Return on equity ratio = Net income / Shareholder’s equity
- 52. Market Value Ratios Market value ratios are used to evaluate the share price of a company’s stock. Common market value ratios include the following: The book value per share ratio calculates the per-share value of a company based on the equity Book value per share ratio = (Shareholder’s equity – Preferred equity) / Total common shares outstanding available to shareholders: The dividend yield ratio measures the amount of dividends attributed to shareholders relative to the market Dividend yield ratio = Dividend per share / Share price value per share: The earnings per share ratio measures the amount of net income earned for each share outstanding: Earnings per share ratio = Net earnings / Total shares outstanding The price-earnings ratio compares a company’s share price to its earnings per
- 53. share: Price-earnings ratio = Share price / Earnings per share
- 54. Benchmarking • Used to see how the firm’sperformance is changing through time • Internal and external uses • Compare to similar companies or within industries • SIC and NAICS codes 3-49 Time-Trend Analysis Peer Group Analysis Ratios are not very helpful by themselves; they need to be compared to something
- 55. Capital Budgeting Techniques CAPITAL BUDGETING TECHNIQUES / METHODS Payback period Non discount methods Accounting rate of return method ( ROI ). Discounted method includes NPV method profitability index method IRR. Copyright © 2016 by McGraw-Hill Global Education LLC. All rights reserved. Capital budgeting Capital budgeting, and investment appraisal, is the planning process used to determine whether an organization's long term investments such as new machinery, replacement of machinery, new plants, new products, and research development projects are worth the funding of cash through the firm's capitalization structure
- 56. Non-Discount Method in capital budgeting • The payback method simply computes the number of years it will take for an investment to return cash equal to the amount invested. • For example, if an investment of $100,000 is made and it generates cash of $50,000 for two years followed by $10,000 per year for four additional years, its payback is two years ($50,000 + $50,000). • If another investment of $100,000 generates cash of $20,000 per year fortwo years and then provides cash of $40,000 per year for six additional years, its payback is approximately 3.5 years ($20,000 + $20,000 + $40,000 + 0.5 times $40,000). A non-discount method of capital budgetingdoes not explicitly consider the time value of money. In other words, each dollar earned in the future is assumed to have the same value as each dollar that was invested many years earlier. The payback method is one of the techniques used in capital budgeting thatdoes not consider the time value of money.
- 57. Payback Period • Payback period in capital budgeting refers to the time required to recoup thefunds expended in an investment, • For example, a $1000investment made at the start of year 1 which returned $500 at the end of year 1 and year 2 respectively would have a two-year payback period •A longer payback period indicates capital is tied up. •Focus on early payback can enhance liquidity. •Investment risk can beassessed through payback method. •Shorter term forecasts. •This is more reliable technique. •Ignores the time value of money: •Cash flows received during the early years of a project get a higher weight than cash flows received in later years. Definition Advantages of Payback Method Disadvantages of the Payback Method
- 58. Accounting Rates of Return Accounting Rate of Return (ARR) is the percentage rate of return that is expected from an investment or asset compared to the initial cost of investment.
- 59. Accounting Rate of Return advantages and disadvantage • ARR is based on accounting information, therefore, other special reports are not required for determining ARR. • ARR method is easy to calculate and simple to understand. • ARR method is based on accountingprofit hence measures the profitability of investment. • ARR ignores the time value of money. • ARR method ignores the cash flow from investment • ARR method does not consider terminal value of the project. Advantages Of Accounting Rate Of Return (ARR) Disadvantages Of Accounting Rate OF Return (ARR)
- 60. Net Present Value CAPITAL BUDGETING TECHNIQUES / METHODS The Discounted Payback The Internal Rate of Return There are different methods adopted for capital budgeting. The traditional methods or nondiscount methods include: Payback period and Accounting rate of return method. The discounted cash flow method includes the NPV method, profitability index method and IRR.
- 61. Financial Calculator and a Spreadsheet to Solve Time Value of Money Problems Financial Calculato r Excel (and other spreadsheet programs) is the greatest financial calculator ever made. There is more of a learning curve than a regular financial calculator, but it is much more powerful.
- 62. Net Present Value 1. Net present value (NPV) • is the difference between the present value of cash inflows and the present value of cash outflows over a period of time. • NPV is used in capital budgeting and investment planning to analyze the profitability of a projected investment or project. • net present value is nothing but net off of the present value of cash inflows and outflows by discounting the flows at a specified rate NPV = ∑(CFn / (1 + i)n) – Initial Investment •n = Period which takes values from 0 to the nth period till the cash flows ending period •CFn = Cash flow in the nth period •i = Discounting rate Q1. Assuming the initial cash flow for a project is $10,000 invested for a project and subsequent cash flows for each year for 5 years is $3,000. The discount rate is assumed to be 10%. Calculate Net Present Value.
- 63. Net Present Value Q1. Assuming the initial cash flow for a project is $10,000 invested for a project and subsequent cash flows for each year for 5 years is $3,000. The discount rate is assumed to be 10%. Calculate Net Present Value. `NPV= $ (10,000) +$2,727.27+ $2,479.34 +$2,253.94+ $2,049.04 $+1,862.76 =$1,372.36
- 64. The Discounted Payback Payback period : 3.4 years Discounted payback: 4.4 years The discounted payback period is a modified version of the payback period that accounts for the time value of money. Both metrics are used to calculate the amount of time that it will take for a project to “break even,” or to get the point where the net cash flows generated cover the initial cost of the project. Both the payback period and the discounted payback period can be used to evaluate the profitability and feasibility of a specific project.
- 65. The Internal Rate of Return The internal rate of return is a metric used in financial analysis to estimate the profitability of potential investments. The internal rate of return is a discount rate that makes the net present value (NPV) of all cash flows equal to zero in a discounted cash flow analysis IRR= $(10,000) +$ 5,000 +$7,500 +$ 10,000 + $12,500 +$15,000 = 71%
- 66. Summary – DCF Criteria • Difference between market value and cost • Take the project if the NPV is positive • Has no serious problems • Preferred decision criteria Net present value Internal rate of return • Discount rate that makes NPV = 0 • Take the project if the IRR is greater than the required return • Same decision as NPV with conventional cash flows
- 67. References 1. R. Baker, P. Wallage: The Future of Financial Reporting in Europe: Its Role in corporate Governance, The International Journal of Accounting, Vol. 35, No. 2, 2000. 2. B. Elliot, J. Elliot: Financial Accounting and Reporting, 10th edition, Pearson Education Limited, Essex, 2006. 3. D. Gulin, F. Spajic, V. Vasicek, and K. Zager: Influence of Stock Manipulations on Financial Statements, AIESA – Building of Society based on knowledge, International Scientific Conference, Bratislava, 2005. 4. D. Gulin, L. Zager, B. Tusek: The Role of Accounting in Corporate Governance, MicroCAD 2005, International Scientific Conference, University of Miskolc (UM) & Innovation and Technology Transfer Centre (ITTC), Miskolc, 2005 5. “International Financial Reporting Standards”, International Accounting Standards Committee Foundation, London, 2004. 6. P. Miller, P. Bahnson: Quality Financial Reporting, Mcgraw-Hill, New York, 2002. 7. M.B. Romney, P.J. Steinbart, B.E. Cushing: Accounting Information Systems, AddisonWesley Publishing Company, 1997.