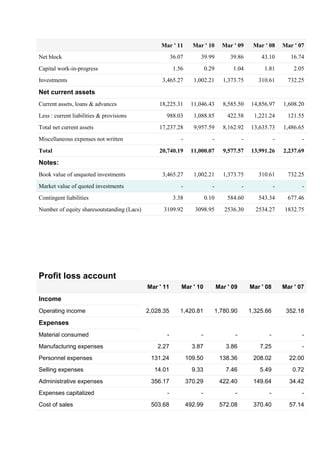
TOPIC –              FINANCE REPOTING
ANALYSIS


SUBMITTED TO:
SUBIMITTED BY:
PROF . U.PADMAVTHI              KULDEEP
YADAV
                            REG NO- 6024
                            FINANCE
                            PGDM 2010-12
Quarterly
Results
                                         Balance sheet
Statement                                     P&L
                                           Cash flow
                                            Dividend
                                         Share holding
More                                    Capital structures
                                              Ratio


(Rscrore)


Quarterly results in brief
                             Sep ' 11     Jun ' 11       Mar ' 11          Dec ' 10         Sep ' 10
Sales                         712.22       682.35            590.08            568.76        484.39
Operating profit              589.68       555.12            400.49            450.08        375.98
Interest                      376.06       341.19            271.78            204.06        166.25
Gross profit                  227.33       238.51            137.90            252.67        216.79
EPS (Rs)                        5.49          5.64             5.11              5.60          4.76

Quarterly results in details
                                         Sep ' 11    Jun ' 11     Mar ' 11      Dec ' 10    Sep ' 10
Other income                                13.72       24.59           9.19        6.65       7.06
Stock adjustment                                 -            -            -            -          -
Raw material                                     -            -            -            -          -
Power and fuel                                   -            -            -            -          -
Employee expenses                           41.17       35.78          45.06       26.90      28.46
Excise                                           -            -            -            -          -
Admin and selling expenses                       -            -            -            -          -
Research and development expenses                -            -            -            -          -
Expenses capitalised                             -            -            -            -          -
Other expenses                              81.37       91.46         144.54       91.78      79.95
Provisions made                                  -            -            -            -          -
Depreciation                                  1.99       1.96           2.80        2.33       2.10
Sep ' 11    Jun ' 11    Mar ' 11   Dec ' 10    Sep ' 10
Taxation                             54.56      60.96      -23.71      76.36       67.03
Net profit / loss                  170.79      175.60      158.80     173.98      147.66
Extra ordinary item                      -           -           -          -           -
Prior year adjustments                   -           -           -          -           -
Equity capital                       62.24      62.23       62.20      62.16       62.07
Equity dividend rate                     -           -           -          -           -
Agg.of non-prom. shares (Lacs)    2106.52     2106.15     2104.37    2102.60     2026.61
Agg.ofnon promoteholding (%)         67.69      67.68       67.67      67.65       65.30
OPM (%)                              82.79      81.35       67.87      79.13       77.62
GPM (%)                              31.32      33.74       23.01      43.91       44.11
NPM (%)                              23.53      24.84       26.50      30.24       30.05


Balance sheet
                                  Mar ' 11    Mar ' 10    Mar ' 09   Mar ' 08    Mar ' 07

Sources of funds
Owner's fund
Equity share capital                 62.20       61.98       50.73      50.69       36.66
Share application money                0.27           -          -           -      13.49
Preference share capital                  -           -     156.87     156.87      347.76
Reserves & surplus                 4,089.69    3,992.22   2,999.41    2,886.14     959.39

Loan funds
Secured loans                     14,540.41    3,613.87   4,062.56    3,559.57     150.29
Unsecured loans                    2,047.62    3,332.00   2,308.00    7,338.00     730.10
Total                             20,740.19   11,000.07   9,577.57   13,991.26   2,237.69

Uses of funds
Fixed assets
Gross block                          67.35       62.87       55.55      52.41       18.30
Less : revaluation reserve                -           -          -           -          -
Less : accumulated depreciation      31.27       22.88       15.70        9.31       1.56
Mar ' 11        Mar ' 10        Mar ' 09      Mar ' 08      Mar ' 07
Net block                                              36.07        39.99           39.86         43.10         16.74
Capital work-in-progress                                1.56            0.29         1.04          1.81          2.05
Investments                                      3,465.27        1,002.21        1,373.75        310.61        732.25

Net current assets
Current assets, loans & advances                18,225.31       11,046.43        8,585.50     14,856.97      1,608.20
Less : current liabilities & provisions            988.03        1,088.85          422.58      1,221.24        121.55
Total net current assets                        17,237.28        9,957.59        8,162.92     13,635.73      1,486.65
Miscellaneous expenses not written                         -               -              -              -          -
Total                                           20,740.19       11,000.07        9,577.57     13,991.26      2,237.69

Notes:
Book value of unquoted investments               3,465.27        1,002.21        1,373.75        310.61        732.25
Market value of quoted investments                         -               -              -              -          -
Contingent liabilities                                  3.38            0.10       584.60        543.34        677.46
Number of equity sharesoutstanding (Lacs)         3109.92         3098.95         2536.30       2534.27      1832.75


Profit loss account
                                            Mar ' 11       Mar ' 10            Mar ' 09       Mar ' 08       Mar ' 07

Income
Operating income                            2,028.35      1,420.81         1,780.90           1,325.66        352.18

Expenses
Material consumed                                  -                -                 -              -              -
Manufacturing expenses                         2.27              3.87             3.86           7.25               -
Personnel expenses                           131.24            109.50           138.36         208.02          22.00
Selling expenses                              14.01              9.33             7.46           5.49           0.72
Administrative expenses                      356.17            370.29           422.40         149.64          34.42
Expenses capitalized                               -                -                 -              -              -
Cost of sales                                503.68            492.99           572.08         370.40          57.14
Mar ' 11    Mar ' 10     Mar ' 09    Mar ' 08    Mar ' 07
Operating profit                      1,524.66      927.82    1,208.81      955.26      295.04
Other recurring income                    1.08        0.40         0.77        0.06       0.47
Adjusted PBDIT                        1,525.75      928.23    1,209.58      955.32      295.51
Financial expenses                     773.22       533.88      951.89      384.53       64.41
Depreciation                              9.35        7.37         6.81        6.05       1.25
Other write offs                             -           -            -           -           -
Adjusted PBT                           743.18       386.97      250.88      564.74      229.85
Tax charges                            182.18       130.43       53.67      184.85       77.83
Adjusted PAT                           560.99       256.54      197.21      379.89      152.02
Non recurring items                     18.81        -0.92        -5.83        0.04       1.09
Other non cash adjustments              28.71        -4.63        -1.21        2.04           -
Reported net profit                    608.51       251.00      190.17      381.97      153.10
Earnings before appropriation          727.06       387.64      271.39      461.77      153.26
Equity dividend                        310.68       154.95       50.73      218.21       55.41
Preference dividend                          -        7.82       15.69         9.11      11.53
Dividend tax                            51.05        27.06       11.29        38.63      10.09
Retained earnings                      365.34       197.80      193.69      195.82       76.23


Cash flow
                                       Mar ' 11    Mar ' 10    Mar ' 09    Mar ' 08    Mar ' 07
Profit before tax                       790.87      394.25      246.90      566.86      230.94
Net cash flow-operating activity      -5,888.00   -2,914.37     830.27    -4,471.37   -2,102.21
Net cash used in investing activity     797.92      509.41     -360.44       -14.95    -313.01
Net cash used in fin. activity        9,227.52    1,334.73    -4,449.33   10,797.13   2,711.88
Net inc/dec in cash and equivlnt      4,137.44    -1,070.24   -3,979.50    6,310.81     296.65
Cash and equivalent begin of year       289.43    1,359.67    6,940.09      629.28       68.08
Cash and equivalent end of year       4,426.87      289.43    2,960.60     6,940.09     364.73
Dividend
Year                   Month                         Dividend (%)
2011                   Oct                           300
2011                   Apr                           250
2010                   Oct                           250
2010                   Apr                           250
2009                   Jun                           100
2008                   Apr                           425
2007                   Apr                           50
2007                   Jan                           100
2006                   Apr                           15
2006                   Jan                           25
2005                   Oct                           50


Share holding
Share holding pattern as on :                         30/09/2011        30/06/2011      31/03/2011
Face value                                                    2.00             2.00            2.00

                                No. Of          %           No. Of         %       No. Of         %
                               Shares     Holding          Shares    Holding      Shares    Holding
                                         Promoter's holding
Indian Promoters             100555118       32.31     100555118       32.32   100555118      32.33
Sub total                    100555118       32.31     100555118       32.32   100555118      32.33
                                     Non promoter's holding
                                         Institutional investors
Banks Fin. Inst. and            96725         0.03         126096       0.04      213055       0.07
No. Of           %           No. Of          %       No. Of         %
                                 Shares      Holding          Shares     Holding      Shares    Holding
Insurance
FII's                          96759079        31.09        96297477        30.95   101277956     32.57
Sub total                      108041689       34.72       107450836        34.53   111644274     35.90
                                              Other investors
Private Corporate
Bodies                         13927138            4.48     15827644         5.09   16183065       5.20
NRI's/OCB's/Foreign
Others                         26714365            8.58     26741575         8.59   26751874       8.60
GDR/ADR                         7125441            2.29      7125441         2.29    7125441       2.29
Others                           149531            0.05     30498595         9.80     327641       0.11
Sub total                      47916475        15.40        80193255        25.77   50388021      16.20
General public                 54693996        17.57        22970499         7.38   48404705      15.56
Grand total                    311207278      100.00       311169708       100.00   310992118    100.00


Capital structure
                                                                                    Paid Up
From     To         Class Of       Authorized         Issued          Paid Up          Face     Paid Up
Year     Year       Share             Capital         Capital     Shares (Nos)        Value      Capital
                    Equity
2010     2011       Share              400.00             62.20     310992118             2       62.20
                    Equity
2009     2010       Share              400.00             61.98     309894521             2       61.98
                    Equity
2008     2009       Share              400.00             50.73     253629769             2       50.73
                    Equity
2007     2008       Share              400.00             50.69     253426989             2       50.69
                    Equity
2006     2007       Share              100.00             36.66     183275378             2       36.66
                    Equity
2005     2006       Share                  50.00          32.05     160225378             2       32.05
                    Equity
2004     2005       Share                  50.00          26.65     133239074             2       26.65
                    Equity
2003     2004       Share                  25.00          16.31         81562555          2       16.31
Ratios
                                            Mar ' 11   Mar ' 10   Mar ' 09   Mar ' 08   Mar ' 07

Per share ratios
Adjusted EPS (Rs)                              18.04       8.03       7.16      14.63       7.67
Adjusted cash EPS (Rs)                         18.34       8.26       7.43      14.87       7.73
Reported EPS (Rs)                              19.57       8.27       6.88      14.71       7.72
Reported cash EPS (Rs)                         19.87       8.51       7.15      14.95       7.79
Dividend per share                             10.00       5.00       2.00       8.50       3.00
Operating profit per share (Rs)                49.03      29.94      47.66      37.69      16.10
Book value (excl rev res) per share (Rs)     133.50     130.83      120.26    115.88       54.35
Book value (incl rev res) per share (Rs.)    133.50     130.83      120.26    115.88       54.35
Net operating income per share (Rs)            65.22      45.85      70.22      52.31      19.22
Free reserves per share (Rs)                 118.78     121.10      110.91    108.03       49.58

Profitability ratios
Operating margin (%)                           75.16      65.30      67.87      72.05      83.77
Gross profit margin (%)                        74.70      64.78      67.49      71.60      83.42
Net profit margin (%)                          29.99      18.58      10.67      28.81      43.41
Adjusted cash margin (%)                       28.10      18.56      11.45      29.11      43.46
Adjusted return on net worth (%)               13.51       6.13       5.95      12.62      14.10
Reported return on net worth (%)               14.66       6.32       5.72      12.69      14.21
Return on long term funds (%)                   8.76      13.00      18.17      13.12      19.30

Leverage ratios
Long term debt / Equity                         3.17       0.74       1.17       1.46       0.53
Total debt/equity                               4.00       1.71       2.14       3.76       1.23
Owners fund as % of total source               20.01      36.85      31.84      20.99      44.78
Fixed assets turnover ratio                    39.25      29.92      40.23      29.97      19.59

Liquidity ratios
Current ratio                                  18.45      10.15      20.32      12.17      13.23
Current ratio (inc.st loans)                    3.13       1.97       2.07       1.73       1.66
Quick ratio                                    18.38      10.11      20.20      12.13      13.18
Inventory turnover ratio                           -          -          -          -          -
Mar ' 11   Mar ' 10   Mar ' 09   Mar ' 08   Mar ' 07

Payout ratios
Dividend payout ratio (net profit)         59.42      71.00      35.54      68.88      46.27
Dividend payout ratio (cash profit)        58.52      69.01      34.20      67.78      45.86
Earning retention ratio                    35.53      26.83      65.84      30.73      53.38
Cash earnings retention ratio              36.58      28.93      67.08      31.85      53.79

Coverage ratios
Adjusted cash flow time total debt         29.08      26.32      31.23      28.24       5.74
Financial charges coverage ratio            1.97       1.74       1.27       2.48       4.59
Fin. charges cov.ratio (post tax)           1.80       1.51       1.21       2.01       3.40

Component ratios
Material cost component (% earnings)           -          -          -          -          -
Selling cost Component                      0.69       0.65       0.41       0.41       0.20
Exports as percent of total sales              -          -          -          -          -
Import comp. in raw mat. consumed              -          -          -          -          -
Long term assets / total Assets             0.16       0.08       0.14       0.02       0.31
Bonus component in equity capital (%)      24.73      24.82      30.33      30.35      41.97

Finance reporting analysis

  • 1.
    TOPIC – FINANCE REPOTING ANALYSIS SUBMITTED TO: SUBIMITTED BY: PROF . U.PADMAVTHI KULDEEP YADAV REG NO- 6024 FINANCE PGDM 2010-12
  • 2.
    Quarterly Results Balance sheet Statement P&L Cash flow Dividend Share holding More Capital structures Ratio (Rscrore) Quarterly results in brief Sep ' 11 Jun ' 11 Mar ' 11 Dec ' 10 Sep ' 10 Sales 712.22 682.35 590.08 568.76 484.39 Operating profit 589.68 555.12 400.49 450.08 375.98 Interest 376.06 341.19 271.78 204.06 166.25 Gross profit 227.33 238.51 137.90 252.67 216.79 EPS (Rs) 5.49 5.64 5.11 5.60 4.76 Quarterly results in details Sep ' 11 Jun ' 11 Mar ' 11 Dec ' 10 Sep ' 10 Other income 13.72 24.59 9.19 6.65 7.06 Stock adjustment - - - - - Raw material - - - - - Power and fuel - - - - - Employee expenses 41.17 35.78 45.06 26.90 28.46 Excise - - - - - Admin and selling expenses - - - - - Research and development expenses - - - - - Expenses capitalised - - - - - Other expenses 81.37 91.46 144.54 91.78 79.95 Provisions made - - - - - Depreciation 1.99 1.96 2.80 2.33 2.10
  • 3.
    Sep ' 11 Jun ' 11 Mar ' 11 Dec ' 10 Sep ' 10 Taxation 54.56 60.96 -23.71 76.36 67.03 Net profit / loss 170.79 175.60 158.80 173.98 147.66 Extra ordinary item - - - - - Prior year adjustments - - - - - Equity capital 62.24 62.23 62.20 62.16 62.07 Equity dividend rate - - - - - Agg.of non-prom. shares (Lacs) 2106.52 2106.15 2104.37 2102.60 2026.61 Agg.ofnon promoteholding (%) 67.69 67.68 67.67 67.65 65.30 OPM (%) 82.79 81.35 67.87 79.13 77.62 GPM (%) 31.32 33.74 23.01 43.91 44.11 NPM (%) 23.53 24.84 26.50 30.24 30.05 Balance sheet Mar ' 11 Mar ' 10 Mar ' 09 Mar ' 08 Mar ' 07 Sources of funds Owner's fund Equity share capital 62.20 61.98 50.73 50.69 36.66 Share application money 0.27 - - - 13.49 Preference share capital - - 156.87 156.87 347.76 Reserves & surplus 4,089.69 3,992.22 2,999.41 2,886.14 959.39 Loan funds Secured loans 14,540.41 3,613.87 4,062.56 3,559.57 150.29 Unsecured loans 2,047.62 3,332.00 2,308.00 7,338.00 730.10 Total 20,740.19 11,000.07 9,577.57 13,991.26 2,237.69 Uses of funds Fixed assets Gross block 67.35 62.87 55.55 52.41 18.30 Less : revaluation reserve - - - - - Less : accumulated depreciation 31.27 22.88 15.70 9.31 1.56
  • 4.
    Mar ' 11 Mar ' 10 Mar ' 09 Mar ' 08 Mar ' 07 Net block 36.07 39.99 39.86 43.10 16.74 Capital work-in-progress 1.56 0.29 1.04 1.81 2.05 Investments 3,465.27 1,002.21 1,373.75 310.61 732.25 Net current assets Current assets, loans & advances 18,225.31 11,046.43 8,585.50 14,856.97 1,608.20 Less : current liabilities & provisions 988.03 1,088.85 422.58 1,221.24 121.55 Total net current assets 17,237.28 9,957.59 8,162.92 13,635.73 1,486.65 Miscellaneous expenses not written - - - - - Total 20,740.19 11,000.07 9,577.57 13,991.26 2,237.69 Notes: Book value of unquoted investments 3,465.27 1,002.21 1,373.75 310.61 732.25 Market value of quoted investments - - - - - Contingent liabilities 3.38 0.10 584.60 543.34 677.46 Number of equity sharesoutstanding (Lacs) 3109.92 3098.95 2536.30 2534.27 1832.75 Profit loss account Mar ' 11 Mar ' 10 Mar ' 09 Mar ' 08 Mar ' 07 Income Operating income 2,028.35 1,420.81 1,780.90 1,325.66 352.18 Expenses Material consumed - - - - - Manufacturing expenses 2.27 3.87 3.86 7.25 - Personnel expenses 131.24 109.50 138.36 208.02 22.00 Selling expenses 14.01 9.33 7.46 5.49 0.72 Administrative expenses 356.17 370.29 422.40 149.64 34.42 Expenses capitalized - - - - - Cost of sales 503.68 492.99 572.08 370.40 57.14
  • 5.
    Mar ' 11 Mar ' 10 Mar ' 09 Mar ' 08 Mar ' 07 Operating profit 1,524.66 927.82 1,208.81 955.26 295.04 Other recurring income 1.08 0.40 0.77 0.06 0.47 Adjusted PBDIT 1,525.75 928.23 1,209.58 955.32 295.51 Financial expenses 773.22 533.88 951.89 384.53 64.41 Depreciation 9.35 7.37 6.81 6.05 1.25 Other write offs - - - - - Adjusted PBT 743.18 386.97 250.88 564.74 229.85 Tax charges 182.18 130.43 53.67 184.85 77.83 Adjusted PAT 560.99 256.54 197.21 379.89 152.02 Non recurring items 18.81 -0.92 -5.83 0.04 1.09 Other non cash adjustments 28.71 -4.63 -1.21 2.04 - Reported net profit 608.51 251.00 190.17 381.97 153.10 Earnings before appropriation 727.06 387.64 271.39 461.77 153.26 Equity dividend 310.68 154.95 50.73 218.21 55.41 Preference dividend - 7.82 15.69 9.11 11.53 Dividend tax 51.05 27.06 11.29 38.63 10.09 Retained earnings 365.34 197.80 193.69 195.82 76.23 Cash flow Mar ' 11 Mar ' 10 Mar ' 09 Mar ' 08 Mar ' 07 Profit before tax 790.87 394.25 246.90 566.86 230.94 Net cash flow-operating activity -5,888.00 -2,914.37 830.27 -4,471.37 -2,102.21 Net cash used in investing activity 797.92 509.41 -360.44 -14.95 -313.01 Net cash used in fin. activity 9,227.52 1,334.73 -4,449.33 10,797.13 2,711.88 Net inc/dec in cash and equivlnt 4,137.44 -1,070.24 -3,979.50 6,310.81 296.65 Cash and equivalent begin of year 289.43 1,359.67 6,940.09 629.28 68.08 Cash and equivalent end of year 4,426.87 289.43 2,960.60 6,940.09 364.73
  • 6.
    Dividend Year Month Dividend (%) 2011 Oct 300 2011 Apr 250 2010 Oct 250 2010 Apr 250 2009 Jun 100 2008 Apr 425 2007 Apr 50 2007 Jan 100 2006 Apr 15 2006 Jan 25 2005 Oct 50 Share holding Share holding pattern as on : 30/09/2011 30/06/2011 31/03/2011 Face value 2.00 2.00 2.00 No. Of % No. Of % No. Of % Shares Holding Shares Holding Shares Holding Promoter's holding Indian Promoters 100555118 32.31 100555118 32.32 100555118 32.33 Sub total 100555118 32.31 100555118 32.32 100555118 32.33 Non promoter's holding Institutional investors Banks Fin. Inst. and 96725 0.03 126096 0.04 213055 0.07
  • 7.
    No. Of % No. Of % No. Of % Shares Holding Shares Holding Shares Holding Insurance FII's 96759079 31.09 96297477 30.95 101277956 32.57 Sub total 108041689 34.72 107450836 34.53 111644274 35.90 Other investors Private Corporate Bodies 13927138 4.48 15827644 5.09 16183065 5.20 NRI's/OCB's/Foreign Others 26714365 8.58 26741575 8.59 26751874 8.60 GDR/ADR 7125441 2.29 7125441 2.29 7125441 2.29 Others 149531 0.05 30498595 9.80 327641 0.11 Sub total 47916475 15.40 80193255 25.77 50388021 16.20 General public 54693996 17.57 22970499 7.38 48404705 15.56 Grand total 311207278 100.00 311169708 100.00 310992118 100.00 Capital structure Paid Up From To Class Of Authorized Issued Paid Up Face Paid Up Year Year Share Capital Capital Shares (Nos) Value Capital Equity 2010 2011 Share 400.00 62.20 310992118 2 62.20 Equity 2009 2010 Share 400.00 61.98 309894521 2 61.98 Equity 2008 2009 Share 400.00 50.73 253629769 2 50.73 Equity 2007 2008 Share 400.00 50.69 253426989 2 50.69 Equity 2006 2007 Share 100.00 36.66 183275378 2 36.66 Equity 2005 2006 Share 50.00 32.05 160225378 2 32.05 Equity 2004 2005 Share 50.00 26.65 133239074 2 26.65 Equity 2003 2004 Share 25.00 16.31 81562555 2 16.31
  • 8.
    Ratios Mar ' 11 Mar ' 10 Mar ' 09 Mar ' 08 Mar ' 07 Per share ratios Adjusted EPS (Rs) 18.04 8.03 7.16 14.63 7.67 Adjusted cash EPS (Rs) 18.34 8.26 7.43 14.87 7.73 Reported EPS (Rs) 19.57 8.27 6.88 14.71 7.72 Reported cash EPS (Rs) 19.87 8.51 7.15 14.95 7.79 Dividend per share 10.00 5.00 2.00 8.50 3.00 Operating profit per share (Rs) 49.03 29.94 47.66 37.69 16.10 Book value (excl rev res) per share (Rs) 133.50 130.83 120.26 115.88 54.35 Book value (incl rev res) per share (Rs.) 133.50 130.83 120.26 115.88 54.35 Net operating income per share (Rs) 65.22 45.85 70.22 52.31 19.22 Free reserves per share (Rs) 118.78 121.10 110.91 108.03 49.58 Profitability ratios Operating margin (%) 75.16 65.30 67.87 72.05 83.77 Gross profit margin (%) 74.70 64.78 67.49 71.60 83.42 Net profit margin (%) 29.99 18.58 10.67 28.81 43.41 Adjusted cash margin (%) 28.10 18.56 11.45 29.11 43.46 Adjusted return on net worth (%) 13.51 6.13 5.95 12.62 14.10 Reported return on net worth (%) 14.66 6.32 5.72 12.69 14.21 Return on long term funds (%) 8.76 13.00 18.17 13.12 19.30 Leverage ratios Long term debt / Equity 3.17 0.74 1.17 1.46 0.53 Total debt/equity 4.00 1.71 2.14 3.76 1.23 Owners fund as % of total source 20.01 36.85 31.84 20.99 44.78 Fixed assets turnover ratio 39.25 29.92 40.23 29.97 19.59 Liquidity ratios Current ratio 18.45 10.15 20.32 12.17 13.23 Current ratio (inc.st loans) 3.13 1.97 2.07 1.73 1.66 Quick ratio 18.38 10.11 20.20 12.13 13.18 Inventory turnover ratio - - - - -
  • 9.
    Mar ' 11 Mar ' 10 Mar ' 09 Mar ' 08 Mar ' 07 Payout ratios Dividend payout ratio (net profit) 59.42 71.00 35.54 68.88 46.27 Dividend payout ratio (cash profit) 58.52 69.01 34.20 67.78 45.86 Earning retention ratio 35.53 26.83 65.84 30.73 53.38 Cash earnings retention ratio 36.58 28.93 67.08 31.85 53.79 Coverage ratios Adjusted cash flow time total debt 29.08 26.32 31.23 28.24 5.74 Financial charges coverage ratio 1.97 1.74 1.27 2.48 4.59 Fin. charges cov.ratio (post tax) 1.80 1.51 1.21 2.01 3.40 Component ratios Material cost component (% earnings) - - - - - Selling cost Component 0.69 0.65 0.41 0.41 0.20 Exports as percent of total sales - - - - - Import comp. in raw mat. consumed - - - - - Long term assets / total Assets 0.16 0.08 0.14 0.02 0.31 Bonus component in equity capital (%) 24.73 24.82 30.33 30.35 41.97