SlideShare a Scribd company logo
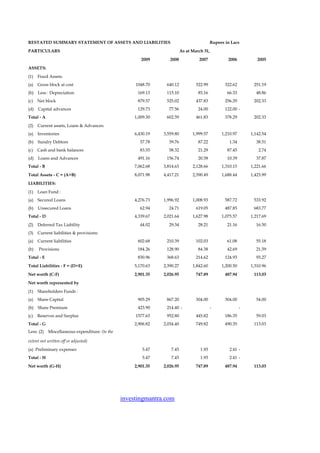
RESTATED SUMMARY STATEMENT OF ASSETS AND LIABILITIES                                         Rupees in Lacs
PARTICULARS                                                                 As at March 31,
                                                         2009       2008             2007            2006           2005
ASSETS:
(1)   Fixed Assets:
(a)   Gross block at cost                             1048.70     640.12            522.99          322.62        251.19
(b)   Less : Depreciation                              169.13     115.10             85.16           66.33         48.86
(c)   Net block                                        879.57     525.02            437.83          256.29        202.33
(d)   Capital advances                                 129.73      77.56             24.00          122.00 -
Total - A                                             1,009.30    602.59            461.83          378.29        202.33
(2)   Current assets, Loans & Advances:
(a)   Inventories                                     6,430.19   3,559.80         1,999.57        1,210.97       1,142.54
(b)   Sundry Debtors                                    57.78      39.76             87.22            1.34         38.51
(c)   Cash and bank balances                            83.55      58.32             21.29           87.45           2.74
(d)   Loans and Advances                               491.16     156.74             20.58           10.39         37.87
Total - B                                             7,062.68   3,814.63         2,128.66        1,310.15       1,221.66
Total Assets - C = (A+B)                              8,071.98   4,417.21         2,590.49        1,688.44       1,423.99
LIABILITIES:
(1)   Loan Fund :
(a)   Secured Loans                                   4,276.73   1,996.92         1,008.93          587.72        533.92
(b)   Unsecured Loans                                   62.94      24.71            619.05          487.85        683.77
Total - D                                             4,339.67   2,021.64         1,627.98        1,075.57       1,217.69
(2)   Deferred Tax Liability                            44.02      29.34             28.21           21.16         16.50
(3)   Current liabilities & provisions:
(a)   Current liabilities                              602.68     210.39            102.03           61.08         55.18
(b)   Provisions                                       184.26     128.90             84.38           42.69         21.59
Total - E                                              830.96     368.63            214.62          124.93         93.27
Total Liabilities - F = (D+E)                         5,170.63   2,390.27         1,842.60        1,200.50       1,310.96
Net worth (C-F)                                       2,901.35   2,026.95           747.89          487.94        113.03
Net worth represented by
(1)   Shareholders Funds :
(a)   Share Capital                                    905.29     867.20            304.00          304.00         54.00
(b)   Share Premium                                    423.90     214.40 -                   -               -
(c)   Reserves and Surplus                            1577.63     952.80            445.82          186.35         59.03
Total - G                                             2,906.82   2,034.40           749.82          490.35        113.03
Less: (2)   Miscellaneous expenditure: (to the

extent not written off or adjusted)
(a) Preliminary expenses                                  5.47       7.45             1.93            2.41 -
Total - H                                                 5.47       7.45             1.93            2.41 -
Net worth (G-H)                                       2,901.35   2,026.95           747.89          487.94        113.03


                                                 investingmantra.com
RESTATED SUMMARY STATEMNTS OF PROFIT AND LOSS ACCOUNT
                                                                                            Rupees in Lacs
PARTICULARS                                                           Year ended March 31,
                                                    2009            2008            2007            2006           2005
I.    INCOME
Sales and Operating Income                      24,683.84       22,449.99       12,715.67        4,923.79       2,685.97
Other Income                                         1.72          10.12             6.70            0.91           7.92
TOTAL INCOME                                    24,685.56       22,460.11       12,722.37        4,924.70       2,693.89
II. EXPENDITURE
(a)   Cost of Sales                             22,063.57       20,822.72       11,760.19        4,378.22       2,298.95
(b)   Personnel Expenses                          297.92          166.72           83.17            60.39         28.28
(c)   Administration Expenses                     234.79          100.90           55.91            45.32         50.92
(d)   Selling Expenses                            420.85          289.29          177.63            88.08         90.95
TOTAL EXPENDITURE                               23,017.13       21,379.63       12,076.89        4,572.01       2,469.10
III. NET PROFIT BEFORE INTEREST,                 1,668.43        1,080.48         645.48           352.69        224.79
DEPRECIATION AND TAXATION
Less :Interest & Finance Charges                  460.49          197.34          151.76           122.16        153.88
IV. NET PROFIT BEFORE                            1,207.94         883.14          493.72           230.53         70.90
DEPRECIATION AND TAXATION
Less: Depreciation                                 62.23           29.94           20.82            17.47         15.80
V. NET PROFIT BEFORE TAXATION                    1,145.71         853.20          472.90           213.06         55.10
Less: Provision for Taxation:
- Current Tax                                     378.17          288.90          160.00            62.33         15.15
- Deferred Tax                                     14.68             1.13            1.91            4.66           5.50
- Fringe Benefit Tax                                 3.59            2.03            1.09 -                 -
                                                  396.44          292.06          163.00            66.99         20.65
VI. NET PROFIT AFTER TAXATION                     749.27          561.14          309.90           146.07         34.45
Add / Less : prior period items                   (18.54)          (3.42)         (14.88)          (1.50)           6.02
Add : Profit/Loss Brought forward                 915.85          408.86          169.41            59.03         24.62
VII. PROFIT AVAILABLE FOR                        1,646.58         966.58          464.43           203.60         65.09
APPROPRIATION
VIII. APPROPRIATION
Proposed Dividend on Equity Shares                 90.53 -                         30.40            15.13           5.40
Interim Dividend on Equity Shares           -                      43.36 -                  -               -
Corporate Tax on Dividend                          15.38             7.37            5.17            2.12           0.66
Transfer to Debenture Redemption Reserve    -               -                      20.00            16.94 -
Transfer to General Reserve                       150.00 -                  -               -               -
BALANCE CARRIED TO BALANCE SHEET                 1,390.67         915.85          408.86           169.41         59.03
TOTAL                                            1,646.58         966.58          464.43           203.60         65.09


                                           investingmantra.com
RESTATED SUMMARY STATEMENT OF CASH FLOWS
                                                                                               Rupees in Lacs
PARTICULARS                                                                Year ended March 31,
                                                            2009          2008         2007            2006         2005
Cash Flow from Operating Activities

Net Profit before tax                                   1,145.71        853.20       472.90           213.06       55.10
Add/(Less) Adjustments
Depreciation                                               62.23         29.94        20.82            17.47       15.80
Interest and Finance Charges                              460.49        197.34       151.76           122.16      153.88
Loss on Sale of fixed Assets                                6.52 -                    (0.81) -                     (0.90)
Preliminary Expenditure                                     1.98         (5.52)        0.48           (2.41) -
Operating Profit before WC Changes                      1,676.93      1,074.96       645.15           350.28      223.88
Adjustments for:

Inventories                                             2,870.39      1,560.23       788.60            68.43      340.42
Sundry Debtors                                             18.02        (47.46)       85.88          (37.17)      (37.42)
Loans & Advances                                          334.42        136.16        10.19          (27.48)       14.10
Current Liabilities                                     (392.29)      (108.36)       (40.95)          (5.90)      259.17
Total Adjustments                                      (2,830.54)    (1,540.57)     (843.72)            2.12     (576.27)
Cash Generated from Operations                         (1,153.60)     (465.62)      (198.57)          352.40     (352.39)
Taxes Paid

Payment of Direct Taxes                                   432.31        210.84       137.72            52.42        5.69
Adjustments in respect of prior years                      18.54          3.42         9.72             1.50       (6.02)

Net Cash flow from Operating Activities - (A)          (1,604.45)     (679.88)      (346.02)          298.48     (352.06)
Cash Flow from Investing Activities

Purchase of Fixed assets                                  480.08        170.69       105.89           193.43        9.54
Proceeds from Sales of Fixed Assets                         4.62 -                     2.34 -                       3.48
Net Cash used in Investing Activities - (B)             (475.46)      (170.69)      (103.55)        (193.43)       (6.06)
Cash Flow from Financing Activities

Proceeds from Issue of Share Capital                      247.59        777.60 -                      250.00 -
Proceeds from Long Term Loan                               84.80      (594.34)       131.20         (195.92)       73.67
Proceeds from Short Term Loan                           2,233.24        987.99       421.21            53.80      342.16
Dividend Paid (including Corporate Dividend
Tax)                                               -                     86.30        17.25             6.06 -
Interest and Finance Charges paid                         460.49        197.34       151.76           122.16      153.88
Net Cash flow from Financing Activities - (C)           2,105.13        887.61       383.40          (20.34)      261.95
Net Increase / (Decrease) in Cash & Cash
equivalents                                                25.23         37.04       (66.16)           84.71      (96.17)
- (A+B+C)
Cash & Cash Equivalents at the beginning of the
year                                                       58.33         21.29        87.45             2.74       98.91


Cash & Cash Equivalents at the end of the year             83.56         58.33        21.29            87.45        2.74


                                                  investingmantra.com

More Related Content

What's hot

conoco phillips 2008Fourth Quarter
conoco phillips 2008Fourth Quarterconoco phillips 2008Fourth Quarter
conoco phillips 2008Fourth Quarterfinance1
 
conoco phillips 2008Third Quarter
conoco phillips 2008Third Quarterconoco phillips 2008Third Quarter
conoco phillips 2008Third Quarterfinance1
 
allstate Financial Section 2001
allstate Financial Section 2001allstate Financial Section 2001
allstate Financial Section 2001finance7
 
conoco phillips 2008 First Quarter
conoco phillips 2008 First Quarterconoco phillips 2008 First Quarter
conoco phillips 2008 First Quarterfinance1
 
Reconciliations and Financial Slides from Safeway Investor Conference
	Reconciliations and Financial Slides from Safeway Investor Conference	Reconciliations and Financial Slides from Safeway Investor Conference
Reconciliations and Financial Slides from Safeway Investor Conferencefinance6
 
credit-suisse Credit Suisse Group Interim Report 2000
credit-suisse Credit Suisse Group Interim Report 2000credit-suisse Credit Suisse Group Interim Report 2000
credit-suisse Credit Suisse Group Interim Report 2000QuarterlyEarningsReports2
 
Progressive 2006review
 Progressive 2006review Progressive 2006review
Progressive 2006reviewfinance18
 
Progressive f_2005review
Progressive f_2005reviewProgressive f_2005review
Progressive f_2005reviewfinance18
 
Progressive_ 2004 review
Progressive_ 2004 reviewProgressive_ 2004 review
Progressive_ 2004 reviewfinance18
 
lemark international lxk_2006ar
lemark international lxk_2006arlemark international lxk_2006ar
lemark international lxk_2006arfinance47
 
chubb 8921 Supplementary Investor Information
chubb 8921 Supplementary Investor Informationchubb 8921 Supplementary Investor Information
chubb 8921 Supplementary Investor Informationfinance18
 
fredie mac financial-statement
fredie mac financial-statementfredie mac financial-statement
fredie mac financial-statementfinance6
 

What's hot (16)

conoco phillips 2008Fourth Quarter
conoco phillips 2008Fourth Quarterconoco phillips 2008Fourth Quarter
conoco phillips 2008Fourth Quarter
 
conoco phillips 2008Third Quarter
conoco phillips 2008Third Quarterconoco phillips 2008Third Quarter
conoco phillips 2008Third Quarter
 
allstate Financial Section 2001
allstate Financial Section 2001allstate Financial Section 2001
allstate Financial Section 2001
 
conoco phillips 2008 First Quarter
conoco phillips 2008 First Quarterconoco phillips 2008 First Quarter
conoco phillips 2008 First Quarter
 
Reconciliations and Financial Slides from Safeway Investor Conference
	Reconciliations and Financial Slides from Safeway Investor Conference	Reconciliations and Financial Slides from Safeway Investor Conference
Reconciliations and Financial Slides from Safeway Investor Conference
 
credit-suisse Credit Suisse Group Interim Report 2000
credit-suisse Credit Suisse Group Interim Report 2000credit-suisse Credit Suisse Group Interim Report 2000
credit-suisse Credit Suisse Group Interim Report 2000
 
Balance sheet
Balance sheetBalance sheet
Balance sheet
 
Progressive 2006review
 Progressive 2006review Progressive 2006review
Progressive 2006review
 
Progressive f_2005review
Progressive f_2005reviewProgressive f_2005review
Progressive f_2005review
 
Progressive_ 2004 review
Progressive_ 2004 reviewProgressive_ 2004 review
Progressive_ 2004 review
 
lemark international lxk_2006ar
lemark international lxk_2006arlemark international lxk_2006ar
lemark international lxk_2006ar
 
CMC q4 fy08
CMC q4 fy08CMC q4 fy08
CMC q4 fy08
 
chubb 8921 Supplementary Investor Information
chubb 8921 Supplementary Investor Informationchubb 8921 Supplementary Investor Information
chubb 8921 Supplementary Investor Information
 
fredie mac financial-statement
fredie mac financial-statementfredie mac financial-statement
fredie mac financial-statement
 
fr05_scf
fr05_scffr05_scf
fr05_scf
 
ccc_1997AR
ccc_1997ARccc_1997AR
ccc_1997AR
 

Similar to Thangamayil Jwellery

MBL Infrastructure IPO
MBL Infrastructure IPOMBL Infrastructure IPO
MBL Infrastructure IPOKunal
 
Jsw Ipo
Jsw IpoJsw Ipo
Jsw Ipo
Kunal
 
Oil India Ipo
Oil India IpoOil India Ipo
Oil India Ipo
Kunal
 
Jubilant Foods Ipo
Jubilant Foods IpoJubilant Foods Ipo
Jubilant Foods IpoKunal
 
Tata steel Q3 2008 financial results
Tata steel Q3 2008 financial resultsTata steel Q3 2008 financial results
Tata steel Q3 2008 financial results
earningsreport
 
Eastboro case analysis
Eastboro case analysisEastboro case analysis
Eastboro case analysisFajar Muhammad
 
Withholding tax response 2011
Withholding tax response 2011Withholding tax response 2011
Withholding tax response 2011Mohammad Azam
 
J J FOAM MODERANISATION
J J FOAM MODERANISATIONJ J FOAM MODERANISATION
J J FOAM MODERANISATIONPawan Gupta
 
Ekit State Financial Report for the year 2012
Ekit State Financial Report for the year 2012Ekit State Financial Report for the year 2012
Ekit State Financial Report for the year 2012
Government of Ekiti State, Nigeria
 
reliance steel & aluminum 2005_Annual_Report
reliance steel & aluminum  2005_Annual_Reportreliance steel & aluminum  2005_Annual_Report
reliance steel & aluminum 2005_Annual_Reportfinance32
 
Overall of 2012
Overall of 2012Overall of 2012
PEABODY ENERGY BTUQuarterlyData-website
PEABODY ENERGY BTUQuarterlyData-websitePEABODY ENERGY BTUQuarterlyData-website
PEABODY ENERGY BTUQuarterlyData-websitefinance37
 
Profit Loss Account Of Tata Motors
Profit Loss Account Of Tata MotorsProfit Loss Account Of Tata Motors
Profit Loss Account Of Tata Motorspurval
 
financial statement analysis of Idea Cellular
financial statement analysis of Idea Cellularfinancial statement analysis of Idea Cellular
financial statement analysis of Idea CellularDeepak Srivastva
 

Similar to Thangamayil Jwellery (20)

MBL Infrastructure IPO
MBL Infrastructure IPOMBL Infrastructure IPO
MBL Infrastructure IPO
 
Jsw Ipo
Jsw IpoJsw Ipo
Jsw Ipo
 
Oil India Ipo
Oil India IpoOil India Ipo
Oil India Ipo
 
Jubilant Foods Ipo
Jubilant Foods IpoJubilant Foods Ipo
Jubilant Foods Ipo
 
Credit Analysis of HCC Excel
Credit Analysis of HCC ExcelCredit Analysis of HCC Excel
Credit Analysis of HCC Excel
 
SSS Annual Report 2009
SSS Annual Report 2009SSS Annual Report 2009
SSS Annual Report 2009
 
Tata steel Q3 2008 financial results
Tata steel Q3 2008 financial resultsTata steel Q3 2008 financial results
Tata steel Q3 2008 financial results
 
Pantaloon 2008 2009
Pantaloon 2008 2009Pantaloon 2008 2009
Pantaloon 2008 2009
 
CMC q3 fy08
CMC q3 fy08CMC q3 fy08
CMC q3 fy08
 
Eastboro case analysis
Eastboro case analysisEastboro case analysis
Eastboro case analysis
 
Withholding tax response 2011
Withholding tax response 2011Withholding tax response 2011
Withholding tax response 2011
 
J J FOAM MODERANISATION
J J FOAM MODERANISATIONJ J FOAM MODERANISATION
J J FOAM MODERANISATION
 
Cipla 20-09-2010
Cipla   20-09-2010Cipla   20-09-2010
Cipla 20-09-2010
 
Ekit State Financial Report for the year 2012
Ekit State Financial Report for the year 2012Ekit State Financial Report for the year 2012
Ekit State Financial Report for the year 2012
 
reliance steel & aluminum 2005_Annual_Report
reliance steel & aluminum  2005_Annual_Reportreliance steel & aluminum  2005_Annual_Report
reliance steel & aluminum 2005_Annual_Report
 
Overall of 2012
Overall of 2012Overall of 2012
Overall of 2012
 
PEABODY ENERGY BTUQuarterlyData-website
PEABODY ENERGY BTUQuarterlyData-websitePEABODY ENERGY BTUQuarterlyData-website
PEABODY ENERGY BTUQuarterlyData-website
 
Profit Loss Account Of Tata Motors
Profit Loss Account Of Tata MotorsProfit Loss Account Of Tata Motors
Profit Loss Account Of Tata Motors
 
financial statement analysis of Idea Cellular
financial statement analysis of Idea Cellularfinancial statement analysis of Idea Cellular
financial statement analysis of Idea Cellular
 
Atp Oil
Atp OilAtp Oil
Atp Oil
 

Recently uploaded

when will pi network coin be available on crypto exchange.
when will pi network coin be available on crypto exchange.when will pi network coin be available on crypto exchange.
when will pi network coin be available on crypto exchange.
DOT TECH
 
Scope Of Macroeconomics introduction and basic theories
Scope Of Macroeconomics introduction and basic theoriesScope Of Macroeconomics introduction and basic theories
Scope Of Macroeconomics introduction and basic theories
nomankalyar153
 
how can I sell pi coins after successfully completing KYC
how can I sell pi coins after successfully completing KYChow can I sell pi coins after successfully completing KYC
how can I sell pi coins after successfully completing KYC
DOT TECH
 
The WhatsPump Pseudonym Problem and the Hilarious Downfall of Artificial Enga...
The WhatsPump Pseudonym Problem and the Hilarious Downfall of Artificial Enga...The WhatsPump Pseudonym Problem and the Hilarious Downfall of Artificial Enga...
The WhatsPump Pseudonym Problem and the Hilarious Downfall of Artificial Enga...
muslimdavidovich670
 
What price will pi network be listed on exchanges
What price will pi network be listed on exchangesWhat price will pi network be listed on exchanges
What price will pi network be listed on exchanges
DOT TECH
 
The secret way to sell pi coins effortlessly.
The secret way to sell pi coins effortlessly.The secret way to sell pi coins effortlessly.
The secret way to sell pi coins effortlessly.
DOT TECH
 
Analyzing the instability of equilibrium in thr harrod domar model
Analyzing the instability of equilibrium in thr harrod domar modelAnalyzing the instability of equilibrium in thr harrod domar model
Analyzing the instability of equilibrium in thr harrod domar model
ManthanBhardwaj4
 
What website can I sell pi coins securely.
What website can I sell pi coins securely.What website can I sell pi coins securely.
What website can I sell pi coins securely.
DOT TECH
 
一比一原版(IC毕业证)帝国理工大学毕业证如何办理
一比一原版(IC毕业证)帝国理工大学毕业证如何办理一比一原版(IC毕业证)帝国理工大学毕业证如何办理
一比一原版(IC毕业证)帝国理工大学毕业证如何办理
conose1
 
can I really make money with pi network.
can I really make money with pi network.can I really make money with pi network.
can I really make money with pi network.
DOT TECH
 
PF-Wagner's Theory of Public Expenditure.pptx
PF-Wagner's Theory of Public Expenditure.pptxPF-Wagner's Theory of Public Expenditure.pptx
PF-Wagner's Theory of Public Expenditure.pptx
GunjanSharma28848
 
Instant Issue Debit Cards
Instant Issue Debit CardsInstant Issue Debit Cards
Instant Issue Debit Cards
egoetzinger
 
what is a pi whale and how to access one.
what is a pi whale and how to access one.what is a pi whale and how to access one.
what is a pi whale and how to access one.
DOT TECH
 
how to sell pi coins on Binance exchange
how to sell pi coins on Binance exchangehow to sell pi coins on Binance exchange
how to sell pi coins on Binance exchange
DOT TECH
 
Webinar Exploring DORA for Fintechs - Simont Braun
Webinar Exploring DORA for Fintechs - Simont BraunWebinar Exploring DORA for Fintechs - Simont Braun
Webinar Exploring DORA for Fintechs - Simont Braun
FinTech Belgium
 
Commercial Bank Economic Capsule - May 2024
Commercial Bank Economic Capsule - May 2024Commercial Bank Economic Capsule - May 2024
Commercial Bank Economic Capsule - May 2024
Commercial Bank of Ceylon PLC
 
innovative-invoice-discounting-platforms-in-india-empowering-retail-investors...
innovative-invoice-discounting-platforms-in-india-empowering-retail-investors...innovative-invoice-discounting-platforms-in-india-empowering-retail-investors...
innovative-invoice-discounting-platforms-in-india-empowering-retail-investors...
Falcon Invoice Discounting
 
一比一原版(GWU,GW毕业证)加利福尼亚大学|尔湾分校毕业证如何办理
一比一原版(GWU,GW毕业证)加利福尼亚大学|尔湾分校毕业证如何办理一比一原版(GWU,GW毕业证)加利福尼亚大学|尔湾分校毕业证如何办理
一比一原版(GWU,GW毕业证)加利福尼亚大学|尔湾分校毕业证如何办理
obyzuk
 
Transkredit Finance Company Products Presentation (1).pptx
Transkredit Finance Company Products Presentation (1).pptxTranskredit Finance Company Products Presentation (1).pptx
Transkredit Finance Company Products Presentation (1).pptx
jenomjaneh
 
Instant Issue Debit Cards - High School Spirit
Instant Issue Debit Cards - High School SpiritInstant Issue Debit Cards - High School Spirit
Instant Issue Debit Cards - High School Spirit
egoetzinger
 

Recently uploaded (20)

when will pi network coin be available on crypto exchange.
when will pi network coin be available on crypto exchange.when will pi network coin be available on crypto exchange.
when will pi network coin be available on crypto exchange.
 
Scope Of Macroeconomics introduction and basic theories
Scope Of Macroeconomics introduction and basic theoriesScope Of Macroeconomics introduction and basic theories
Scope Of Macroeconomics introduction and basic theories
 
how can I sell pi coins after successfully completing KYC
how can I sell pi coins after successfully completing KYChow can I sell pi coins after successfully completing KYC
how can I sell pi coins after successfully completing KYC
 
The WhatsPump Pseudonym Problem and the Hilarious Downfall of Artificial Enga...
The WhatsPump Pseudonym Problem and the Hilarious Downfall of Artificial Enga...The WhatsPump Pseudonym Problem and the Hilarious Downfall of Artificial Enga...
The WhatsPump Pseudonym Problem and the Hilarious Downfall of Artificial Enga...
 
What price will pi network be listed on exchanges
What price will pi network be listed on exchangesWhat price will pi network be listed on exchanges
What price will pi network be listed on exchanges
 
The secret way to sell pi coins effortlessly.
The secret way to sell pi coins effortlessly.The secret way to sell pi coins effortlessly.
The secret way to sell pi coins effortlessly.
 
Analyzing the instability of equilibrium in thr harrod domar model
Analyzing the instability of equilibrium in thr harrod domar modelAnalyzing the instability of equilibrium in thr harrod domar model
Analyzing the instability of equilibrium in thr harrod domar model
 
What website can I sell pi coins securely.
What website can I sell pi coins securely.What website can I sell pi coins securely.
What website can I sell pi coins securely.
 
一比一原版(IC毕业证)帝国理工大学毕业证如何办理
一比一原版(IC毕业证)帝国理工大学毕业证如何办理一比一原版(IC毕业证)帝国理工大学毕业证如何办理
一比一原版(IC毕业证)帝国理工大学毕业证如何办理
 
can I really make money with pi network.
can I really make money with pi network.can I really make money with pi network.
can I really make money with pi network.
 
PF-Wagner's Theory of Public Expenditure.pptx
PF-Wagner's Theory of Public Expenditure.pptxPF-Wagner's Theory of Public Expenditure.pptx
PF-Wagner's Theory of Public Expenditure.pptx
 
Instant Issue Debit Cards
Instant Issue Debit CardsInstant Issue Debit Cards
Instant Issue Debit Cards
 
what is a pi whale and how to access one.
what is a pi whale and how to access one.what is a pi whale and how to access one.
what is a pi whale and how to access one.
 
how to sell pi coins on Binance exchange
how to sell pi coins on Binance exchangehow to sell pi coins on Binance exchange
how to sell pi coins on Binance exchange
 
Webinar Exploring DORA for Fintechs - Simont Braun
Webinar Exploring DORA for Fintechs - Simont BraunWebinar Exploring DORA for Fintechs - Simont Braun
Webinar Exploring DORA for Fintechs - Simont Braun
 
Commercial Bank Economic Capsule - May 2024
Commercial Bank Economic Capsule - May 2024Commercial Bank Economic Capsule - May 2024
Commercial Bank Economic Capsule - May 2024
 
innovative-invoice-discounting-platforms-in-india-empowering-retail-investors...
innovative-invoice-discounting-platforms-in-india-empowering-retail-investors...innovative-invoice-discounting-platforms-in-india-empowering-retail-investors...
innovative-invoice-discounting-platforms-in-india-empowering-retail-investors...
 
一比一原版(GWU,GW毕业证)加利福尼亚大学|尔湾分校毕业证如何办理
一比一原版(GWU,GW毕业证)加利福尼亚大学|尔湾分校毕业证如何办理一比一原版(GWU,GW毕业证)加利福尼亚大学|尔湾分校毕业证如何办理
一比一原版(GWU,GW毕业证)加利福尼亚大学|尔湾分校毕业证如何办理
 
Transkredit Finance Company Products Presentation (1).pptx
Transkredit Finance Company Products Presentation (1).pptxTranskredit Finance Company Products Presentation (1).pptx
Transkredit Finance Company Products Presentation (1).pptx
 
Instant Issue Debit Cards - High School Spirit
Instant Issue Debit Cards - High School SpiritInstant Issue Debit Cards - High School Spirit
Instant Issue Debit Cards - High School Spirit
 

Thangamayil Jwellery

  • 1. RESTATED SUMMARY STATEMENT OF ASSETS AND LIABILITIES Rupees in Lacs PARTICULARS As at March 31, 2009 2008 2007 2006 2005 ASSETS: (1) Fixed Assets: (a) Gross block at cost 1048.70 640.12 522.99 322.62 251.19 (b) Less : Depreciation 169.13 115.10 85.16 66.33 48.86 (c) Net block 879.57 525.02 437.83 256.29 202.33 (d) Capital advances 129.73 77.56 24.00 122.00 - Total - A 1,009.30 602.59 461.83 378.29 202.33 (2) Current assets, Loans & Advances: (a) Inventories 6,430.19 3,559.80 1,999.57 1,210.97 1,142.54 (b) Sundry Debtors 57.78 39.76 87.22 1.34 38.51 (c) Cash and bank balances 83.55 58.32 21.29 87.45 2.74 (d) Loans and Advances 491.16 156.74 20.58 10.39 37.87 Total - B 7,062.68 3,814.63 2,128.66 1,310.15 1,221.66 Total Assets - C = (A+B) 8,071.98 4,417.21 2,590.49 1,688.44 1,423.99 LIABILITIES: (1) Loan Fund : (a) Secured Loans 4,276.73 1,996.92 1,008.93 587.72 533.92 (b) Unsecured Loans 62.94 24.71 619.05 487.85 683.77 Total - D 4,339.67 2,021.64 1,627.98 1,075.57 1,217.69 (2) Deferred Tax Liability 44.02 29.34 28.21 21.16 16.50 (3) Current liabilities & provisions: (a) Current liabilities 602.68 210.39 102.03 61.08 55.18 (b) Provisions 184.26 128.90 84.38 42.69 21.59 Total - E 830.96 368.63 214.62 124.93 93.27 Total Liabilities - F = (D+E) 5,170.63 2,390.27 1,842.60 1,200.50 1,310.96 Net worth (C-F) 2,901.35 2,026.95 747.89 487.94 113.03 Net worth represented by (1) Shareholders Funds : (a) Share Capital 905.29 867.20 304.00 304.00 54.00 (b) Share Premium 423.90 214.40 - - - (c) Reserves and Surplus 1577.63 952.80 445.82 186.35 59.03 Total - G 2,906.82 2,034.40 749.82 490.35 113.03 Less: (2) Miscellaneous expenditure: (to the extent not written off or adjusted) (a) Preliminary expenses 5.47 7.45 1.93 2.41 - Total - H 5.47 7.45 1.93 2.41 - Net worth (G-H) 2,901.35 2,026.95 747.89 487.94 113.03 investingmantra.com
  • 2. RESTATED SUMMARY STATEMNTS OF PROFIT AND LOSS ACCOUNT Rupees in Lacs PARTICULARS Year ended March 31, 2009 2008 2007 2006 2005 I. INCOME Sales and Operating Income 24,683.84 22,449.99 12,715.67 4,923.79 2,685.97 Other Income 1.72 10.12 6.70 0.91 7.92 TOTAL INCOME 24,685.56 22,460.11 12,722.37 4,924.70 2,693.89 II. EXPENDITURE (a) Cost of Sales 22,063.57 20,822.72 11,760.19 4,378.22 2,298.95 (b) Personnel Expenses 297.92 166.72 83.17 60.39 28.28 (c) Administration Expenses 234.79 100.90 55.91 45.32 50.92 (d) Selling Expenses 420.85 289.29 177.63 88.08 90.95 TOTAL EXPENDITURE 23,017.13 21,379.63 12,076.89 4,572.01 2,469.10 III. NET PROFIT BEFORE INTEREST, 1,668.43 1,080.48 645.48 352.69 224.79 DEPRECIATION AND TAXATION Less :Interest & Finance Charges 460.49 197.34 151.76 122.16 153.88 IV. NET PROFIT BEFORE 1,207.94 883.14 493.72 230.53 70.90 DEPRECIATION AND TAXATION Less: Depreciation 62.23 29.94 20.82 17.47 15.80 V. NET PROFIT BEFORE TAXATION 1,145.71 853.20 472.90 213.06 55.10 Less: Provision for Taxation: - Current Tax 378.17 288.90 160.00 62.33 15.15 - Deferred Tax 14.68 1.13 1.91 4.66 5.50 - Fringe Benefit Tax 3.59 2.03 1.09 - - 396.44 292.06 163.00 66.99 20.65 VI. NET PROFIT AFTER TAXATION 749.27 561.14 309.90 146.07 34.45 Add / Less : prior period items (18.54) (3.42) (14.88) (1.50) 6.02 Add : Profit/Loss Brought forward 915.85 408.86 169.41 59.03 24.62 VII. PROFIT AVAILABLE FOR 1,646.58 966.58 464.43 203.60 65.09 APPROPRIATION VIII. APPROPRIATION Proposed Dividend on Equity Shares 90.53 - 30.40 15.13 5.40 Interim Dividend on Equity Shares - 43.36 - - - Corporate Tax on Dividend 15.38 7.37 5.17 2.12 0.66 Transfer to Debenture Redemption Reserve - - 20.00 16.94 - Transfer to General Reserve 150.00 - - - - BALANCE CARRIED TO BALANCE SHEET 1,390.67 915.85 408.86 169.41 59.03 TOTAL 1,646.58 966.58 464.43 203.60 65.09 investingmantra.com
  • 3. RESTATED SUMMARY STATEMENT OF CASH FLOWS Rupees in Lacs PARTICULARS Year ended March 31, 2009 2008 2007 2006 2005 Cash Flow from Operating Activities Net Profit before tax 1,145.71 853.20 472.90 213.06 55.10 Add/(Less) Adjustments Depreciation 62.23 29.94 20.82 17.47 15.80 Interest and Finance Charges 460.49 197.34 151.76 122.16 153.88 Loss on Sale of fixed Assets 6.52 - (0.81) - (0.90) Preliminary Expenditure 1.98 (5.52) 0.48 (2.41) - Operating Profit before WC Changes 1,676.93 1,074.96 645.15 350.28 223.88 Adjustments for: Inventories 2,870.39 1,560.23 788.60 68.43 340.42 Sundry Debtors 18.02 (47.46) 85.88 (37.17) (37.42) Loans & Advances 334.42 136.16 10.19 (27.48) 14.10 Current Liabilities (392.29) (108.36) (40.95) (5.90) 259.17 Total Adjustments (2,830.54) (1,540.57) (843.72) 2.12 (576.27) Cash Generated from Operations (1,153.60) (465.62) (198.57) 352.40 (352.39) Taxes Paid Payment of Direct Taxes 432.31 210.84 137.72 52.42 5.69 Adjustments in respect of prior years 18.54 3.42 9.72 1.50 (6.02) Net Cash flow from Operating Activities - (A) (1,604.45) (679.88) (346.02) 298.48 (352.06) Cash Flow from Investing Activities Purchase of Fixed assets 480.08 170.69 105.89 193.43 9.54 Proceeds from Sales of Fixed Assets 4.62 - 2.34 - 3.48 Net Cash used in Investing Activities - (B) (475.46) (170.69) (103.55) (193.43) (6.06) Cash Flow from Financing Activities Proceeds from Issue of Share Capital 247.59 777.60 - 250.00 - Proceeds from Long Term Loan 84.80 (594.34) 131.20 (195.92) 73.67 Proceeds from Short Term Loan 2,233.24 987.99 421.21 53.80 342.16 Dividend Paid (including Corporate Dividend Tax) - 86.30 17.25 6.06 - Interest and Finance Charges paid 460.49 197.34 151.76 122.16 153.88 Net Cash flow from Financing Activities - (C) 2,105.13 887.61 383.40 (20.34) 261.95 Net Increase / (Decrease) in Cash & Cash equivalents 25.23 37.04 (66.16) 84.71 (96.17) - (A+B+C) Cash & Cash Equivalents at the beginning of the year 58.33 21.29 87.45 2.74 98.91 Cash & Cash Equivalents at the end of the year 83.56 58.33 21.29 87.45 2.74 investingmantra.com