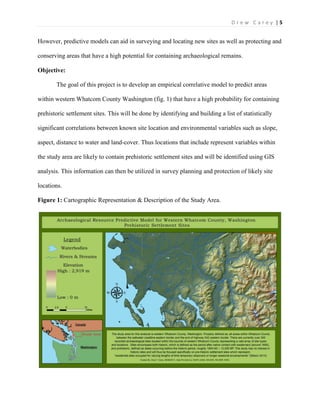
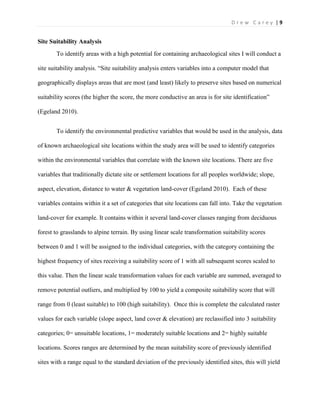
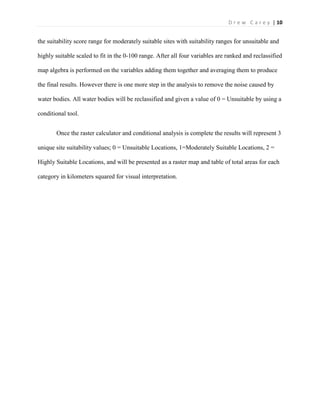
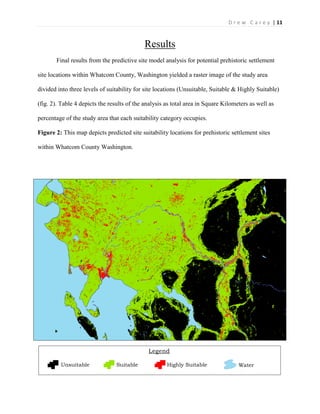
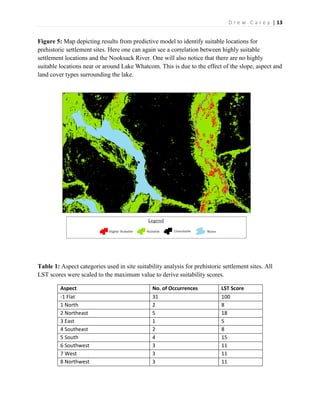
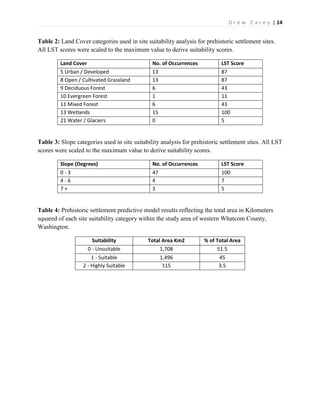
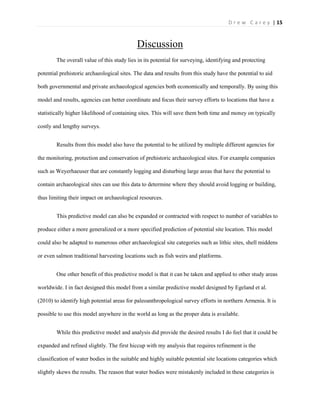
SlideShare a Scribd company logo
1 of 18
Download to read offline
| 1D r e w C a r e y
Predictive Modeling for Prehistoric Archaeological Sites within Western
Whatcom County, Washington Using GIS
By: Drew Carey
For: ENVS 422 Advanced GIS
June 6, 2013
| 2D r e w C a r e y
Background
Abstract:
Washington State has thousands of recorded archaeological sites within its borders.
Those sites in addition to an average of 20 plus new sites being discovered per county each year
make it increasingly important to identify and preserve as many of these sites as possible for the
archaeological record. It is the goal of this study to create an inductive predictive model using
geographic information systems (GIS) to aid in locating potential prehistoric settlement site areas
within western Whatcom County Washington. An inductive predictive model uses known site
locations to infer relationships between sites and environmental variables, such as; distance to
water, slope, aspect and vegetated land cover to identify areas that have a high probability of
containing archaeological sites, based on the correlating variables.
Background Information:
Humans have always been closely tied to their environments, constantly moving and
adapting to climates that best suit their subsistence and survival. Ever since the ice sheets began
to clear from the North American continent over 25,000 years ago mankind began to move into
the newly open and available lands and been living and thriving building distinct communities
and cultures ever since (Stilson 2003). By 12,000 years ago these peoples had migrated into the
areas of Washington State and beyond (Stilson 2003). Though many of these cultures and
peoples have been lost to the ages, they have left behind evidence that informs us of their
presence & way of life. It is the job of archaeologists to find this evidence to research and
interpret it. “These sites represent places on the landscape where people lived and carried out
| 3D r e w C a r e y
daily routines, leaving artifacts and other material remains that shed light on their activities”
(Stilson 2003).
The study area for this analysis is western Whatcom County, Washington (fig. 1).
Properly defined as; all areas within Whatcom County between the saltwater coastline eastern
border and the end of highway 542 western border. There are currently over 300 recorded
archaeological sites located within the bounds of western Whatcom County representing a vast
array of site types and locations. Sites encompass both historic; which is defined as the period
after native contact with westerners (around 1800), and prehistoric; defined as dates occurring
before the historic period, roughly 1800 AD – 12,000 BP. This study has no interest in historic
sites and will thus be focused specifically on pre-historic settlement sites which represent,
“residential sites occupied for varying lengths of time temporary stopovers or longer seasonal
encampments” (Stilson 2013).
With such an abundance of archaeological sites within western Whatcom county and the
continued discovery of multiple new archaeological sites each year it has become common
practice for state archaeologist and cultural resource management companies to try and locate as
many sites as possible, so as to protect the valuable cultural resources and information that they
may contain (Stilson 2003). This is becoming especially important in this age when we are
continuing to expand and grow our cities and settlements impacting surrounding areas that may
contain sites. The standard method employed by archaeologist for generations to locate sites has
been systematic surveying and sampling of areas deemed potential based on personal
observations or necessity such as a federally funded development projects (Judge 1988).
However there are now methods being employed by archaeologists and agencies to make site
location, surveying and sampling more cost effective and efficient (Leathwick 2000). One such
| 4D r e w C a r e y
technique for streamlining this process is known as predictive modeling and can be conducted
with relative ease using geographic information systems (Clement 2010, Egeland 2010, Judge
1988).
Predictive models assume that the locations of sites are influenced by modern or
prehistoric environmental factors such as vegetated land-cover, distance to water, or topographic
setting (Egeland 2010, Judge 1988). There are two distinct types of predictive models that can
be carried out using GIS; inductive and deductive. This study will employ the inductive method
of predictive modeling which follows an empirical correlative approach. “Empiric Correlative
models work by correlating the locations of a sample of sites with environmental features and
forecasting the locations of other, unknown sites in areas that are similar environmentally”
(Kohler 1986). These natural correlations of site location are found using statistical inferential
procedures to reduce a set of environmental variables linked with known locations to a set of
variables that demonstrably correlated with known sites (Kohler 1986, Egeland 2010, Leathwick
2000). Now known these variables can be input into a GIS program to generate an output of
areas that have a high potential for yielding archaeological resources, which agencies and
archaeologists can then use to narrow down and focus their survey and sampling efforts.
While predictive modeling is quite efficient and effective there are a few inherent
problems with the method. The largest being that models are “selective abstractions”, which omit
a great deal of the complexity of the real world such as economic and security variables (Judge
1988). Predictive models also can never be truly objective as there is a bias of the researcher as
to what environmental variables are significant. Finally predictive models are limited based on
the data availability for the researcher conducting the study. These associated problems are
evidence that predictive models are no substitute for surveying and sampling on the ground.
| 5D r e w C a r e y
However, predictive models can aid in surveying and locating new sites as well as protecting and
conserving areas that have a high potential for containing archaeological remains.
Objective:
The goal of this project is to develop an empirical correlative model to predict areas
within western Whatcom County Washington (fig. 1) that have a high probability for containing
prehistoric settlement sites. This will be done by identifying and building a list of statistically
significant correlations between known site location and environmental variables such as slope,
aspect, distance to water and land-cover. Thus locations that include represent variables within
the study area are likely to contain prehistoric settlement sites and will be identified using GIS
analysis. This information can then be utilized in survey planning and protection of likely site
locations.
Figure 1: Cartographic Representation & Description of the Study Area.
| 6D r e w C a r e y
Methods
Data Acquisition
The data required for an archaeological predictive site model includes a number of
environmental and ecological variables as well as data for known archaeological site locations
within the study area. Environmental data required for the analysis includes; hydrography, slope,
aspect, elevation and vegetation land-cover (Egeland 2010). To be able to obtain and use known
archaeological site location data I had to fill out several forms such as; Secure Access
Washington, DAHP Secure Side of WISAARD Student use Agreement, DAHP Memorandum of
Understanding for archaeological and historic site location information, as well as drafting a data
security agreement to be submitted to DAHP for protection of archaeological site location data.
Data required for the analysis includes both raster and vector files for the following variables;
hydrography (made up of two vector files one a line file the other a polygon), slope, aspect &
elevation (derived from a digital elevation model raster file and hill shade raster file), land-cover
(a raster file of NOAA CCAP classified land-cover classes), and finally vector data for known
archaeological site locations. The data sources for the project included:
 Hydrography Data -- Washington State Department of Natural Resources
<http://fortress.wa.gov/dnr/app1/dataweb/dmmatrix.html>
 Whatcom County Boundary and Whatcom County Township Boundaries -- Whatcom
County Planning and Development Services <
http://www.whatcomcounty.us/pds/gis/gisdata.jsp >
| 7D r e w C a r e y
 Vegetation Land Cover -- National Oceanographic & Atmospheric Administration,
Coastal Change Analysis Program (CCAP). <
http://www.csc.noaa.gov/digitalcoast/data/ccapregional >
 10 Meter Digital Elevation Models -- University of Washington: Department of Earth and
Spaces Sciences <
http://rocky.ess.washington.edu/data/raster/tenmeter/byquad/index.html >
 Archaeological Site Location Data -- Washington State Department of Archaeology and
Historic Preservation, Stephanie Kramer: Assistant State Archaeologist <
http://www.dahp.wa.gov/ >
Study Area
The study area for this project is the western half of Whatcom County in northwestern
Washington State, properly defined as; all areas within Whatcom County between the saltwater
coastline eastern border and the end of highway 542 western border (Fig. 1).
Data Pre-Processing
Substantial pre-processing of the data was required before the final analysis could be
conducted. The first step in data preparation for this analysis was to create a file geodatabase and
within it create 2 feature datasets (one for hydrography and one for the study area outline) as
well as one raster dataset (for land cover), where all of my final files for the analysis would be
located. The next task is to create a digital elevation model and hill shade for the study area from
several smaller individual DEM raster files. To conduct this task a mosaicked raster dataset was
created within the geodatabase that all of the individual DEM raster files were then added to and
stitched or mosaicked together to create one large DEM of the study area. From this mosaicked
| 8D r e w C a r e y
raster dataset a “referenced mosaicked raster dataset” or “hill shade”, was created within the
geodatabase. This DEM was also then used in the creation of two additional raster datasets for
the study area; one for the aspect values and one for the slope values.
Once all of the data is acquired the next task is to set the projection for each and every
vector and raster data file that will be used in the analysis to the same projection. For this
analysis, NAD 1983 State Plane Washington North FIPS 4601 (meters) was used.
The next step is to create a vector file that would serve as an outline for the study area.
To accomplish this, a definition query was used to select all of the townships that were located
within the defined study area of western Whatcom County from the township vector file obtained
from the Whatcom county department of development and planning. Once the study area was
selected based on townships the Whatcom County outline vector file was clipped to the extent of
the selected townships, to produce a proper vector polygon outline of the study area.
The next task was to clip all other vector and raster data files (2 hydrography vector files,
digital elevation model raster, hill shade raster and the land-cover raster) to be used in the final
analysis to the study area so as to remove data that lies outside of the study area.
After all of the data was set to the proper projection and within the proper extent I
exported all data files that would be used in the final analysis to the geodatabase and associated
feature datasets and raster datasets. The two hydrography vector files are exported to the
hydrography feature dataset, the study area outline vector file as well as the study area township
vector file are exported to the study area feature dataset, and the land-cover raster file is exported
to the land-cover raster dataset.
| 9D r e w C a r e y
Site Suitability Analysis
To identify areas with a high potential for containing archaeological sites I will conduct a
site suitability analysis. “Site suitability analysis enters variables into a computer model that
geographically displays areas that are most (and least) likely to preserve sites based on numerical
suitability scores (the higher the score, the more conductive an area is for site identification”
(Egeland 2010).
To identify the environmental predictive variables that would be used in the analysis, data
of known archaeological site locations within the study area will be used to identify categories
within the environmental variables that correlate with the known site locations. There are five
variables that traditionally dictate site or settlement locations for all peoples worldwide; slope,
aspect, elevation, distance to water & vegetation land-cover (Egeland 2010). Each of these
variables contains within it a set of categories that site locations can fall into. Take the vegetation
land-cover for example. It contains within it several land-cover classes ranging from deciduous
forest to grasslands to alpine terrain. By using linear scale transformation suitability scores
between 0 and 1 will be assigned to the individual categories, with the category containing the
highest frequency of sites receiving a suitability score of 1 with all subsequent scores scaled to
this value. Then the linear scale transformation values for each variable are summed, averaged to
remove potential outliers, and multiplied by 100 to yield a composite suitability score that will
range from 0 (least suitable) to 100 (high suitability). Once this is complete the calculated raster
values for each variable (slope aspect, land cover & elevation) are reclassified into 3 suitability
categories; 0= unsuitable locations, 1= moderately suitable locations and 2= highly suitable
locations. Scores ranges are determined by the mean suitability score of previously identified
sites with a range equal to the standard deviation of the previously identified sites, this will yield
| 10D r e w C a r e y
the suitability score range for moderately suitable sites with suitability ranges for unsuitable and
highly suitable scaled to fit in the 0-100 range. After all four variables are ranked and reclassified
map algebra is performed on the variables adding them together and averaging them to produce
the final results. However there is one more step in the analysis to remove the noise caused by
water bodies. All water bodies will be reclassified and given a value of 0 = Unsuitable by using a
conditional tool.
Once the raster calculator and conditional analysis is complete the results will represent 3
unique site suitability values; 0 = Unsuitable Locations, 1=Moderately Suitable Locations, 2 =
Highly Suitable Locations, and will be presented as a raster map and table of total areas for each
category in kilometers squared for visual interpretation.
| 11D r e w C a r e y
Results
Final results from the predictive site model analysis for potential prehistoric settlement
site locations within Whatcom County, Washington yielded a raster image of the study area
divided into three levels of suitability for site locations (Unsuitable, Suitable & Highly Suitable)
(fig. 2). Table 4 depicts the results of the analysis as total area in Square Kilometers as well as
percentage of the study area that each suitability category occupies.
Figure 2: This map depicts predicted site suitability locations for prehistoric settlement sites
within Whatcom County Washington.
Legend
Unsuitable Suitable Highly Suitable Water
| 12D r e w C a r e y
Figure 3: This map shows the correlation between known prehistoric settlement site locations
and areas deemed highly suitable for containing prehistoric settlement sites. One can also see a
strong correlation between highly suitable areas and their proximity to large waterbodies.
Figure 4: Map depicting results from predictive model to identify suitable locations for
prehistoric settlement sites. Here one can see a correlation between highly suitable settlement
locations and the Nooksack River.
| 13D r e w C a r e y
Figure 5: Map depicting results from predictive model to identify suitable locations for
prehistoric settlement sites. Here one can again see a correlation between highly suitable
settlement locations and the Nooksack River. One will also notice that there are no highly
suitable locations near or around Lake Whatcom. This is due to the effect of the slope, aspect and
land cover types surrounding the lake.
Table 1: Aspect categories used in site suitability analysis for prehistoric settlement sites. All
LST scores were scaled to the maximum value to derive suitability scores.
Aspect No. of Occurrences LST Score
-1 Flat 31 100
1 North 2 8
2 Northeast 5 18
3 East 1 5
4 Southeast 2 8
5 South 4 15
6 Southwest 3 11
7 West 3 11
8 Northwest 3 11
| 14D r e w C a r e y
Table 2: Land Cover categories used in site suitability analysis for prehistoric settlement sites.
All LST scores were scaled to the maximum value to derive suitability scores.
Land Cover No. of Occurrences LST Score
5 Urban / Developed 13 87
8 Open / Cultivated Grassland 13 87
9 Deciduous Forest 6 43
10 Evergreen Forest 1 11
11 Mixed Forest 6 43
13 Wetlands 15 100
21 Water / Glaciers 0 5
Table 3: Slope categories used in site suitability analysis for prehistoric settlement sites. All LST
scores were scaled to the maximum value to derive suitability scores.
Slope (Degrees) No. of Occurrences LST Score
0 - 3 47 100
4 - 6 4 7
7 + 3 5
Table 4: Prehistoric settlement predictive model results reflecting the total area in Kilometers
squared of each site suitability category within the study area of western Whatcom County,
Washington.
Suitability Total Area Km2 % of Total Area
0 - Unsuitable 1,708 51.5
1 - Suitable 1,496 45
2 - Highly Suitable 115 3.5
| 15D r e w C a r e y
Discussion
The overall value of this study lies in its potential for surveying, identifying and protecting
potential prehistoric archaeological sites. The data and results from this study have the potential to aid
both governmental and private archaeological agencies both economically and temporally. By using this
model and results, agencies can better coordinate and focus their survey efforts to locations that have a
statistically higher likelihood of containing sites. This will save them both time and money on typically
costly and lengthy surveys.
Results from this model also have the potential to be utilized by multiple different agencies for
the monitoring, protection and conservation of prehistoric archaeological sites. For example companies
such as Weyerhaeuser that are constantly logging and disturbing large areas that have the potential to
contain archaeological sites can use this data to determine where they should avoid logging or building,
thus limiting their impact on archaeological resources.
This predictive model can also be expanded or contracted with respect to number of variables to
produce either a more generalized or a more specified prediction of potential site location. This model
could also be adapted to numerous other archaeological site categories such as lithic sites, shell middens
or even salmon traditional harvesting locations such as fish weirs and platforms.
One other benefit of this predictive model is that it can be taken and applied to other study areas
worldwide. I in fact designed this model from a similar predictive model designed by Egeland et al.
(2010) to identify high potential areas for paleoanthropological survey efforts in northern Armenia. It is
possible to use this model anywhere in the world as long as the proper data is available.
While this predictive model and analysis did provide the desired results I do feel that it could be
expanded and refined slightly. The first hiccup with my analysis that requires refinement is the
classification of water bodies in the suitable and highly suitable potential site locations categories which
slightly skews the results. The reason that water bodies were mistakenly included in these categories is
| 16D r e w C a r e y
the result of two variables in the analysis; slope and aspect. As the surface of a lake, river or stream is flat,
water bodies within the slope and aspect categories were defined as having a zero degree slope and a flat
aspect which were the two highest ranked categories within the respective variables as can be seen in
tables 1 & 3 of the results section. Therefore when the final raster calculator was ran to produce the
results; water received a relatively high score based on the slope and aspect variables. However this can
be factored out using a conditional tool & water bodies mask to reclassify all pixels that underlie the
water body locations mask to the unsuitable category (value = 0).
Another variable within the study that could be refined is the distance to water. As discussed in
the backgrounds section, the majority of prehistoric settlement sites worldwide are within 2 km of a
constant or perennial source of freshwater. However within Whatcom County there is not a single area
that is not within 2km of a perennial freshwater stream and thus this variable was discarded in my model.
This may not seem like an issue but I believe it to be based on the fact that a stream may be perennial but
still too small to be able to supply enough water to settled populations. Thus to refine this variable one
could rank the perennial streams by their stream flow and discharge to select only streams and water
bodies that could sustain a large settled population.
One final aspect that limited my predictive model was the number of known site locations. The
number of known prehistoric settlement site locations that I received from the Washington State
Department of Archaeology and Historic Preservation was so small that I did not have enough sites to
break them apart into two sets, one for identifying the correlating variables and one for testing the overall
accuracy of the model. Therefore if I had more site data I would be able to improve the model by
measuring its accuracy.
| 17D r e w C a r e y
Sources Cited
1. Clement, Christopher Ohm. et al. (2010). Using GIS to Model and Predict Likely
Archaeological Sites. ESRI & University of South Carolina. Retrieved April 10, 2013, from
EBSCO host database.
2. Egeland, Charles P. et al. (2010). Using GIS and Ecological Variables to Identify High
Potential Areas for Paleoanthropological Survey: An Example from Northern Armenia.
Journal of Ecological Anthropology, 14(1). Retrieved April 10, 2013, from EBSCO host
database.
3. Judge, James W. et al. (1988). Quantifying the Present and Predicting the Past: Theory,
Method, and Application of Archaeological Predictive Modeling. Bureau of Land
Management. Retrieved April 10, 2013, from EBSCO host database.
4. Kohler, Timothy A. et al. (1986). Predictive Models for Archaeological Resource Location.
Advances in Archaeological Method and Theory, 9(1). Retrieved April 21, 2013, from Jstor
database.
5. Leathwick, J.R. (2000). Predictive models of archaeological site distributions in New
Zealand. New Zealand Department of Conservation. Retrieved April 10, 2013, from EBSCO
host database.
6. Stilson, M. Leland, et al. (2003). A Field Guide to Washington State Archaeology.
Washington State Department of Archaeology & Historic Preservation. Retrieved April 10,
2013, from <http://www.dahp.wa.gov/programs/archaeology>.
| 18D r e w C a r e y
Data Cited
1. 10 Meter Digital Elevation Models [Internet]. 2000. University of Washington:
Department of Earth and Spaces Sciences; [cited 2013 April 10]. Available from:
http://rocky.ess.washington.edu/data/raster/tenmeter/byquad/index.html
2. Archaeological Site Location Data [Internet]. 2013. Washington State Department of
Archaeology and Historic Preservation; [cited 2013 May 12]. Obtained Upon Request
from: http://www.dahp.wa.gov/
3. Hydrography (by County) [Internet]. 2013. Washington State Department of Natural
Resources; [cited 2013 April 10]. Available from:
http://fortress.wa.gov/dnr/app1/dataweb/dmmatrix.html
4. Vegetated Land Cover [Internet]. 2006. NOAA: Coastal Change Analysis Program;
[cited 2013 April 10]. Available from:
http://www.csc.noaa.gov/digitalcoast/data/ccapregional
5. Whatcom County Boundary & Townships [Internet]. 2013. Whatcom County: Planning
and Development Services; [cited 2013 April 10]. Available from:
http://www.whatcomcounty.us/pds/gis/gisdata.jsp

More Related Content

What's hot

VALIDATION OF DERIVED GROUNDWATER POTENTIAL ZONES (GWPZ) USING GEO-INFORMATIC...
VALIDATION OF DERIVED GROUNDWATER POTENTIAL ZONES (GWPZ) USING GEO-INFORMATIC...VALIDATION OF DERIVED GROUNDWATER POTENTIAL ZONES (GWPZ) USING GEO-INFORMATIC...
VALIDATION OF DERIVED GROUNDWATER POTENTIAL ZONES (GWPZ) USING GEO-INFORMATIC...IAEME Publication
 
gis in natural disaster management geo hazards
gis in natural disaster management  geo hazardsgis in natural disaster management  geo hazards
gis in natural disaster management geo hazardsSoumik Chakraborty
 
Contributions of Satellite Images in the Diachronic Study of the Stanley-Pool...
Contributions of Satellite Images in the Diachronic Study of the Stanley-Pool...Contributions of Satellite Images in the Diachronic Study of the Stanley-Pool...
Contributions of Satellite Images in the Diachronic Study of the Stanley-Pool...INFOGAIN PUBLICATION
 
Landuse and Landcover analysis using Remote Sensing and GIS: A Case Study in ...
Landuse and Landcover analysis using Remote Sensing and GIS: A Case Study in ...Landuse and Landcover analysis using Remote Sensing and GIS: A Case Study in ...
Landuse and Landcover analysis using Remote Sensing and GIS: A Case Study in ...IRJET Journal
 
Identification Of Ground Water Potential Zones In Tamil Nadu By Remote Sensin...
Identification Of Ground Water Potential Zones In Tamil Nadu By Remote Sensin...Identification Of Ground Water Potential Zones In Tamil Nadu By Remote Sensin...
Identification Of Ground Water Potential Zones In Tamil Nadu By Remote Sensin...IJERA Editor
 
[International agrophysics] ground penetrating radar for underground sensing ...
[International agrophysics] ground penetrating radar for underground sensing ...[International agrophysics] ground penetrating radar for underground sensing ...
[International agrophysics] ground penetrating radar for underground sensing ...Minal Ghugal
 
Inundation and Hazard Mapping on River Asa, using GIS
Inundation and Hazard Mapping on River Asa, using GISInundation and Hazard Mapping on River Asa, using GIS
Inundation and Hazard Mapping on River Asa, using GISOyeniyi Samuel
 
Inverse Scattering Series & Seismic Exploration - Topical Review by Arthur We...
Inverse Scattering Series & Seismic Exploration - Topical Review by Arthur We...Inverse Scattering Series & Seismic Exploration - Topical Review by Arthur We...
Inverse Scattering Series & Seismic Exploration - Topical Review by Arthur We...Arthur Weglein
 
Geological mapping
Geological mappingGeological mapping
Geological mappingPramoda Raj
 
Structural Trends from Airborne Gravity Data of Delta State, Nigeria
Structural Trends from Airborne Gravity Data of Delta State, NigeriaStructural Trends from Airborne Gravity Data of Delta State, Nigeria
Structural Trends from Airborne Gravity Data of Delta State, NigeriaAssociate Professor in VSB Coimbatore
 
Moderate_resolution_GEC
Moderate_resolution_GECModerate_resolution_GEC
Moderate_resolution_GECKenneth Kay
 
Angela, Luis, Aileen pre proposal presentation on mangrove cover and PR Touri...
Angela, Luis, Aileen pre proposal presentation on mangrove cover and PR Touri...Angela, Luis, Aileen pre proposal presentation on mangrove cover and PR Touri...
Angela, Luis, Aileen pre proposal presentation on mangrove cover and PR Touri...Loretta Roberson
 
Fractal Geometry of Landslide Zones
Fractal Geometry of Landslide ZonesFractal Geometry of Landslide Zones
Fractal Geometry of Landslide ZonesAli Osman Öncel
 

What's hot (17)

175 xxxiii part7
175 xxxiii part7175 xxxiii part7
175 xxxiii part7
 
VALIDATION OF DERIVED GROUNDWATER POTENTIAL ZONES (GWPZ) USING GEO-INFORMATIC...
VALIDATION OF DERIVED GROUNDWATER POTENTIAL ZONES (GWPZ) USING GEO-INFORMATIC...VALIDATION OF DERIVED GROUNDWATER POTENTIAL ZONES (GWPZ) USING GEO-INFORMATIC...
VALIDATION OF DERIVED GROUNDWATER POTENTIAL ZONES (GWPZ) USING GEO-INFORMATIC...
 
gis in natural disaster management geo hazards
gis in natural disaster management  geo hazardsgis in natural disaster management  geo hazards
gis in natural disaster management geo hazards
 
Contributions of Satellite Images in the Diachronic Study of the Stanley-Pool...
Contributions of Satellite Images in the Diachronic Study of the Stanley-Pool...Contributions of Satellite Images in the Diachronic Study of the Stanley-Pool...
Contributions of Satellite Images in the Diachronic Study of the Stanley-Pool...
 
Landuse and Landcover analysis using Remote Sensing and GIS: A Case Study in ...
Landuse and Landcover analysis using Remote Sensing and GIS: A Case Study in ...Landuse and Landcover analysis using Remote Sensing and GIS: A Case Study in ...
Landuse and Landcover analysis using Remote Sensing and GIS: A Case Study in ...
 
Identification Of Ground Water Potential Zones In Tamil Nadu By Remote Sensin...
Identification Of Ground Water Potential Zones In Tamil Nadu By Remote Sensin...Identification Of Ground Water Potential Zones In Tamil Nadu By Remote Sensin...
Identification Of Ground Water Potential Zones In Tamil Nadu By Remote Sensin...
 
[International agrophysics] ground penetrating radar for underground sensing ...
[International agrophysics] ground penetrating radar for underground sensing ...[International agrophysics] ground penetrating radar for underground sensing ...
[International agrophysics] ground penetrating radar for underground sensing ...
 
Inundation and Hazard Mapping on River Asa, using GIS
Inundation and Hazard Mapping on River Asa, using GISInundation and Hazard Mapping on River Asa, using GIS
Inundation and Hazard Mapping on River Asa, using GIS
 
Inverse Scattering Series & Seismic Exploration - Topical Review by Arthur We...
Inverse Scattering Series & Seismic Exploration - Topical Review by Arthur We...Inverse Scattering Series & Seismic Exploration - Topical Review by Arthur We...
Inverse Scattering Series & Seismic Exploration - Topical Review by Arthur We...
 
Ijciet 10 01_181
Ijciet 10 01_181Ijciet 10 01_181
Ijciet 10 01_181
 
A2100107
A2100107A2100107
A2100107
 
Geological mapping
Geological mappingGeological mapping
Geological mapping
 
Structural Trends from Airborne Gravity Data of Delta State, Nigeria
Structural Trends from Airborne Gravity Data of Delta State, NigeriaStructural Trends from Airborne Gravity Data of Delta State, Nigeria
Structural Trends from Airborne Gravity Data of Delta State, Nigeria
 
Moderate_resolution_GEC
Moderate_resolution_GECModerate_resolution_GEC
Moderate_resolution_GEC
 
Angela, Luis, Aileen pre proposal presentation on mangrove cover and PR Touri...
Angela, Luis, Aileen pre proposal presentation on mangrove cover and PR Touri...Angela, Luis, Aileen pre proposal presentation on mangrove cover and PR Touri...
Angela, Luis, Aileen pre proposal presentation on mangrove cover and PR Touri...
 
Fractal Geometry of Landslide Zones
Fractal Geometry of Landslide ZonesFractal Geometry of Landslide Zones
Fractal Geometry of Landslide Zones
 
Ijciet 10 01_014
Ijciet 10 01_014Ijciet 10 01_014
Ijciet 10 01_014
 

Viewers also liked

Viewers also liked (12)

Final CFA Research Report
Final CFA Research ReportFinal CFA Research Report
Final CFA Research Report
 
LookBookfromSFAShow
LookBookfromSFAShowLookBookfromSFAShow
LookBookfromSFAShow
 
Sea State Final Paper
Sea State Final PaperSea State Final Paper
Sea State Final Paper
 
anth490_trauma:recovery_finalpaper
anth490_trauma:recovery_finalpaperanth490_trauma:recovery_finalpaper
anth490_trauma:recovery_finalpaper
 
Look bookfromsfa show
Look bookfromsfa showLook bookfromsfa show
Look bookfromsfa show
 
Financial Return of the Performance Culture
Financial Return of the Performance CultureFinancial Return of the Performance Culture
Financial Return of the Performance Culture
 
LookBookfromSFAShow
LookBookfromSFAShowLookBookfromSFAShow
LookBookfromSFAShow
 
Carey_LabX
Carey_LabXCarey_LabX
Carey_LabX
 
Portfolio2
Portfolio2Portfolio2
Portfolio2
 
CFA_Challenge_PPT_SSS
CFA_Challenge_PPT_SSSCFA_Challenge_PPT_SSS
CFA_Challenge_PPT_SSS
 
PFI Lantana Luminaire Spec Sheet v11
PFI Lantana Luminaire Spec Sheet v11PFI Lantana Luminaire Spec Sheet v11
PFI Lantana Luminaire Spec Sheet v11
 
Illiteracy in pakistan
Illiteracy in pakistanIlliteracy in pakistan
Illiteracy in pakistan
 

Similar to Final_Report

DSD-NL 2018 Evolutie in het leveren van ruimtelijke en temporele water gerela...
DSD-NL 2018 Evolutie in het leveren van ruimtelijke en temporele water gerela...DSD-NL 2018 Evolutie in het leveren van ruimtelijke en temporele water gerela...
DSD-NL 2018 Evolutie in het leveren van ruimtelijke en temporele water gerela...Deltares
 
Anderson et al. SEAC 2014 "Linking Archaeological Data At A Large Scale"
Anderson et al. SEAC 2014 "Linking Archaeological Data At A Large Scale"Anderson et al. SEAC 2014 "Linking Archaeological Data At A Large Scale"
Anderson et al. SEAC 2014 "Linking Archaeological Data At A Large Scale"dinaa_proj
 
Geospatial as an Accelerator of Impact: Already Converging!
Geospatial as an Accelerator of Impact: Already Converging!Geospatial as an Accelerator of Impact: Already Converging!
Geospatial as an Accelerator of Impact: Already Converging!Dawn Wright
 
The NASA Western Water Applications Office - Indrani C. Graczyk
The NASA Western Water Applications Office - Indrani C. GraczykThe NASA Western Water Applications Office - Indrani C. Graczyk
The NASA Western Water Applications Office - Indrani C. GraczykTWCA
 
RemoteSensingProjectPaper
RemoteSensingProjectPaperRemoteSensingProjectPaper
RemoteSensingProjectPaperJames Sherwood
 
Ecological Marine Units: A 3-D Mapping of the Ocean Based on NOAA’s World Oce...
Ecological Marine Units: A 3-D Mapping of the Ocean Based on NOAA’s World Oce...Ecological Marine Units: A 3-D Mapping of the Ocean Based on NOAA’s World Oce...
Ecological Marine Units: A 3-D Mapping of the Ocean Based on NOAA’s World Oce...Dawn Wright
 
Statistical techniques in geographical analysis
Statistical techniques in geographical analysisStatistical techniques in geographical analysis
Statistical techniques in geographical analysisakida mbugi
 
morningkeynote.pdf
morningkeynote.pdfmorningkeynote.pdf
morningkeynote.pdfWinnieChu21
 
From creekology to rocket science the evolution of remote sensing gis in oilg...
From creekology to rocket science the evolution of remote sensing gis in oilg...From creekology to rocket science the evolution of remote sensing gis in oilg...
From creekology to rocket science the evolution of remote sensing gis in oilg...Texas Natural Resources Information System
 
Remote Sensing and GIS for Coastal Management
Remote Sensing and GIS for Coastal ManagementRemote Sensing and GIS for Coastal Management
Remote Sensing and GIS for Coastal ManagementAnujSharma815
 
Risk Analysis Of Cultural Resource4th June2
Risk Analysis Of Cultural Resource4th June2Risk Analysis Of Cultural Resource4th June2
Risk Analysis Of Cultural Resource4th June2Shweta Bhatia Gupta
 
Risk Analysis Of Cultural Resource4th June2
Risk Analysis Of Cultural Resource4th June2Risk Analysis Of Cultural Resource4th June2
Risk Analysis Of Cultural Resource4th June2guesta56b77
 
Headings - 2014 issue 1
Headings - 2014 issue 1Headings - 2014 issue 1
Headings - 2014 issue 1Headings
 
Aquatic connectivity - Prof. Brian Fry ACEAS Grand
Aquatic connectivity - Prof. Brian Fry ACEAS GrandAquatic connectivity - Prof. Brian Fry ACEAS Grand
Aquatic connectivity - Prof. Brian Fry ACEAS Grandaceas13tern
 
Ecological Connectivity in Delaware, Ohio
Ecological Connectivity in Delaware, OhioEcological Connectivity in Delaware, Ohio
Ecological Connectivity in Delaware, OhioStefanie Hauck
 
An Open and Shut Case? Shared Standards for Stratigraphic Data and Heritage L...
An Open and Shut Case? Shared Standards for Stratigraphic Data and Heritage L...An Open and Shut Case? Shared Standards for Stratigraphic Data and Heritage L...
An Open and Shut Case? Shared Standards for Stratigraphic Data and Heritage L...Keith.May
 

Similar to Final_Report (20)

DSD-NL 2018 Evolutie in het leveren van ruimtelijke en temporele water gerela...
DSD-NL 2018 Evolutie in het leveren van ruimtelijke en temporele water gerela...DSD-NL 2018 Evolutie in het leveren van ruimtelijke en temporele water gerela...
DSD-NL 2018 Evolutie in het leveren van ruimtelijke en temporele water gerela...
 
Hedrick_Poster
Hedrick_PosterHedrick_Poster
Hedrick_Poster
 
Anderson et al. SEAC 2014 "Linking Archaeological Data At A Large Scale"
Anderson et al. SEAC 2014 "Linking Archaeological Data At A Large Scale"Anderson et al. SEAC 2014 "Linking Archaeological Data At A Large Scale"
Anderson et al. SEAC 2014 "Linking Archaeological Data At A Large Scale"
 
Geospatial as an Accelerator of Impact: Already Converging!
Geospatial as an Accelerator of Impact: Already Converging!Geospatial as an Accelerator of Impact: Already Converging!
Geospatial as an Accelerator of Impact: Already Converging!
 
The NASA Western Water Applications Office - Indrani C. Graczyk
The NASA Western Water Applications Office - Indrani C. GraczykThe NASA Western Water Applications Office - Indrani C. Graczyk
The NASA Western Water Applications Office - Indrani C. Graczyk
 
RemoteSensingProjectPaper
RemoteSensingProjectPaperRemoteSensingProjectPaper
RemoteSensingProjectPaper
 
Ecological Marine Units: A 3-D Mapping of the Ocean Based on NOAA’s World Oce...
Ecological Marine Units: A 3-D Mapping of the Ocean Based on NOAA’s World Oce...Ecological Marine Units: A 3-D Mapping of the Ocean Based on NOAA’s World Oce...
Ecological Marine Units: A 3-D Mapping of the Ocean Based on NOAA’s World Oce...
 
Statistical techniques in geographical analysis
Statistical techniques in geographical analysisStatistical techniques in geographical analysis
Statistical techniques in geographical analysis
 
FINAL REPORT
FINAL REPORTFINAL REPORT
FINAL REPORT
 
morningkeynote.pdf
morningkeynote.pdfmorningkeynote.pdf
morningkeynote.pdf
 
Mlhil ljr.web.285
Mlhil ljr.web.285Mlhil ljr.web.285
Mlhil ljr.web.285
 
report_final
report_finalreport_final
report_final
 
From creekology to rocket science the evolution of remote sensing gis in oilg...
From creekology to rocket science the evolution of remote sensing gis in oilg...From creekology to rocket science the evolution of remote sensing gis in oilg...
From creekology to rocket science the evolution of remote sensing gis in oilg...
 
Remote Sensing and GIS for Coastal Management
Remote Sensing and GIS for Coastal ManagementRemote Sensing and GIS for Coastal Management
Remote Sensing and GIS for Coastal Management
 
Risk Analysis Of Cultural Resource4th June2
Risk Analysis Of Cultural Resource4th June2Risk Analysis Of Cultural Resource4th June2
Risk Analysis Of Cultural Resource4th June2
 
Risk Analysis Of Cultural Resource4th June2
Risk Analysis Of Cultural Resource4th June2Risk Analysis Of Cultural Resource4th June2
Risk Analysis Of Cultural Resource4th June2
 
Headings - 2014 issue 1
Headings - 2014 issue 1Headings - 2014 issue 1
Headings - 2014 issue 1
 
Aquatic connectivity - Prof. Brian Fry ACEAS Grand
Aquatic connectivity - Prof. Brian Fry ACEAS GrandAquatic connectivity - Prof. Brian Fry ACEAS Grand
Aquatic connectivity - Prof. Brian Fry ACEAS Grand
 
Ecological Connectivity in Delaware, Ohio
Ecological Connectivity in Delaware, OhioEcological Connectivity in Delaware, Ohio
Ecological Connectivity in Delaware, Ohio
 
An Open and Shut Case? Shared Standards for Stratigraphic Data and Heritage L...
An Open and Shut Case? Shared Standards for Stratigraphic Data and Heritage L...An Open and Shut Case? Shared Standards for Stratigraphic Data and Heritage L...
An Open and Shut Case? Shared Standards for Stratigraphic Data and Heritage L...
 

Final_Report

  • 1. | 1D r e w C a r e y Predictive Modeling for Prehistoric Archaeological Sites within Western Whatcom County, Washington Using GIS By: Drew Carey For: ENVS 422 Advanced GIS June 6, 2013
  • 2. | 2D r e w C a r e y Background Abstract: Washington State has thousands of recorded archaeological sites within its borders. Those sites in addition to an average of 20 plus new sites being discovered per county each year make it increasingly important to identify and preserve as many of these sites as possible for the archaeological record. It is the goal of this study to create an inductive predictive model using geographic information systems (GIS) to aid in locating potential prehistoric settlement site areas within western Whatcom County Washington. An inductive predictive model uses known site locations to infer relationships between sites and environmental variables, such as; distance to water, slope, aspect and vegetated land cover to identify areas that have a high probability of containing archaeological sites, based on the correlating variables. Background Information: Humans have always been closely tied to their environments, constantly moving and adapting to climates that best suit their subsistence and survival. Ever since the ice sheets began to clear from the North American continent over 25,000 years ago mankind began to move into the newly open and available lands and been living and thriving building distinct communities and cultures ever since (Stilson 2003). By 12,000 years ago these peoples had migrated into the areas of Washington State and beyond (Stilson 2003). Though many of these cultures and peoples have been lost to the ages, they have left behind evidence that informs us of their presence & way of life. It is the job of archaeologists to find this evidence to research and interpret it. “These sites represent places on the landscape where people lived and carried out
  • 3. | 3D r e w C a r e y daily routines, leaving artifacts and other material remains that shed light on their activities” (Stilson 2003). The study area for this analysis is western Whatcom County, Washington (fig. 1). Properly defined as; all areas within Whatcom County between the saltwater coastline eastern border and the end of highway 542 western border. There are currently over 300 recorded archaeological sites located within the bounds of western Whatcom County representing a vast array of site types and locations. Sites encompass both historic; which is defined as the period after native contact with westerners (around 1800), and prehistoric; defined as dates occurring before the historic period, roughly 1800 AD – 12,000 BP. This study has no interest in historic sites and will thus be focused specifically on pre-historic settlement sites which represent, “residential sites occupied for varying lengths of time temporary stopovers or longer seasonal encampments” (Stilson 2013). With such an abundance of archaeological sites within western Whatcom county and the continued discovery of multiple new archaeological sites each year it has become common practice for state archaeologist and cultural resource management companies to try and locate as many sites as possible, so as to protect the valuable cultural resources and information that they may contain (Stilson 2003). This is becoming especially important in this age when we are continuing to expand and grow our cities and settlements impacting surrounding areas that may contain sites. The standard method employed by archaeologist for generations to locate sites has been systematic surveying and sampling of areas deemed potential based on personal observations or necessity such as a federally funded development projects (Judge 1988). However there are now methods being employed by archaeologists and agencies to make site location, surveying and sampling more cost effective and efficient (Leathwick 2000). One such
  • 4. | 4D r e w C a r e y technique for streamlining this process is known as predictive modeling and can be conducted with relative ease using geographic information systems (Clement 2010, Egeland 2010, Judge 1988). Predictive models assume that the locations of sites are influenced by modern or prehistoric environmental factors such as vegetated land-cover, distance to water, or topographic setting (Egeland 2010, Judge 1988). There are two distinct types of predictive models that can be carried out using GIS; inductive and deductive. This study will employ the inductive method of predictive modeling which follows an empirical correlative approach. “Empiric Correlative models work by correlating the locations of a sample of sites with environmental features and forecasting the locations of other, unknown sites in areas that are similar environmentally” (Kohler 1986). These natural correlations of site location are found using statistical inferential procedures to reduce a set of environmental variables linked with known locations to a set of variables that demonstrably correlated with known sites (Kohler 1986, Egeland 2010, Leathwick 2000). Now known these variables can be input into a GIS program to generate an output of areas that have a high potential for yielding archaeological resources, which agencies and archaeologists can then use to narrow down and focus their survey and sampling efforts. While predictive modeling is quite efficient and effective there are a few inherent problems with the method. The largest being that models are “selective abstractions”, which omit a great deal of the complexity of the real world such as economic and security variables (Judge 1988). Predictive models also can never be truly objective as there is a bias of the researcher as to what environmental variables are significant. Finally predictive models are limited based on the data availability for the researcher conducting the study. These associated problems are evidence that predictive models are no substitute for surveying and sampling on the ground.
  • 5. | 5D r e w C a r e y However, predictive models can aid in surveying and locating new sites as well as protecting and conserving areas that have a high potential for containing archaeological remains. Objective: The goal of this project is to develop an empirical correlative model to predict areas within western Whatcom County Washington (fig. 1) that have a high probability for containing prehistoric settlement sites. This will be done by identifying and building a list of statistically significant correlations between known site location and environmental variables such as slope, aspect, distance to water and land-cover. Thus locations that include represent variables within the study area are likely to contain prehistoric settlement sites and will be identified using GIS analysis. This information can then be utilized in survey planning and protection of likely site locations. Figure 1: Cartographic Representation & Description of the Study Area.
  • 6. | 6D r e w C a r e y Methods Data Acquisition The data required for an archaeological predictive site model includes a number of environmental and ecological variables as well as data for known archaeological site locations within the study area. Environmental data required for the analysis includes; hydrography, slope, aspect, elevation and vegetation land-cover (Egeland 2010). To be able to obtain and use known archaeological site location data I had to fill out several forms such as; Secure Access Washington, DAHP Secure Side of WISAARD Student use Agreement, DAHP Memorandum of Understanding for archaeological and historic site location information, as well as drafting a data security agreement to be submitted to DAHP for protection of archaeological site location data. Data required for the analysis includes both raster and vector files for the following variables; hydrography (made up of two vector files one a line file the other a polygon), slope, aspect & elevation (derived from a digital elevation model raster file and hill shade raster file), land-cover (a raster file of NOAA CCAP classified land-cover classes), and finally vector data for known archaeological site locations. The data sources for the project included:  Hydrography Data -- Washington State Department of Natural Resources <http://fortress.wa.gov/dnr/app1/dataweb/dmmatrix.html>  Whatcom County Boundary and Whatcom County Township Boundaries -- Whatcom County Planning and Development Services < http://www.whatcomcounty.us/pds/gis/gisdata.jsp >
  • 7. | 7D r e w C a r e y  Vegetation Land Cover -- National Oceanographic & Atmospheric Administration, Coastal Change Analysis Program (CCAP). < http://www.csc.noaa.gov/digitalcoast/data/ccapregional >  10 Meter Digital Elevation Models -- University of Washington: Department of Earth and Spaces Sciences < http://rocky.ess.washington.edu/data/raster/tenmeter/byquad/index.html >  Archaeological Site Location Data -- Washington State Department of Archaeology and Historic Preservation, Stephanie Kramer: Assistant State Archaeologist < http://www.dahp.wa.gov/ > Study Area The study area for this project is the western half of Whatcom County in northwestern Washington State, properly defined as; all areas within Whatcom County between the saltwater coastline eastern border and the end of highway 542 western border (Fig. 1). Data Pre-Processing Substantial pre-processing of the data was required before the final analysis could be conducted. The first step in data preparation for this analysis was to create a file geodatabase and within it create 2 feature datasets (one for hydrography and one for the study area outline) as well as one raster dataset (for land cover), where all of my final files for the analysis would be located. The next task is to create a digital elevation model and hill shade for the study area from several smaller individual DEM raster files. To conduct this task a mosaicked raster dataset was created within the geodatabase that all of the individual DEM raster files were then added to and stitched or mosaicked together to create one large DEM of the study area. From this mosaicked
  • 8. | 8D r e w C a r e y raster dataset a “referenced mosaicked raster dataset” or “hill shade”, was created within the geodatabase. This DEM was also then used in the creation of two additional raster datasets for the study area; one for the aspect values and one for the slope values. Once all of the data is acquired the next task is to set the projection for each and every vector and raster data file that will be used in the analysis to the same projection. For this analysis, NAD 1983 State Plane Washington North FIPS 4601 (meters) was used. The next step is to create a vector file that would serve as an outline for the study area. To accomplish this, a definition query was used to select all of the townships that were located within the defined study area of western Whatcom County from the township vector file obtained from the Whatcom county department of development and planning. Once the study area was selected based on townships the Whatcom County outline vector file was clipped to the extent of the selected townships, to produce a proper vector polygon outline of the study area. The next task was to clip all other vector and raster data files (2 hydrography vector files, digital elevation model raster, hill shade raster and the land-cover raster) to be used in the final analysis to the study area so as to remove data that lies outside of the study area. After all of the data was set to the proper projection and within the proper extent I exported all data files that would be used in the final analysis to the geodatabase and associated feature datasets and raster datasets. The two hydrography vector files are exported to the hydrography feature dataset, the study area outline vector file as well as the study area township vector file are exported to the study area feature dataset, and the land-cover raster file is exported to the land-cover raster dataset.
  • 9. | 9D r e w C a r e y Site Suitability Analysis To identify areas with a high potential for containing archaeological sites I will conduct a site suitability analysis. “Site suitability analysis enters variables into a computer model that geographically displays areas that are most (and least) likely to preserve sites based on numerical suitability scores (the higher the score, the more conductive an area is for site identification” (Egeland 2010). To identify the environmental predictive variables that would be used in the analysis, data of known archaeological site locations within the study area will be used to identify categories within the environmental variables that correlate with the known site locations. There are five variables that traditionally dictate site or settlement locations for all peoples worldwide; slope, aspect, elevation, distance to water & vegetation land-cover (Egeland 2010). Each of these variables contains within it a set of categories that site locations can fall into. Take the vegetation land-cover for example. It contains within it several land-cover classes ranging from deciduous forest to grasslands to alpine terrain. By using linear scale transformation suitability scores between 0 and 1 will be assigned to the individual categories, with the category containing the highest frequency of sites receiving a suitability score of 1 with all subsequent scores scaled to this value. Then the linear scale transformation values for each variable are summed, averaged to remove potential outliers, and multiplied by 100 to yield a composite suitability score that will range from 0 (least suitable) to 100 (high suitability). Once this is complete the calculated raster values for each variable (slope aspect, land cover & elevation) are reclassified into 3 suitability categories; 0= unsuitable locations, 1= moderately suitable locations and 2= highly suitable locations. Scores ranges are determined by the mean suitability score of previously identified sites with a range equal to the standard deviation of the previously identified sites, this will yield
  • 10. | 10D r e w C a r e y the suitability score range for moderately suitable sites with suitability ranges for unsuitable and highly suitable scaled to fit in the 0-100 range. After all four variables are ranked and reclassified map algebra is performed on the variables adding them together and averaging them to produce the final results. However there is one more step in the analysis to remove the noise caused by water bodies. All water bodies will be reclassified and given a value of 0 = Unsuitable by using a conditional tool. Once the raster calculator and conditional analysis is complete the results will represent 3 unique site suitability values; 0 = Unsuitable Locations, 1=Moderately Suitable Locations, 2 = Highly Suitable Locations, and will be presented as a raster map and table of total areas for each category in kilometers squared for visual interpretation.
  • 11. | 11D r e w C a r e y Results Final results from the predictive site model analysis for potential prehistoric settlement site locations within Whatcom County, Washington yielded a raster image of the study area divided into three levels of suitability for site locations (Unsuitable, Suitable & Highly Suitable) (fig. 2). Table 4 depicts the results of the analysis as total area in Square Kilometers as well as percentage of the study area that each suitability category occupies. Figure 2: This map depicts predicted site suitability locations for prehistoric settlement sites within Whatcom County Washington. Legend Unsuitable Suitable Highly Suitable Water
  • 12. | 12D r e w C a r e y Figure 3: This map shows the correlation between known prehistoric settlement site locations and areas deemed highly suitable for containing prehistoric settlement sites. One can also see a strong correlation between highly suitable areas and their proximity to large waterbodies. Figure 4: Map depicting results from predictive model to identify suitable locations for prehistoric settlement sites. Here one can see a correlation between highly suitable settlement locations and the Nooksack River.
  • 13. | 13D r e w C a r e y Figure 5: Map depicting results from predictive model to identify suitable locations for prehistoric settlement sites. Here one can again see a correlation between highly suitable settlement locations and the Nooksack River. One will also notice that there are no highly suitable locations near or around Lake Whatcom. This is due to the effect of the slope, aspect and land cover types surrounding the lake. Table 1: Aspect categories used in site suitability analysis for prehistoric settlement sites. All LST scores were scaled to the maximum value to derive suitability scores. Aspect No. of Occurrences LST Score -1 Flat 31 100 1 North 2 8 2 Northeast 5 18 3 East 1 5 4 Southeast 2 8 5 South 4 15 6 Southwest 3 11 7 West 3 11 8 Northwest 3 11
  • 14. | 14D r e w C a r e y Table 2: Land Cover categories used in site suitability analysis for prehistoric settlement sites. All LST scores were scaled to the maximum value to derive suitability scores. Land Cover No. of Occurrences LST Score 5 Urban / Developed 13 87 8 Open / Cultivated Grassland 13 87 9 Deciduous Forest 6 43 10 Evergreen Forest 1 11 11 Mixed Forest 6 43 13 Wetlands 15 100 21 Water / Glaciers 0 5 Table 3: Slope categories used in site suitability analysis for prehistoric settlement sites. All LST scores were scaled to the maximum value to derive suitability scores. Slope (Degrees) No. of Occurrences LST Score 0 - 3 47 100 4 - 6 4 7 7 + 3 5 Table 4: Prehistoric settlement predictive model results reflecting the total area in Kilometers squared of each site suitability category within the study area of western Whatcom County, Washington. Suitability Total Area Km2 % of Total Area 0 - Unsuitable 1,708 51.5 1 - Suitable 1,496 45 2 - Highly Suitable 115 3.5
  • 15. | 15D r e w C a r e y Discussion The overall value of this study lies in its potential for surveying, identifying and protecting potential prehistoric archaeological sites. The data and results from this study have the potential to aid both governmental and private archaeological agencies both economically and temporally. By using this model and results, agencies can better coordinate and focus their survey efforts to locations that have a statistically higher likelihood of containing sites. This will save them both time and money on typically costly and lengthy surveys. Results from this model also have the potential to be utilized by multiple different agencies for the monitoring, protection and conservation of prehistoric archaeological sites. For example companies such as Weyerhaeuser that are constantly logging and disturbing large areas that have the potential to contain archaeological sites can use this data to determine where they should avoid logging or building, thus limiting their impact on archaeological resources. This predictive model can also be expanded or contracted with respect to number of variables to produce either a more generalized or a more specified prediction of potential site location. This model could also be adapted to numerous other archaeological site categories such as lithic sites, shell middens or even salmon traditional harvesting locations such as fish weirs and platforms. One other benefit of this predictive model is that it can be taken and applied to other study areas worldwide. I in fact designed this model from a similar predictive model designed by Egeland et al. (2010) to identify high potential areas for paleoanthropological survey efforts in northern Armenia. It is possible to use this model anywhere in the world as long as the proper data is available. While this predictive model and analysis did provide the desired results I do feel that it could be expanded and refined slightly. The first hiccup with my analysis that requires refinement is the classification of water bodies in the suitable and highly suitable potential site locations categories which slightly skews the results. The reason that water bodies were mistakenly included in these categories is
  • 16. | 16D r e w C a r e y the result of two variables in the analysis; slope and aspect. As the surface of a lake, river or stream is flat, water bodies within the slope and aspect categories were defined as having a zero degree slope and a flat aspect which were the two highest ranked categories within the respective variables as can be seen in tables 1 & 3 of the results section. Therefore when the final raster calculator was ran to produce the results; water received a relatively high score based on the slope and aspect variables. However this can be factored out using a conditional tool & water bodies mask to reclassify all pixels that underlie the water body locations mask to the unsuitable category (value = 0). Another variable within the study that could be refined is the distance to water. As discussed in the backgrounds section, the majority of prehistoric settlement sites worldwide are within 2 km of a constant or perennial source of freshwater. However within Whatcom County there is not a single area that is not within 2km of a perennial freshwater stream and thus this variable was discarded in my model. This may not seem like an issue but I believe it to be based on the fact that a stream may be perennial but still too small to be able to supply enough water to settled populations. Thus to refine this variable one could rank the perennial streams by their stream flow and discharge to select only streams and water bodies that could sustain a large settled population. One final aspect that limited my predictive model was the number of known site locations. The number of known prehistoric settlement site locations that I received from the Washington State Department of Archaeology and Historic Preservation was so small that I did not have enough sites to break them apart into two sets, one for identifying the correlating variables and one for testing the overall accuracy of the model. Therefore if I had more site data I would be able to improve the model by measuring its accuracy.
  • 17. | 17D r e w C a r e y Sources Cited 1. Clement, Christopher Ohm. et al. (2010). Using GIS to Model and Predict Likely Archaeological Sites. ESRI & University of South Carolina. Retrieved April 10, 2013, from EBSCO host database. 2. Egeland, Charles P. et al. (2010). Using GIS and Ecological Variables to Identify High Potential Areas for Paleoanthropological Survey: An Example from Northern Armenia. Journal of Ecological Anthropology, 14(1). Retrieved April 10, 2013, from EBSCO host database. 3. Judge, James W. et al. (1988). Quantifying the Present and Predicting the Past: Theory, Method, and Application of Archaeological Predictive Modeling. Bureau of Land Management. Retrieved April 10, 2013, from EBSCO host database. 4. Kohler, Timothy A. et al. (1986). Predictive Models for Archaeological Resource Location. Advances in Archaeological Method and Theory, 9(1). Retrieved April 21, 2013, from Jstor database. 5. Leathwick, J.R. (2000). Predictive models of archaeological site distributions in New Zealand. New Zealand Department of Conservation. Retrieved April 10, 2013, from EBSCO host database. 6. Stilson, M. Leland, et al. (2003). A Field Guide to Washington State Archaeology. Washington State Department of Archaeology & Historic Preservation. Retrieved April 10, 2013, from <http://www.dahp.wa.gov/programs/archaeology>.
  • 18. | 18D r e w C a r e y Data Cited 1. 10 Meter Digital Elevation Models [Internet]. 2000. University of Washington: Department of Earth and Spaces Sciences; [cited 2013 April 10]. Available from: http://rocky.ess.washington.edu/data/raster/tenmeter/byquad/index.html 2. Archaeological Site Location Data [Internet]. 2013. Washington State Department of Archaeology and Historic Preservation; [cited 2013 May 12]. Obtained Upon Request from: http://www.dahp.wa.gov/ 3. Hydrography (by County) [Internet]. 2013. Washington State Department of Natural Resources; [cited 2013 April 10]. Available from: http://fortress.wa.gov/dnr/app1/dataweb/dmmatrix.html 4. Vegetated Land Cover [Internet]. 2006. NOAA: Coastal Change Analysis Program; [cited 2013 April 10]. Available from: http://www.csc.noaa.gov/digitalcoast/data/ccapregional 5. Whatcom County Boundary & Townships [Internet]. 2013. Whatcom County: Planning and Development Services; [cited 2013 April 10]. Available from: http://www.whatcomcounty.us/pds/gis/gisdata.jsp