Download to read offline
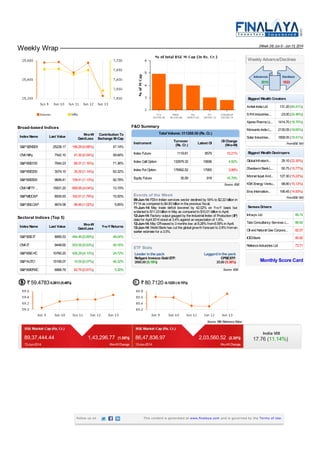

- Major Indian stock indices ended the week mixed, with the S&P BSE Sensex down 0.66% while the Nifty 50 fell 0.54%. - The information technology sector performed strongly over the week, with the S&P BSE IT index gaining 5.89% and the Nifty IT rising 5.63%. - Foreign direct investment in India's services sector declined 54% in fiscal year 2014 compared to the previous year, while the trade deficit narrowed in May but remained high at $11.23 billion.


