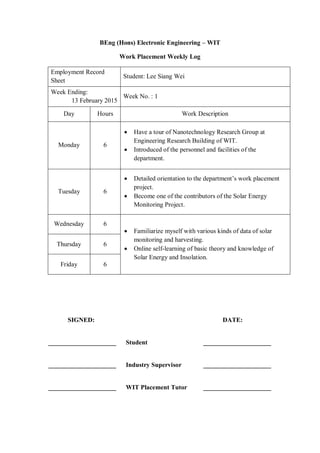
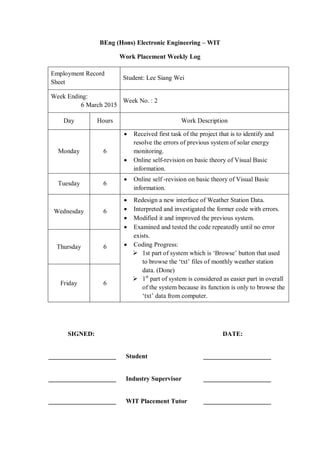
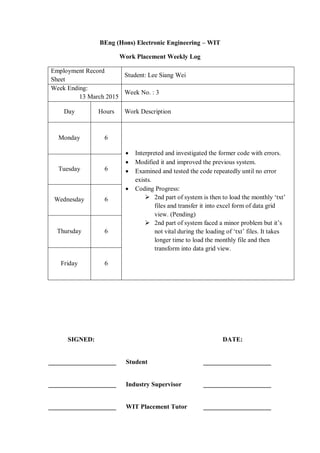
SlideShare a Scribd company logo
1 of 88
Download to read offline
Work Placement Industrial Report
Nanotechnology Research Group
Waterford Institute of Technology
Name: Lee Siang Wei
Year 3 Semester 2
Academic Year 2014/15
Department of Engineering Technology
School of Engineering
Waterford Institute of Technology,
Ireland.
Student Industrial Placement-WIT BEng (Hons) Electronic Engineering – 2014/15
i
Declaration
“The report submitted herewith is a result of my own works. All information that has been
obtained from other sources had been fully acknowledged. I understand that plagiarism
constitutes a breach of Institute rules and regulations and would be subjected to disciplinary
actions.”
Signature
-----------------------
Lee Siang Wei
Date:
Student Industrial Placement-WIT BEng (Hons) Electronic Engineering – 2014/15
ii
Acknowledgement
Firstly, I would like to thank my industrial supervisor who is also Principal Investigator of
Nanotechnology Research Group, Dr. Joseph O'Mahony for his positive attitude showed to
my work and supervision that truly helps the progression and smoothness of this internship
program. The co-operation is much indeed appreciated.
Secondly, I also like to thank to these people below:
 Yang Dong (Kevin)
Postgraduate Researcher at Nanotechnology Research Group
Development Engineer at Waterford Institute of Technology
 Shi Bo Cai (Cian)
Development Scientist at Waterford Institute of Technology
Part-Time Assistant Lecturer at Waterford Institute of Technology
for extending their friendship towards me and their guidance and knowledge, skill and for
encouraging me through this practical training since the first day I am in Nanotechnology
Research Group, then making a pleasure-training environment in the Nanotechnology
Workshops. With their all guiding and helping this report would be a reality.
Last but not least, I would like to express my heartfelt gratitude to my family members for
their support, concern and love. A paper is not enough for me to express the support and
guidance I received from them almost for all the work I did there
Student Industrial Placement-WIT BEng (Hons) Electronic Engineering – 2014/15
iii
Table of contents
Declaration................................................................................................................................i
Acknowledgement....................................................................................................................ii
Chapter 1: Introduction.............................................................................................1-11
1.1 : Objectives
1.2 : Position and Job Responsibilities during Work Placement
1.3 : Work Placement Organisation
1.3.1 WIN-IPT Profile
1.3.2 WIN-IPT Staff Person, Academic Partners and Industrial
Partners
1.3.2.1 Staff Person
1.3.2.2 Academic Partner
1.3.3 WIN-IPT Working Projects
Chapter 2: Projects, Tasks and Activities...............................................................12-41
2.1 : Weekly Tasks and Activities Description
2.2 : Programming Work
2.2.1 Description of coding of Solar Monitoring System
2.2.2 User Guide for Solar Monitoring System
2.3 : Office Work
2.3.1 Office work for WIT Weather Station
Chapter 3: Learning Outcomes………………………………………………..…42-43
Chapter 4: Conclusion..................................................................................................44
References............................................................................................................................45-46
Appendices.............................................................................................................................47
Student Industrial Placement-WIT BEng (Hons) Electronic Engineering – 2014/15
1
Chapter 1: Introduction
As one of the student of Engineering, we should proud that what have we have
study. This is because nowadays Engineering is one of the toughest courses in most
study road. That‘s why Accreditation of Engineering and Technology (ABET) define
it as, ―the profession in which knowledge of the mathematical and natural sciences
gained by study, experience and practice is applied with judgment to develop ways to
utilize, economically, the material and forces of nature for the benefit of mankind‖.
It is compulsory that all the Engineering students no matter him or her who
study in any college or university must undergo at least one time of work placement,
including School of Engineering, Waterford Institute of Technology. Work placement
in industry was introduced on the awareness that student can do their practical work
well with applying of Engineering theoretical knowledge gained during lecture. It is a
great opportunity provided to student to comprehend and appreciate real-life working
experience.
In this report, it describes the activities carried out during a 15-week, full-time
work placement at the Nanotechnology Research Group of Waterford Institute of
Technology. The document contains information about the organization and the
responsibilities performed throughout the period from 9 February until 5 June 2015.
The first part of the report offers an overview of the organization, followed by the
working tasks initially agreed upon with the Nanotechnology Group. Hence, it
continues to describe in some detail the most relevant projects carried out and their
respective analysis. Finally, the report ends with a few learning outcomes and
conclusions from this work placement.
At the beginning of the internship I formulated several learning goals, which I
wanted to achieve:
 to see what is like to work in a professional environment;
 to see if this kind of work is a possibility for my future career;
 to use my gained skills and knowledge and see what skills and knowledge I
still need to work in a professional environment;
 to get fieldwork experience/collect data in an environment unknown for me;
Student Industrial Placement-WIT BEng (Hons) Electronic Engineering – 2014/15
2
 to get experience in working in another country/with persons from another
culture;
 to enhance my interpersonal communication skills;
1.1 Objectives
Work placement provided:
 To prepare students for employment at the conclusion of their studies by
providing an opportunity to relate academic and practical aspects of their work.
 To acquaint students with first-hand knowledge of the various aspects of work as
they really are in the industry.
 To provide students with the opportunity to establish contact with the profession
of their choice, hoping that this may lead to employment after their graduation.
 To provide the industry an opportunity to assess in advance performance of its
potential employees.
1.2 Position and Job Responsibilities during Work Placement
During 15 weeks at here, I had been work as a research student in the group of
Nanotechnology Research Department of Waterford Institute of Technology. As a
research student, the scope of work is to complete programming work and
troubleshoot the code of incomplete Solar Monitoring System. Solar Monitoring
System is a system that generates final result of solar energy data, for examples daily
yield, daily irradiance, specific yield and performance ratio by inserting some of the
specific data into the system. These data are very valuable as we need them in order to
carry out a direct comparison between the region of Waterford, Ireland and Bangor,
Wales. At the same time, data collected from existing solar electricity generating sites
in both Ireland and Wales will also be gathered and compared in order to realistically
assess the potential for solar power in the cross-border region.
In this system, it contains a lot of debugging errors when the system is running.
Hence, I have to interpret and investigate the former error coding in order to find out
where is the actual location of them located. During the discovery of the error coding,
Student Industrial Placement-WIT BEng (Hons) Electronic Engineering – 2014/15
3
a modification and changes on the coding is indeed to keep the system running free of
errors even also improve the system. This process has to be tested repeatedly as when
an error exists at certain part of the code, it might not work well in the next coming
codes. Therefore, every time I have to examine the codes and test debug run of the
system after modifying the codes. After the completion of coding on this system, I
have to test the system whether it fully functioning or not by browsing the specific
data and then make a comparison on outcome data with previous data.
Furthermore, I have to analyse and organise all the solar monitoring data by
using the new-created system. As I early mentioned, these data are using to make a
comparison between 2 regions, therefore I need to make a performance analysis of
Waterford Weather Station for both the year 2014 and 2015. Inside performance
analysis, it contains a monthly summary on Solar Irradiance, System Yield, Specific
Yield, Performance Ratio and soon on. Moreover, graphical and schematic diagrams
for monthly and annual weather station data were also prepared to support the data
and provide a visual presentation of the data. These data will have been updated and
can be copied into the website as required. At last, I got to make another copy of
performance analysis for WIN-IPT in order to assimilate the format of the Weather
Station Data of Waterford with Weather Station Data of Bangor. This is because
WIN-IPT will need both of these data to develop a number of portable Solar Energy
Monitoring stations and carryout a direct comparison between the two regions.
I‘m feel honoured that can work with this group that offered me to learn lots of
programing skills, knowledge, and experiences on computer system and also the area
of Photovoltaic (PV) technologies. Furthermore, I also had been trained to be
a) Instil the qualities of integrity, responsibility and self-confident.
b) Instil spirit of teamwork and good relationship between students and workers..
c) Expose to actual working environment.
Student Industrial Placement-WIT BEng (Hons) Electronic Engineering – 2014/15
4
1.3 Work Placement Organisation
1.3.1 WIN-IPT Profile
WIN-IPT (stands for The Wales Ireland Network for Innovative Photovoltaic
Technologies) is an industry-driven initiative, designed to improve modernisation and
develop business opportunities for small and medium-sized enterprises (SMEs)
working in the area of Photovoltaic (PV) technologies. The PV sector is growing
rapidly, with annual growth rates exceeding 25% seen in the EU. Yet, with weak
R&D Infrastructure bases, the PV market is 1/200th
of the EU average in Ireland and
1/20th
in Wales. The development of a network of expertise to provide research-
informed knowledge, in addition to laboratory and manufacturing support, is required
to bring the cross-border PV market into line with EU norms.
Therefore, WIN-IPT will create an inter-regional (West Wales and South-East
Ireland) centre of PV expertise through knowledge transfer between higher education
research institutes, industry and local authorities. They are willing to provide direct
R&D assistance and consultancy services to SMEs in the PV sector. Specifically,
WIN-IPT will deliver direct R&D support to develop:
• Self-powered wireless sensors for building management and control
functions
• Self-powered lighting and display technologies for building navigation
• Low-cost printable photovoltaic device manufacturing processes
• Next generation Solar Cell technologies – Organic Photovoltaic (OPV)
In addition the network will monitor the performance of existing PV
electricity generators and investigate the potential for further exploitation of solar
energy in the cross-border region. WIN-IPT actions will result in a better informed
industry, with greater confidence for investing in PV and low carbon technologies.
Well, this 3-year initiative (2012–2014) is part-funded by the European Regional
Development Fund (ERDF), through the Ireland Wales Programme (INTERREG 4A).
Student Industrial Placement-WIT BEng (Hons) Electronic Engineering – 2014/15
5
1.3.2 WIN-IPT Staff Person, Academic Partners and Industrial Partners
There are 3 different academic organisation s from different country included in
various kind projects of WIN-IPT: Waterford Institute of Technology from Ireland,
Swansea University from United Kingdom, and lastly was Bangor University from
Wales. Below were the detail of staff and description of them:
1.3.2.1 Staff Person
a) Waterford Institute of Technology (WIT), Ireland
 Brian Murphy
 Joseph O‘Mahony
 Dong Yang (Kevin)
 Yiyang Sun (Bill)
 Daniel Tiemann
 Mandy O‘Neill
 Ken Deevy
 Eleanor Owens
 Panagiotis Manesiotis
 Mervin Doyle
 Colm Tynan
 Derek Sinnott
 Stephen Norton
b) Swansea University, UK
 David T. Gethin
 Tatyana V. Korochkina
 Tim Claypole
c) Bangor University
 Jeff Kettle
 James Wang
 Eva Campo
 Xianfeng Chen
Student Industrial Placement-WIT BEng (Hons) Electronic Engineering – 2014/15
6
1.3.2.2 Academic Partner
a) Waterford Institute of Technology, Waterford City, Ireland
 School of Engineering
The School is comprised of the departments of Architecture, Construction & Civil
Engineering, Engineering Technology, and Trade Studies. It provides professionally
accredited flexible pathways for lifelong learning in a variety of engineering,
architecture and built environment disciplines. It includes three Departments and is
home to a broad range of education courses and research programmes from Higher
Certificate to Doctorate at Levels 6-10 on the Irish National Framework of
Qualifications.
Besides, the students increasingly work in interdisciplinary teams to help solve real
world problems to gaining specialist individual knowledge and skills. Most of the
degree programmes also include an Industrial Placement semester in Ireland or
overseas. The innovative research activities are typically carried out in partnership
with local, national and international companies, organisations and communities.
 Pharmaceutical & Molecular Biotechnology Research Centre (PMBRC)
The Pharmaceutical and Molecular Biotechnology Research Centre (PMBRC) is an
applied research centre which aims to support the sustainable growth of the
pharmaceutical and healthcare industry in the south east of Ireland. Situated in the
heart of the region on the WIT campus, the centre seeks to stimulate research and
innovation, allowing companies to embed R&D into their activities.
The PMBRC has established links with national and international partners in industry,
academia and medical care institutions. The PMBRC Gateway is delivering solutions
for industry in the pharmaceutical and healthcare sectors in areas such as drug
delivery, process technology, biotechnology, biomedical and separation science.
PMCRC offers industry:
 Physico-chemical characterisation of materials.
 Advanced analytical capability.
 Formulation, process development and drug delivery
Student Industrial Placement-WIT BEng (Hons) Electronic Engineering – 2014/15
7
b) Swansea University, Singleton Park, Swansea, Wales
 Welsh Centre for Printing & Coating (WCPC)
WCPC is one of the World's leading centres for research and development of printing
and coating processes. The WCPC has expertise in screen, flexographic, lithographic,
rotogravure, digital and pad printing. In addition the WCPC also has experience in the
modelling of the print process, using techniques such as finite element, finite
difference and statistical and neural networks. The comprehensive laboratories are
fully equipped for sample analysis and characterization of material properties relevant
to the print process.
Furthermore, the WCPC has access to the extensive facilities within Swansea
University. The multi-disciplinary staff includes post-doctoral and PhD researchers
from both industrial and academic backgrounds, together with support staff. The
expertise in the fundamental science and its practical application to improving process
quality and productivity is used to provide assistance identified by individual
companies, problem solving or developing specific courses for the transfer of
information.
c) Bangor University, Dean Street, Bangor, Gwynedd, Wales
 School of Electronic Engineering
With an international reputation as a centre that undertakes both fundamental and
applied research into organic electronic materials and devices, the School of
Electronic Engineering encourages collaboration both nationally and
internationally. The excellent research facilities for organic electronics have been
instrumental in attracting collaboration from as far afield as Brazil, Germany, Japan,
Spain and Taiwan. Current research programmes include:
 Organic TFTs and circuits
 Organic memory
 Interfaces in organic devices
 Organic photovoltaics (OPVs)
 Sensors
 OLEDs
Student Industrial Placement-WIT BEng (Hons) Electronic Engineering – 2014/15
8
The School of Electronic Engineering has two main research themes:
 Optoelectronic Devices and Systems (ODS),
 Organic Electronics (OE),
with further activity in laser micromachining being undertaken in the University‘s
spin-out company UK LMC Ltd based in the OpTIC Technium in St Asaph. Through
a combination of basic, strategic and applied research these groups aim to develop
fundamental understanding of key physical mechanisms and also aim to develop
commercially exploitable technology.
Student Industrial Placement-WIT BEng (Hons) Electronic Engineering – 2014/15
9
1.3.3 WIN-IPT Working Projects
They have few of key projects: Organic Photovoltaic (OPV), Solar Monitoring,
Printed Devices, and lastly is Energy Harvesting.
a) Energy harvesting
Energy harvesting technologies provide a model replacement for traditional batteries
in applications where battery power is undesirable due to the cost associated with
battery replacement or where the use of batteries are prohibited due to practical access
limitations. These technologies are ideal for wireless sensors, especially in building
retrofit applications where direct power sources are unavailable or costly to
implement.
An energy harvester will gain energy from its ambient environment and convert it into
usable electrical energy, capable of powering small devices such as the ultra-low
power wireless sensor technology provided by Analog Devices, Ireland. Linking this
technology with the innovative high performance DSSC technology developed by
SolarPrint Ireland, WIN-IPT will demonstrate state-of-the-art energy harvesting
applications through the deployment of ambient powered Wireless Sensor Networks
for the control of energy use in a variety of buildings in the South-East of Ireland and
North Wales.
These buildings will range from historical public sites to ultra-modern high efficiency
buildings. Furthermore, WIN-IPT will combine this technology with the innovative
ASTRAL technology, developed by the Telecommunications Software & Systems
Group (TSSG) at WIT, to produce a novel building energy control product. Capable
of a simple retrofit into existing building stock, this product will assist building
managers to reduce the energy costs associated with the operation of their buildings.
b) Printed devices
Printing processes, such as screen printing, flexography, gravure, offset lithography
and inkjet, which are common to the graphic arts industry can be deployed for the
mass production of low-cost functional electronic devices such as thin film transistors,
solar cells and light emitting diodes.
Student Industrial Placement-WIT BEng (Hons) Electronic Engineering – 2014/15
10
The combination of printing expertise, available at the Welsh Centre for Printing and
Coating (WCPC) at Swansea University, and organic device development and
characterisation expertise, available at Bangor University and Waterford Institute of
Technology, will form an innovative research cluster to develop new technologies and
manufacturing processes for photovoltaic and photo emissive devices. This
knowledge cluster will work with industrial partners to develop specialised
conductive ink formulations that will lead to the development of novel devices.
c) Solar monitoring
North Wales and the South-East of Ireland share a common mild climate, with similar
sunshine patterns, and should therefore be capable of generating similar amounts of
solar electricity. While support for the roll-out of solar electricity generation is
comparatively strong in relation to other renewable sources in North Wales, the
opposite is the case for Ireland. Here the desire for increased fuel diversity has not
fully addressed the potential for solar power and the development of grid integration
solutions for renewables. WIN-IPT will address this shortfall in policy by comparing
solar energy yields on both sides of the cross-border region.
Working with innovative companies such as Egnitec and Pure Wafer Solar, WIN-IPT
will develop a number of portable Solar Energy Monitoring stations and carryout a
direct comparison between the two regions. Data collected from existing solar
electricity generating sites in both Ireland and Wales will also be gathered and
compared in order to realistically assess the potential for solar power in the cross-
border region.
Feeding into this will be a survey to determine the potential total rooftop solar
electricity yield for Waterford City in South-East Ireland. WIN-IPT Network‘s
activity will be guided by relevant industrial experiences to ensure that the barriers to
market roll-out can be addressed from the perspective of both the public and the
private sectors.
Student Industrial Placement-WIT BEng (Hons) Electronic Engineering – 2014/15
11
Solar Monitoring Data:
WIT SOLAR MONITORING FACILITY, Waterford City, Ireland (Latitude:
52.244886, Longitude: -7.140378)
BANGOR UNIVERSITY SOLAR MONITORING FACILITY, Dean Street, Bangor,
Gwynedd, LL57 1UT, Wales (Latitude: 53.22963, Longitude: -4.12402)
d) Organic Photovoltaic
Organic Photovoltaic (OPV) devices, based on small molecules and polymers, have
the potential to provide a low-cost alternative to silicon in the generation of solar
electricity. With reported laboratory power conversion efficiencies exceeding 10%,
and the potential for manufacture using suitable printing processes, OPV is an
exciting future technology.
Key outstanding issues to be addressed include:
 The identification of organic molecules/polymers that can be prepared in ink
formulation for printing
 Optimisation of the lifetime and performance of OPV devices
Of particular interest is the ability to integrate the manufacture of these devices with
other printable technologies to produce fully functional self-powered devices of high
reliability. WIN-IPT will work with industrial partners to develop a knowledge cluster
in the cross-border region to support this emerging technology.
Student Industrial Placement-WIT BEng (Hons) Electronic Engineering – 2014/15
12
Chapter 2: Projects, Tasks and Activities
During my work placement at Nanotechnology Research Group in WIT, I have
worked on different tasks, projects and activities. The projects and activities can be
divided into weekly tasks that involve programming work and office work that have
to be conducted at the actual events.
2.1 Weekly Tasks and Activities Description
Week 2 to week 9
 Redesign a new interface of Weather Station Data.
 Interpreted and investigated the former code with errors.
 Modified it and improved the previous system.
 Examined and tested the code repeatedly until no error exists.
 Tested the completed system whether it fully utilized or not.
Start from week 2, I have received the first task of my project that is to identify and
resolve the errors of previous system of Solar Energy Monitoring. The Solar Energy
Monitoring System is a system used to calculate and generate final result of solar
energy, for instances: daily yield, daily irradiance, specific yield and performance
ratio after gathering the MPP Data and Logfile Data. These results will then ready to
copy into the website as required after the documentation.
Meanwhile, it is Microsoft Visual Studio in base system which means that I can write
my programming coding and interface design in VB mode. At first, I need to redesign
a new interface of the system with more user-friendly and easy to use. I had made
minor changes on interface of this system. For instances: I set the bigger size of font
to let the user easy to recognize and won‘t be easily wrong press. In addition, I also
hide some of the buttons so that the user won‘t be confuse and follows the step when
they using of this system. The hidden buttons will be showed respectively when it
reaches its function. Below are some differences between previous system and new
created system:
Student Industrial Placement-WIT BEng (Hons) Electronic Engineering – 2014/15
13
Previous Solar Monitoring System
Student Industrial Placement-WIT BEng (Hons) Electronic Engineering – 2014/15
14
New Interface Solar Monitoring System
Student Industrial Placement-WIT BEng (Hons) Electronic Engineering – 2014/15
15
After design for the interface, I then started to interpreted and investigated the former
code in order to fix into my new-design system. When the errors exist, I need to
modified the codes in another way to keep the system running free of error even
improve the system. This process has to be done repeatedly as when an error exists at
certain part of the code, it might not work well in the next coming codes. Therefore,
every time I have to examine the codes and test debug run of the system after
modifying the codes. For the coding, I will explain more details in chapter 2.1.1.
Week 10 to week 15
 Collected the data at root top of Engineering Building of WIT.
 Managed and organised annual and monthly weather station data for year
2014 and 2015
 Prepared graph and schematic diagram for annual and monthly weather station
data.
 Summarised the annual and monthly weather station data by collection of
information.
During week 10, I was accompanied by Yang Dong in order to collect the MPP and
logfile Data from WIT solar monitoring facility which is the root top of engineering
building of WIT. The Solar Monitoring Facility at Waterford Institute of Technology
is comprised of
i) Weather Station - Davis Instrument Vantage Pro 2, with Solar Radiation
and UV Sensors
ii) PureWafer 235W Polycrystalline Silicon Solar Panel, inclined at 37
degrees to the horizontal
iii) Egnitec PVMS250 PV Measurement System, for logging PV data
Student Industrial Placement-WIT BEng (Hons) Electronic Engineering – 2014/15
16
PureWafer 235W Polycrystalline Silicon Solar Panel
Davis Instrument Vantage Pro 2
PVMS250 PV Measurement System
Student Industrial Placement-WIT BEng (Hons) Electronic Engineering – 2014/15
17
The Davis Instrument Vantage Pro2 weather station series function as to measure
barometric pressure, temperature, humidity, rainfall, wind speed and direction,
UV/solar(with additional of Solar Radiation and UV Sensor) and soon on. It consists
of 2 components: the Integrated Sensor Suite (ISS) which houses and manages the
external sensor array; and the weather station console which provides the user
interface, data display, A/D conversion and calculations. The Integrated Sensor Suite
(ISS) collects outside weather data and sends the data to a Vantage Pro2 console. The
standard version of the ISS contains a rain collector, temperature sensor, humidity
sensor and anemometer. Temperature and humidity sensors are mounted in a passive
radiation shield to minimize the impact of solar radiation on sensor readings. The
anemometer measures wind speed and direction and can be installed adjacent to the
ISS or apart from it.
Integrated Sensor Suite
Vantage Pro2 Weather Station console displays and records the station‘s weather data,
provides graph and alarm functions, and interfaces to a computer using the optional
WeatherLink® software. This instrument is actually where the output of Logfile Data
I used. Furthermore, Vantage Pro2 weather station also includes 2 additional sensors
which are UV Sensor and Solar Radiation Sensor. Solar Radiation and UV Sensors is
to measure global radiation, the sum at the point of measurement of both the direct
and diffuse components of solar irradiance. The sensor‘s transducer, which converts
Student Industrial Placement-WIT BEng (Hons) Electronic Engineering – 2014/15
18
incident radiation to electrical current, is a silicon photodiode with wide spectral
response. From the sensor‘s output voltage, the console calculates and displays solar
irradiance. It also integrates the irradiance values and displays total incident energy
over a set period of time.
Vantage Pro2 Weather Station console
The solar panel that our facility used to record the photovoltaic energy output is
PureWafer 235W Polycrystalline Silicon Solar Panel. In order to get the maximum
solar energy productivity, the solar panel we have inclined it at 37 degrees to the
horizontal. PVMS250 will then collect the measurement of PV output and record into
MPP Data file.
PureWafer 235W Polycrystalline Silicon Solar Panel
Student Industrial Placement-WIT BEng (Hons) Electronic Engineering – 2014/15
19
The PVMS250 unit is a dedicated photovoltaic measurement system. It incorporates a
maximum power point tracker (MPPT) and current-voltage (IV) curve tracing
capability, as well as two PT100 temperature sensor inputs. Between regular IV traces
the PV module under test can be maintained at specific operating conditions:
maximum power point (MPP), open circuit or short circuit.
PVMS250 Photovoltaic Measurement Systems
In order to let the user to get the data easily when using of this system, I had arranged
all the MPP Data and Logfile Data into a folder in sort of month and year. Afterwards,
I begin to manage and organise the MPP Data and Logfile Data by using the Solar
Monitoring System. This is because I need to make a performance analysis for the
year 2014 and year 2015. For the performance analysis, it contains of 12 months of
data and I have to make a monthly summary on Solar Irradiance, System Yield,
Specific Yield, and Performance Ratio for each month.
i) Solar Irradiance- Total solar energy was available.
ii) System Yield- Total of actual energy produced by the system.
iii) Performance Ratio- Measure of the quality of a PV system
iv) Specific Yield- Measure of energy produced per unit of installed capacity.
At the same time, I also have to prepare graphical diagram in order to support the data
and provide a visual presentation of the data above. Therefore, an annual summary
can be completed by doing this. Graphs and Data (including on Monthly Summary
sheet) will have been updated and can be copied into the website as required.
Student Industrial Placement-WIT BEng (Hons) Electronic Engineering – 2014/15
20
2.2 Programming Work
The projects that I have worked on during my work placement can be divided into the
following 5 parts, the figure below shown that the flow chart of Solar Monitoring
System.
Figure 2.1 Flow Chart of Solar Monitoring System
First part of system is to browse the monthly Logfile data of weather station data.
Inside this text file consists of various kinds of solar monitoring data: date, time,
temperature, wind speed, wind direction, humidity, solar radiation, solar energy and
soon on in every minute which are important for data processing and documentation.
For the second part, the function is to load the selected Logfile by clicking ‗load‘
button and then to transfer it into the excel form of data grid view. The purpose of 3rd
part is to calculate the average temperature, hourly and daily solar irradiation per day
based on the value of collected data (temperature and solar radiation) and solar
formulae. Each of the data will printed on the second data grid view by daily. The 4th
part of system is to fill in the PV (photovoltaic) data by inserting the certain month of
MPP Data which is in ‗csv‘ form of excel file. After inserting MPP Data, the system
Part 1:
Browse Button
Part 3:
Read Button
Part 2:
Load Button
Part 4:
PV Button
Part 5:
Save Button Solar
Monitoring
System
Student Industrial Placement-WIT BEng (Hons) Electronic Engineering – 2014/15
21
started to calculate hourly and daily PV output which is the power generated by
photovoltaic. Moreover, it also compute the specific yield and performance ratio
based on certain formulae. For the 5th part is the last part of system, is to transfer and
save all the processed data into excel form of data. The data saved in the form of excel
will be exactly same as the data that showed in the data grid view of the system.
2.2.1 Description of coding of Solar Monitoring System
Part 1: Browse Button
Figure 2.2 Function WeatherStationData_Load
Figure 2.2 shows that the default loading of Solar Monitoring System. I set that the
ability of each button except ‗Browse‘ button as false so that no user is pressing that
button before clicking the ‗Browse‘ button.
Figure 2.3 Function ButtonBrowse_Click
Student Industrial Placement-WIT BEng (Hons) Electronic Engineering – 2014/15
22
Figure 2.3 states that the function of button ‗Browse‘. I inserted a dialog function
called as ―FolderBrowserDialog‖ so that to let the user to search the Logfile Data
folder location in ‗txt‘ type of file from the PC. If there is a multiple Logfile Data in
that folder, it will repeat and continue add into the listbox until the last ‗txt‘ file. Once
the user selects any one of the Logfile Data from listbox, the system will enable the
button ‗Load‘ to ready for the next step.
Part 2: Load Button
Figure 2.4 Function ButtonLoad_Click
Figure 2.4 show that the function of button ‗Load‘. I had clear the row and set 38
columns of data grid view. This is because inside the Logfile Data has 38 columns of
different type of data, for examples: Solar Radiation, UV Index, Wind Direction,
Wind Speed, Temperature and soon on. A ―For Loop‖ is needed here to print out the
name index of each of data. After that, another ―For Loop‖ is needed to read the value
of row of Logfile Data. As we know, each row consists of collected various solar data
per minute. It takes some time to read the data as monthly logfile data consists of 43
thousand of rows to print into the DataGridView1, which is ―Weather Data Load‖ tab
control. After the completion of loop, the data grid view will add another row to
Student Industrial Placement-WIT BEng (Hons) Electronic Engineering – 2014/15
23
indicate that the progress is finish. Therefore, the system will proceed to another tab
control which is ―Weather Station Data‖ and the GroupBox1 which contains of button
‗Read‘ and button ‗PV‘ is enable to show for next function.
Figure 2.5 Function FillingResults
Figure 2.5 shows that the private sub function of FillingResults which is used to print
out each of the header name into DataGridView2. This function must be done before
the function of ‗Read‘ button because the header must be given to let the user know
the type of the value.
Part 3: Read Button
Figure 2.6 Function ButtonRead_Click
Figure 2.6 shows that the function of button ‗Read‘. After completion of running
function read(), it enable the ‗PV‘ button.
Student Industrial Placement-WIT BEng (Hons) Electronic Engineering – 2014/15
24
Figure 2.7 Function read()
Figure 2.7 shows the function read(). At first, I make some declaration on which data
on I used. Therefore, a ―For Loop‖ is needed to accumulate the total value of solar
radiation and temperature per day in order to get the average value of them. As you
can see, after accumulate every minute of the value of solar radiation and temperature,
‗samples‘ will also accumulate by 1 until the end of the day. It mean that the values
Student Industrial Placement-WIT BEng (Hons) Electronic Engineering – 2014/15
25
will then divided by ‗samples‘ which is total 1440 minutes (24 hours x 60 minutes) to
get the average value on that day. This step is keep repeated until the end of the month.
As I mentioned in Figure 2.1.4, each of the value of average temperature, hourly solar
irradiation and daily solar irradiation will then print on their column respectively day
by day.
Part 4: PV Button
Figure 2.8 Function ButtonPV_Click
Figure 2.8 shows the function of button ‗PV‘. As the same way as button ‗Browse‘, I
inserted ―FolderBrowserDialog‖ to let the user to search another type of file: MPP
Data in ‗csv‘ form. The ―While Loop‖ is place here to make sure the user to insert the
correct month of MPP Data with Logfile Data as a message box will appear to warn
the user to browse the MPP Data again and again until the right month of MPP Data
inserted. If the inserting of MPP data is same month of logfile data, then it will
continue run through the function of read2().
Student Industrial Placement-WIT BEng (Hons) Electronic Engineering – 2014/15
26
Figure 2.9 Function read2()
Once the system run here, it will calculate hourly and daily PV output which is the
power generated by photovoltaic. Moreover, it also compute the specific yield and
performance ratio based on certain formulae.
Student Industrial Placement-WIT BEng (Hons) Electronic Engineering – 2014/15
27
Part 5: Save Button
Figure 2.10 Function ButtonSave_Click
Figure 2.10 is the function of transferring and saving all the processed data into excel
form of data. The data saved in the form of excel will be exactly same as the data that
showed in the data grid view of the system. This part of system does not face lots of
problem as the coding run smoothly and data in excel file is exact the same with the
system.
Student Industrial Placement-WIT BEng (Hons) Electronic Engineering – 2014/15
28
2.2.2 User Guide for Solar Monitoring System
In order to use the system, below is the guidance of the way to access the Solar
Monitoring System.
1. Import the logfile data by clicking the ‗Browse‘ button.
i. It will bring u to a new interface that to browse for the folder, it is
recommend that put all the Logfile Data into a specific folder so that
easier to find the location.
ii. After select the folder where the Logfile Data put inside, click ‗OK‘
button to proceed to next step.
iii. The listbox will display the Logfile Data in ‗txt‘ type. The ‗Load‘
button is unable to click as none of the Logfile Data is choose.
Student Industrial Placement-WIT BEng (Hons) Electronic Engineering – 2014/15
29
2. Select any one of logfile data and press the button ‗Load‘.
i. The system will need some time to access the data and then transform
them into data grid view on the ―Weather Data Load‖ tab control page.
ii. After complete the loading, all the Logfile Data will display on the tab
control ―Weather Data Load‖.
3. Click the ‗Read‘ button to proceed the next step.
i. This step also need some time to run as it calculate the the average
temperature, hourly and daily solar irradiation per day based on the
data in logfile.
ii. After the completion of calculation, all the results will display on the
tab control of ―Processed Weather Data‖.
Student Industrial Placement-WIT BEng (Hons) Electronic Engineering – 2014/15
30
4. Import the MPP Data in ‗csv‘ type of excel file by pressing ‗PV‘ button.
i. Make sure that the month of MPP Data file must be exact the same
month with Logfile Data.
ii. Same as above, the system also need some time to run through the
calculation of hourly, daily PV output, specific yield and performance
ratio.
iii. The results will also show at the same page.
Student Industrial Placement-WIT BEng (Hons) Electronic Engineering – 2014/15
31
5. Press the ‗Save‘ button to save all the results in ―Processed Weather Data‖ and
transform into excel form.
Student Industrial Placement-WIT BEng (Hons) Electronic Engineering – 2014/15
32
2.3 Office Work
Once done for the programming part of Solar Monitoring System, I had got to begin
to manage and organise the MPP Data and Logfile Data by using the Solar
Monitoring System. This is because I need to make a performance analysis for the
year 2014 and year 2015. For the performance analysis, it contains of 12 months of
data and I have to make a monthly summary on Solar Irradiance, System Yield,
Specific Yield, and Performance Ratio for each month.
i) Solar Irradiance- Total solar energy was available.
ii) System Yield- Total of actual energy produced by the system.
iii) Performance Ratio- Measure of the quality of a PV system
iv) Specific Yield- Measure of energy produced per unit of installed capacity.
At the same time, I also have to prepare graphical diagram in order to support the data
and provide a visual presentation of the data above. Therefore, an annual summary
can be completed by doing this. Graphs and Data (including on Monthly Summary
sheet) will have been updated and can be copied into the website as required. At last, I
got to make another copy of performance analysis for WIN-IPT in order to assimilate
the format of the Weather Station Data of Waterford with Weather Station Data of
Bangor. This is because WIN-IPT will need both of these data to develop a number of
portable Solar Energy Monitoring stations and carryout a direct comparison between
the two regions.
Student Industrial Placement-WIT BEng (Hons) Electronic Engineering – 2014/15
33
2.3.1 Office work for WIT Weather Station
As I mentioned in my weekly log, I need to sum up some of the value respectively as
I need to make a summary of monthly and annually performance analysis on
Waterford Weather Station Data. There are a few values that I needed to calculate:
Daily Solar Irradiance, Daily Photovoltaic Output, Specific Yield, and Performance
Ratio. At here, I would like to explain each of these terms:
i) Daily Solar Irradiance is a measure of the solar energy (measured in
kWh/m2) by daily produced by the Sun in the form of electromagnetic
radiation.
ii) Daily PV Output is the amount of usable energy (measured in kWh)
produced by the system by daily after harvesting of solar energy.
iii) Specific Yield is the total annual energy generated per unit of installed
capacity (measure in kWh/kWp). It is often used to help determine the
financial value of an array and compare operating results from different
technologies and systems
iv) Performance Ratio is a measure of the quality of a PV system (including
BOS components) and its performance in a specific location –
dimensionless. It shows up losses due to shading, soiling, inverter losses,
irradiation, temperature etc. It is less dependent on irradiation levels than
specific yield. The formulae of performance ratio is given below:
(
( )
( )
)
Performance Ratio values:
>0.8 – good system
0.65-0.8 – average system
<0.65 – poor system
At first, I have to total up the values of Daily Solar Irradiance, Daily PV Output, and
also Specific Yield for specific month sheet. This is because I need the total amount
of Solar Irradiance and PV Output to calculate the average performance ratio for that
Student Industrial Placement-WIT BEng (Hons) Electronic Engineering – 2014/15
34
month. After that, I can make a calculation on Performance Ratio once I get the total
values for both Daily Solar Irradiance and Daily PV Output. By using the formula
given above, total of Daily PV Output divided by total of Daily Solar Irradiance and
also the peak power of PV which is 0.235 (as ours module the PV using is 235Wp).
Therefore, 2 graphical diagrams for both Daily Solar Irradiance and Daily PV Output
are required to support the data and provide a visual presentation of the data. This
procedure need to conduct for several times in order to make up the annually
performance analysis.
Student Industrial Placement-WIT BEng (Hons) Electronic Engineering – 2014/15
35
For the annually performance analysis, a new sheet is opened to copy the monthly
weather station data into here. As you can see, the values for each month of the PV
Output, Solar Irradiance, Specific Yield and Performance Ratio are copied into this
page in order to make a graphical diagram for the purpose of visualisation
presentation.
Student Industrial Placement-WIT BEng (Hons) Electronic Engineering – 2014/15
36
Besides, I have to prepare another performance analysis for WIN-IPT Weather Station
Data. I was given another Solar Monitoring System to do this. The new Solar
Monitoring System was using of database of Microsoft Access to run through the
program. Below is the user guide for Performance Database for WIN-IPT Weather
Station Data:
1. Open PV_performance.mdb (access database)
a. FIRST TIME ONLY – the user will need to delete all the records form the
tbl_WeatherData table
2. Import egnitec data
a. Move all MPP Data files into a folder
b. Open frmImportData
i. Import Folder by clicking ‗…‘, it will select folder where MPP
Data files are located.
ii. File Type – set to default mode ―Egnitec MPP_IV‖
iii. Click on ‗Validate‘, it should return with ―Validation Complete‖
and File Count will have the number of valid data files it found.
iv. Click on ―Process Data‖, it should return with ―Processing
Complete‖ and Record Count will have the number of import
records processed. Import File will have name of the file holding
the import records.
v. Click on ―Import Data‖, the user will be asked if they wish to
―Delete Existing Records from Table?‖ – (FIRST TIME ONLY)
select ―Yes‖ the first time to use this database (this will delete all
the existing Bangor data), otherwise ―No‖.
Student Industrial Placement-WIT BEng (Hons) Electronic Engineering – 2014/15
37
vi. The user may get a message warning that they won‘t be able to
undo the paste append – click ―Yes‖ to continue. The user will get
an ―Import Complete‖ message once the data has been imported.
3. Import Weather Data
a. Click on ―External Data‖ ribbon tab heading
b. Click on ―Text File‖ on the ―Import‖ section of the ribbon – this will bring
up ―Get External Data –Text File‖ dialog box
i. File name – select the weather Data Logfile.
ii. Click on ―Append a copy of the records to the table‖ radio button
iii. Select ―tbl_WeatherData‖ from combo list
iv. Click OK to bring up the ―Import Text Wizard‖ dialog
Student Industrial Placement-WIT BEng (Hons) Electronic Engineering – 2014/15
38
v. Click ―Advanced...‖ to bring up Import Specification dialog
vi. Click ―Specs...‖, select ―Weatherlink Import Specification‖ from
list and Click on ―Open‖. This will open the ―Weatherlink Import
Specification‖ in the Import spec dialog.
Student Industrial Placement-WIT BEng (Hons) Electronic Engineering – 2014/15
39
vii. Click ―OK‖ to bring back to the Import text File dialog.
viii. Click ―Finish‖ to import the data.
ix. Access will come back with ―Access unable to append all the data
to the table‖
x. Click ―Yes‖ to proceed with appending data to table.
xi. ―Save Import Steps‖ dialog will be displayed. Click ―Close‖.
4. Extract Performance Monitoring Data
a. Open ―PV_Performance_2015.xlsx‖ excel spreadsheet
b. Open frmExportData form in Access – it might take a while to load, as
it builds a list of valid export months.
c. Select the month for which you wish to extract data.
d. Click on ―Daily Yield‖ to extract daily yield data (it might take a while
to run!). A query will be displayed with the data records.
e. Copy the data to the clipboard - Right click on box at top left of query
and select ―Copy‖
Student Industrial Placement-WIT BEng (Hons) Electronic Engineering – 2014/15
40
f. Switch to the spread sheet and select cell A27 and paste the data.
g. This will update the data on the spread sheet and the associated graph
and calculated monthly totals. The spread sheet was designed with two
modules in mind, so I will probably have to change it a bit as I only
have one module.
h. Repeat for ―Solar Energy‖ and ―Monitoring Availability‖ (use the
―Monitoring Availability (Post May 2014)‖ button), pasting into cells
indicated above.
5. Monthly Summary –I will need to change formulae for Specific Yield, for
ours module is 235Wp.
6. Graphs and Data (including on Monthly Summary sheet) will now have been
updated and can be copied into the website as required.
Student Industrial Placement-WIT BEng (Hons) Electronic Engineering – 2014/15
41
On a monthly basis:
Monitoring Availability: a measure of what was measured and when was it
measured, it is very useful as a guide to how accurate
the other figures are.
Energy Yield : a measure of actual energy produced (in kWh).
Daily Irradiance : a measure of how much energy was available (in
kWh/m2).
Therefore, I got to calculate performance figures like Energy Yield, Specific Yield,
Performance Ratio & Total Irradiation based on certain formulae. On an annual basis
I need to report monthly totals for System Yield and Irradiation, Specific Yield and
Performance Ratio like the same way as WIT Weather Station Data.
Student Industrial Placement-WIT BEng (Hons) Electronic Engineering – 2014/15
42
Chapter 3: Learning Outcomes
Work placement is the beginning of the road that will lead me what I want to be at
after my graduation. Besides, it provides a good opportunity for me to practice I need
to perform and also prepares me for the future life that I aim at. In this chapter I will
reflect on my work placement.
 Improving of Practical Skill
The work placement let me have the opportunity to connect the learning of theory in
the class with current industry challenges, and have exposure to the latest
technologies. It was exactly what I needed to foster the lack of practical skills I had.
For example, I had learnt of programming language and done a mini assignment on
this programming during last semester and this work placement provide me a great
chance to apply my programming knowledge fully on Solar Monitoring System. I
would acquire practical experience to complement the theoretical content of my
studies. In addition, I was taught some basics on data collection, data processing and
setting-up research projects.
 Learning of New Theoretical Knowledge
During my work placement period in the Nanotechnology Research Group of WIT, it
was a new learning on my theoretical knowledge, when I have been learned the
course of Electronics Engineering in the classroom. Through this work placement, I
had been learnt more about the knowledge on renewable energy which is solar energy
and also photovoltaic system. This knowledge might be helpful for me to search for
my future career.
 Enhancing of Interpersonal Communication Skills
During my work placement period, the Interpersonal skills, the skills I use every day
to communicate and interact with other people, are greatly improved for me. Not only
how I communicate with others, but also I got confidence and my ability to listen and
understand. Problem solving, decision making and personal stress management are
also considered interpersonal skills. Through this internship, I found that I gained
many new perspectives, such as problem solving skill, diversity, and good
Student Industrial Placement-WIT BEng (Hons) Electronic Engineering – 2014/15
43
communication, attention to detail, time management, self-confidence, responsibility
and cultural sensitivity. Although I was reserved in communication at the beginning
due to my main language is Chinese language but in the course of months it went
better. This is because an interesting and open attitude of the people has helped me a
lots in this field. Besides, my supervisor was so kind to answer with patience and
teach me much that made this work placement so enjoyable. I had gotten a wonderful
internship that spent such a happy moment with all of them.
 Work Ethics Related Issue
A work placement is an opportunity to learn the skills and behaviours along with the
work values that are required for success in the workplace. Workplace ethics are
established codes of conduct that reflect the values of the organization or company
where you are employed. I have seen possess a willingness to work hard from my
supervisor during my work placement period. In addition to working hard it is also
important to work smart. This means I acquired the most efficient way to complete
tasks and finding ways to save time while completing daily tasks. It‘s also important
to care about my job and complete all projects while maintaining a positive attitude.
Student Industrial Placement-WIT BEng (Hons) Electronic Engineering – 2014/15
44
Chapter 4 Conclusion
After going through the whole period of work placement as a research student, I‘ve
observed so many professional activities and learnt them as well. One main thing that
I have learned through this internship is time management skills as well as self-
motivation. When I first started I did not think that I was going to be able to make
myself sit in an office for six hours a day, five days a week. Once I realized what I
had to do I organized my day and work so that I was not overlapping or wasting my
hours. I learned that I needed to be organized and have questions ready for when it
was the correct time to get feedback.
From this work placement and time management I had to learn how to motivate
myself through being in the office for so many hours. I came up with various
proposals and ideas that the group is still looking into using. This work placement
program was very fruitful to me because I had to cover many different fields not only
cultural part. I also learnt new concepts and new ways of working. During this period
I acquired practical experience to complement the theoretical content of my study for
campus WIT.
In conclusion, this practical training has exposed me with the technical working
environment as my preparation to join the workforce upon my completion studies.
This work placement experience also helps in producing well-balanced graduates who
are not only technically competent but also skilled in interpersonal communication,
which is the main moving force of advancement. This work placement was definitely
beneficial for me and I‘m grateful and thankful that I got to experience and learn
many things.
Student Industrial Placement-WIT BEng (Hons) Electronic Engineering – 2014/15
45
References
About the Welsh Centre for Printing and Coating in Welsh Centre for Printing and
Coating. Retrieve from
http://wcpcswansea.com/about/
About WIN-IPT in Wales Ireland Network for Innovative Photovoltaic Technologies.
Retrieved from
http://www.winipt.eu/index.php/about/ , http://www.winipt.eu/index.php/projects/
Integrated Sensor Suite Installation Manual in Davis Instruments Corp. . Retrieved
from
http://www.davisnet.com/product_documents/weather/manuals/07395-
249_IM_06152.pdf
PMBRC Gateway - Pharmaceutical & Healthcare in Enterprise Ireland. Retrieved
from
http://www.enterprise-ireland.com/en/research-innovation/companies/collaborate-
with-companies-research-institutes/technology-gateway-pmbrc.html
PVMS Photovoltaic Measurement Systems—Specification in Engitec. Retrieved from
http://www.egnitec.com/downloads/PVMS_Unit_Spec_(1.0).pdf
Research in the School of Electronic Engineering in Bangor University. Retrieved
from
http://www.bangor.ac.uk/eng/research.php.en
Student Industrial Placement-WIT BEng (Hons) Electronic Engineering – 2014/15
46
School of Engineering-Welcome in Waterford Institute of Technology. Retrieved from
http://www.wit.ie/schools/engineering/school_of_engineering
Vantage Pro2 Console Manual in Davis Instruments Corp. . Retrieved from
http://www.davisnet.com/product_documents/weather/manuals/07395-
234_IM_06312.pdf
Student Industrial Placement-WIT BEng (Hons) Electronic Engineering – 2014/15
47
Appendices
Appendix I
Weekly Logs
BEng (Hons) Electronic Engineering – WIT
Work Placement Weekly Log
Employment Record
Sheet
Student: Lee Siang Wei
Week Ending:
13 February 2015
Week No. : 1
Day Hours Work Description
Monday 6
 Have a tour of Nanotechnology Research Group at
Engineering Research Building of WIT.
 Introduced of the personnel and facilities of the
department.
Tuesday 6
 Detailed orientation to the department‟s work placement
project.
 Become one of the contributors of the Solar Energy
Monitoring Project.
Wednesday 6
 Familiarize myself with various kinds of data of solar
monitoring and harvesting.
 Online self-learning of basic theory and knowledge of
Solar Energy and Insolation.
Thursday 6
Friday 6
SIGNED: DATE:
_____________________ Student _____________________
_____________________ Industry Supervisor _____________________
_____________________ WIT Placement Tutor _____________________
BEng (Hons) Electronic Engineering – WIT
Work Placement Weekly Log
Employment Record
Sheet
Student: Lee Siang Wei
Week Ending:
6 March 2015
Week No. : 2
Day Hours Work Description
Monday 6
 Received first task of the project that is to identify and
resolve the errors of previous system of solar energy
monitoring.
 Online self-revision on basic theory of Visual Basic
information.
Tuesday 6
 Online self -revision on basic theory of Visual Basic
information.
Wednesday 6
 Redesign a new interface of Weather Station Data.
 Interpreted and investigated the former code with errors.
 Modified it and improved the previous system.
 Examined and tested the code repeatedly until no error
exists.
 Coding Progress:
 1st part of system which is „Browse‟ button that used
to browse the „txt‟ files of monthly weather station
data. (Done)
 1st
part of system is considered as easier part in overall
of the system because its function is only to browse the
„txt‟ data from computer.
Thursday 6
Friday 6
SIGNED: DATE:
_____________________ Student _____________________
_____________________ Industry Supervisor _____________________
_____________________ WIT Placement Tutor _____________________
BEng (Hons) Electronic Engineering – WIT
Work Placement Weekly Log
Employment Record
Sheet
Student: Lee Siang Wei
Week Ending:
13 March 2015
Week No. : 3
Day Hours Work Description
Monday 6
 Interpreted and investigated the former code with errors.
 Modified it and improved the previous system.
 Examined and tested the code repeatedly until no error
exists.
 Coding Progress:
 2nd part of system is then to load the monthly „txt‟
files and transfer it into excel form of data grid
view. (Pending)
 2nd part of system faced a minor problem but it‟s
not vital during the loading of „txt‟ files. It takes
longer time to load the monthly file and then
transform into data grid view.
Tuesday 6
Wednesday 6
Thursday 6
Friday 6
SIGNED: DATE:
_____________________ Student _____________________
_____________________ Industry Supervisor _____________________
_____________________ WIT Placement Tutor _____________________
BEng (Hons) Electronic Engineering – WIT
Work Placement Weekly Log
Employment Record
Sheet
Student: Lee Siang Wei
Week Ending:
20 March 2015
Week No. : 4
Day Hours Work Description
Monday 6
 Interpreted and investigated the former code with errors.
 Modified it and improved the previous system.
 Examined and tested the code repeatedly until no error
exists.
 Coding Progress:
 2nd part of system is then to load the monthly „txt‟
files and transfer it into excel form of data grid
view. (Done)
Tuesday 6
Wednesday 6
Thursday 6
Friday 6
SIGNED: DATE:
_____________________ Student _____________________
_____________________ Industry Supervisor _____________________
_____________________ WIT Placement Tutor _____________________
BEng (Hons) Electronic Engineering – WIT
Work Placement Weekly Log
Employment Record
Sheet
Student: Lee Siang Wei
Week Ending:
27 March 2015
Week No. : 5
Day Hours Work Description
Monday 6
 Interpreted and investigated the former code with errors.
 Modified it and improved the previous system.
 Examined and tested the code repeatedly until no error
exists.
 Coding Progress:
 3rd
part of system is to calculate the average
temperature, hourly and daily solar irradiation based
on the value of collected data and solar formulae.
(Pending)
 3rd
part of system is one of the complicated parts
because the code still consisting errors and will not
return to its real value.
Tuesday 6
Wednesday 6
Thursday 6
Friday 6
SIGNED: DATE:
_____________________ Student _____________________
_____________________ Industry Supervisor _____________________
_____________________ WIT Placement Tutor _____________________
BEng (Hons) Electronic Engineering – WIT
Work Placement Weekly Log
Employment Record
Sheet
Student: Lee Siang Wei
Week Ending:
3 April 2015
Week No. : 6
Day Hours Work Description
Monday 6
 Interpreted and investigated the former code with errors.
 Modified it and improved the previous system.
 Examined and tested the code repeatedly until no error
exists.
 Coding Progress:
 3rd
part of system is the „read‟ button functions as to
read the data in excel form and calculate the average
temperature, hourly and daily solar irradiation based
on the value of collected data and solar formulae.
(Done)
 Finally the values of hourly and daily solar
irradiance return to its real value.
 This is because some of the coding has mixed
together and caused the errors exists.
Tuesday 6
Wednesday 6
Thursday 6
Friday 6
SIGNED: DATE:
_____________________ Student _____________________
_____________________ Industry Supervisor _____________________
_____________________ WIT Placement Tutor _____________________
BEng (Hons) Electronic Engineering – WIT
Work Placement Weekly Log
Employment Record
Sheet
Student: Lee Siang Wei
Week Ending:
10 April 2015
Week No. : 7
Day Hours Work Description
Monday 6
 Interpreted and investigated the former code with errors.
 Modified it and improved the previous system.
 Examined and tested the code repeatedly until no error
exists.
 Coding Progress:
 4th
part of system is to calculate the hourly, daily
PV output, specific yield and performance ratio on
certain month based on certain formulae by
inserting Excel „csv‟ files which is consist of MPP
data. (Pending)
 While the MPP data consists of Impp, Vmpp,
Module Temperature 1&2 and Err. Impp and Vmpp
are MPP current and MPP voltage that hold the
current and voltage reading taken at specific time.
Meanwhile, Module Temperature 1&2 are PT 100
temperature from sensor 1&2. Err is the current
operating status of the unit.
 Encountered a problem that sometimes it can‟t load
the Excel csv file and also stuck at 12th
line of row.
Tuesday 6
Wednesday 6
Thursday 6
Friday 6
SIGNED: DATE:
_____________________ Student _____________________
_____________________ Industry Supervisor _____________________
_____________________ WIT Placement Tutor _____________________
BEng (Hons) Electronic Engineering – WIT
Work Placement Weekly Log
Employment Record Sheet Student: Lee Siang Wei
Week Ending:
17 April 2015
Week No. : 8
Day Hours Work Description
Monday 6  Interpreted and investigated the former code with errors.
 Modified it and improved the previous system.
 Examined and tested the code repeatedly until no error
exists.
 Coding Progress:
 4th
part of system is to calculate the hourly, daily
PV output, specific yield and performance ratio on
certain month based on certain formulae by
inserting Excel „csv‟ files which is consist of MPP
data. (Done)
 The problem solved by modifying the codes. This is
because the „temppath‟ of the coding didn‟t match
the original path name of Excel „csv‟ files.
Tuesday 6
Wednesday 6
Thursday 6
Friday 6
SIGNED: DATE:
_____________________ Student _____________________
_____________________ Industry Supervisor _____________________
_____________________ WIT Placement Tutor _____________________
BEng (Hons) Electronic Engineering – WIT
Work Placement Weekly Log
Employment Record
Sheet
Student: Lee Siang Wei
Week Ending:
24 April 2015
Week No. : 9
Day Hours Work Description
Monday 6
 Interpreted and investigated the former code with errors.
 Modified it and improved the previous system.
 Examined and tested the code repeatedly until no error
exists.
 Tested the completed system whether it utilised or not.
 Coding Progress:
 5th
part of system is to save all the processed data
and transferred all of them into excel files. (Done)
Tuesday 6
Wednesday 6
Thursday 6
Friday 6
SIGNED: DATE:
_____________________ Student _____________________
_____________________ Industry Supervisor _____________________
_____________________ WIT Placement Tutor _____________________
BEng (Hons) Electronic Engineering – WIT
Work Placement Weekly Log
Employment Record
Sheet
Student: Lee Siang Wei
Week Ending:
1 May 2015
Week No. : 10
Day Hours Work Description
Monday 6
 Collected the data at root top of Engineering Building of
WIT.
 Arranged MPP Data and Logfile Data into a folder in sort
of month and year.
 Managed and organised annual and monthly weather
station data for year 2014.
 Prepared graph and schematic diagram for annual and
monthly weather station data.
 Summarised the annual and monthly weather station data
by collection of information.
Tuesday 6
Wednesday 6
Thursday 6
Friday 6
SIGNED: DATE:
_____________________ Student _____________________
_____________________ Industry Supervisor _____________________
_____________________ WIT Placement Tutor _____________________
BEng (Hons) Electronic Engineering – WIT
Work Placement Weekly Log
Employment Record
Sheet
Student: Lee Siang Wei
Week Ending:
8 May 2015
Week No. : 11
Day Hours Work Description
Monday 6
 Managed and organised annual and monthly weather
station data for year 2014.
 Prepared graph and schematic diagram for annual and
monthly weather station data.
 Summarised the annual and monthly weather station data
by collection of information.
Tuesday 6
Wednesday 6
Thursday 6
Friday 6
SIGNED: DATE:
_____________________ Student _____________________
_____________________ Industry Supervisor _____________________
_____________________ WIT Placement Tutor _____________________
BEng (Hons) Electronic Engineering – WIT
Work Placement Weekly Log
Employment Record
Sheet
Student: Lee Siang Wei
Week Ending:
15 May 2015
Week No. : 12
Day Hours Work Description
Monday 6
 Managed and organised annual and monthly weather
station data for year 2014.
 Prepared graph and schematic diagram for annual and
monthly weather station data.
 Summarised the annual and monthly weather station data
by collection of information.
Tuesday 6
Wednesday 6
Thursday 6
Friday 6
SIGNED: DATE:
_____________________ Student _____________________
_____________________ Industry Supervisor _____________________
_____________________ WIT Placement Tutor _____________________
BEng (Hons) Electronic Engineering – WIT
Work Placement Weekly Log
Employment Record
Sheet
Student: Lee Siang Wei
Week Ending:
22 May 2015
Week No. : 13
Day Hours Work Description
Monday 6
 Managed and organised annual and monthly weather
station data for year 2014.
 Prepared graph and schematic diagram for annual and
monthly weather station data.
 Summarised the annual and monthly weather station data
by collection of information.
Tuesday 6
Wednesday 6
Thursday 6
Friday 6
SIGNED: DATE:
_____________________ Student _____________________
_____________________ Industry Supervisor _____________________
_____________________ WIT Placement Tutor _____________________
BEng (Hons) Electronic Engineering – WIT
Work Placement Weekly Log
Employment Record
Sheet
Student: Lee Siang Wei
Week Ending:
29 May 2015
Week No. : 14
Day Hours Work Description
Monday 6
 Managed and organised annual and monthly weather
station data for year 2015.
 Prepared graph and schematic diagram for annual and
monthly weather station data.
 Summarised the annual and monthly weather station data
by collection of information.
Tuesday 6
Wednesday 6
Thursday 6
Friday 6
SIGNED: DATE:
_____________________ Student _____________________
_____________________ Industry Supervisor _____________________
_____________________ WIT Placement Tutor _____________________
BEng (Hons) Electronic Engineering – WIT
Work Placement Weekly Log
Employment Record
Sheet
Student: Lee Siang Wei
Week Ending:
5 June 2015
Week No. : 15
Day Hours Work Description
Monday 6
 Managed and organised annual and monthly weather
station data for year 2015.
 Prepared graph and schematic diagram for annual and
monthly weather station data.
 Summarised the annual and monthly weather station data
by collection of information.
Tuesday 6
Wednesday 6
Thursday 6
Friday 6
SIGNED: DATE:
_____________________ Student _____________________
_____________________ Industry Supervisor _____________________
_____________________ WIT Placement Tutor _____________________
Appendix II
Monthly Progress Report
Week Beginning: 9th
February 2015
Week Ending: 27th
February 2015
For the 1st
week of my internship, I take part in a tour of the Nanotechnology
Research Group at Engineering Research Building of WIT and was introduced to
various personnel. Lots of facilities and utensils of the department were also
introduced on their general use of application and instruction to using them.
Following the coming next day, a detailed orientation to the several of internship
programs were announced by my internship supervisor. I received my special project
assignment and then began to experience the Solar Monitoring Division.
WIN-IPT (stands for The Wales Ireland Network for Innovative Photovoltaic
Technologies) is an industry-driven initiative, designed to promote invention and
develop business opportunities for small and medium-sized enterprises (SMEs)
working in the area of Photovoltaic (PV) technologies. They have few of key projects:
Organic Photovoltaic (OPV), Solar Monitoring, Printed Devices, and lastly is Energy
Harvesting. As I mentioned from above, I was assign to the Solar Monitoring division.
This division is to develop a number of portable Solar Energy Monitoring stations and
carryout a direct comparison between Bangor (North Wales) and Waterford (South-
East of Ireland). Data collected from existing solar electricity generating sites in both
Ireland and Wales will also be gathered and compared in order to accurately assess
the potential for solar power in the cross-border region. WIN-IPT will comparing
solar energy yields on both sides of the cross-border region. Meanwhile, the solar
monitoring data consists of 2 facilities which is WIT Solar Monitoring Facility and
Bangor University Solar Monitoring Facility.
In this division, I have to familiarize myself as soon as possible with numerous kinds
of solar monitoring data such as Logfile, MPP (Maximum Power Point) Data, IV
Main, and IV Data. Logfile stores extra information (maximum and minimum
temperature, humidity, wind speed, wind direction, solar energy and soon on) for each
unit. MPP Data file holds each set of MPP measurements (current, voltage, 2x module
temperatures) as well as an indicator of system operating status. IV Main file holds
one record for each IV curve and IV Data file holds each of the current-voltage points
on the curve as a separate record. These data are collected from the root top of
Engineering Building of WIT by PVMS250 unit. The PVMS250 unit is a dedicated
photovoltaic measurement system. It incorporates a maximum power point tracker
(MPPT) and current-voltage (IV) curve tracing capability, as well as two PT100
temperature sensor inputs. At the same time, I also make my online learning of basic
theory and knowledge of Solar Insulation and Photovoltaic technologies in order to
fix myself into this division.
SIGNED: DATE:
_____________________ Student _____________________
_____________________ Industry Supervisor _____________________
_____________________ WIT Placement Tutor _____________________
Monthly Progress Report
Week Beginning: 2nd
March 2015
Week Ending: 27th
March 2015
Start from this week, I have received the first task of my project that is to identify and
resolve the errors of previous system of Solar Energy Monitoring. The Solar Energy
Monitoring System is a system used to calculate and generate final result of solar
energy, for instances: daily yield, daily irradiance, specific yield and performance
ratio after gathering the MPP Data and Logfile Data. At the same time, I have to make
revision on basic theory of Visual Basic myself again by online learning.
As my main task of this project is to resolve the Solar Energy Monitoring System, I
need to redesign a new interface of the system. It used me up to few hours to redesign
so that to make the system more user-friendly and easy to use. This week onwards, I
have started to interpreted and investigated the former code in order to fix into my
new-design system. When the errors exist, I need to make some changes on the codes
to keep the system running free of error even also improve the system. This process
has to be done repeatedly as when an error exists at certain part of the code, it might
not work well in the next coming codes. Therefore, every time I have to examine the
codes and test debug run of the system after modifying the codes.
Back to my programming project, I divided it into five parts. First part of system is to
browse the monthly Logfile data of weather station data. Inside this text file consists
of various kinds of solar monitoring data: date, time, temperature, wind speed, wind
direction, humidity, solar radiation, solar energy and soon on in every minute which
are important for data processing and documentation. At first, a „browse‟ button is
created to show the Logfile onto the listbox of the system. The code is written to
access the computer file system in order to search the Logfile in„txt‟ type. As there are
many of Logfile where we place together into a folder, therefore a “For Loop” is used
to repeat the searching and adding of Logfile onto the listbox. This part of system is
considered as easier part compare with other parts of system due to its browsing and
adding text file function from the computer.
For the second part, the function is to load the selected Logfile by clicking „load‟
button and then to transfer it into the excel form of data grid view. Firstly, I have to
clear the row and set 38 columns of data grid view. This is because the Logfile has 38
columns of different type of data. After that, a “For Loop” is needed to read the row
of Logfile data. As we know, each row consists of collected various solar data per
minute. It takes some time to read the data as monthly Logfile data consists of 43
thousand of rows to transfer into the data grid view. I tried to modify the codes in
order to minimise the loading time of Logfile but at the last I maintain the coding as
well because it showing more and more errors after edit the coding.
On the last week of this month, I was on my way to complete the part 3 of the solar
monitoring system. It is one of the complicated parts in overall system because it
contains of calculation and formulae of certain data. Meanwhile, it also consists of
many debug errors when I start to run the default system as the value of solar
irradiation doesn‟t return to its value. During this week, I was spent my time in
inspecting and analysing the way to solve these problem existed.
SIGNED: DATE:
_____________________ Student _____________________
_____________________ Industry Supervisor _____________________
_____________________ WIT Placement Tutor _____________________
Monthly Progress Report
Week Beginning: 3th
April 2015
Week Ending: 24th
April 2015
During this month, I was still continuing my last work of my project which is part 3 of
the system. I found out that the coding had mixed together with part 4 of the system.
For example, when the data for certain column is allocated in column 7, it is supposed
no other data overlap again in that column as it causes the latest data might
interchange with the oldest data. As a result, this effects to the accuracy of data and
the final calculation of solar irradiation. After that, I have made some changes in the
coding and keep testing for the debug run. Finally the values of hourly and daily solar
irradiance return to its real value.
The purpose of this part is to calculate the average temperature, hourly and daily solar
irradiation per day based on the value of collected data (temperature and solar
radiation) and solar formulae. Each of the data will printed on the second data grid
view by daily. I have modified the coding that to accumulate all the total value of
temperature and solar radiation per day, therefore divided by „sample‟ which is total
1440 minutes (24 hours x 60 minutes) to get the average value on that day. This step
is keep repeated until the end of the month.
The 4th
part of system is to fill in the PV (photovoltaic) data by inserting the certain
month of MPP Data which is in „csv‟ form of excel file. After inserting MPP Data, the
system started to calculate hourly and daily PV output which is the power generated
by photovoltaic. Moreover, it also compute the specific yield and performance ratio
based on certain formulae. MPP data consists of Impp, Vmpp, Module Temperature
1&2 and Err. Impp and Vmpp are MPP current and MPP voltage that hold the current
and voltage reading taken at specific time. Meanwhile, Module Temperature 1&2 are
PT 100 temperature from sensor 1&2. Err is the current operating status of the unit.
The time taken for MPP Data is from 4am to 10.59pm in minute every day, there is a
total of 4 records of Impp, Vmpp, Module Temperature 1&2 and Err in a minute.
In this part of system, I found that the certain „MPP Data no found‟ message box keep
showing when the debugging time. After I figure out the problem it comes from the
name of the inserting MPP Data. This is because the system won‟t run smoothly
without the exact same name of the MPP Data file, as the MPP Data file is exact the
same name just the date is different. Besides, the way of this part is almost same like
part 3, if the inserting of MPP data is same month of Logfile data, then it should be
run smoothly throughout the system. On the other side, a message box will appear and
state that the error occurs. All the value calculated will be showed zero due to the
correctness of MPP Data. In order to correct the data again, you have to insert the
correct MPP Data again so let the system to get the correct data.
For the 5th
part is the last part of system, is to transfer and save all the processed data
into excel form of data. The data saved in the form of excel will be exactly same as
the data that showed in the data grid view of the system. This part of system does not
face lots of problem as the coding run smoothly and data in excel file is exact the
same with the system.
SIGNED: DATE:
_____________________ Student _____________________
_____________________ Industry Supervisor _____________________
_____________________ WIT Placement Tutor _____________________
Monthly Progress Report
Week Beginning: 27th
April 2015
Week Ending: 5th
June 2015
After done the coding of my project, I have to test the system whether it fully utilised
or not. I have browse for the MPP and Logfile Data from 2014 and then print out the
result in order to compare with the previous data. If the comparison of data is same, it
mean that the system run smoothly.
On the 1st
week of May, I was accompanied by Yang Dong in order to collect the
MPP and Logfile Data from WIT solar monitoring facility which is the root top of
engineering building of WIT. The Solar Monitoring Facility at Waterford Institute of
Technology is comprised of
i) Weather Station - Davis Instrument Vantage Pro 2, with Solar Radiation
and UV Sensors
ii) PureWafer 235W Polycrystalline Silicon Solar Panel, inclined at 37
degrees to the horizontal
iii) Egnitec PVMS250 PV Measurement System, for logging PV data
The Davis Instrument Vantage Pro2 weather station series function as to measure
barometric pressure, temperature, humidity, rainfall, wind speed and direction,
UV/solar(with additional of Solar Radiation and UV Sensor) and soon on. It consists
of 2 components: the Integrated Sensor Suite (ISS) which houses and manages the
external sensor array; and the console which provides the user interface, data display,
A/D conversion and calculations. The Integrated Sensor Suite (ISS) collects outside
weather data and sends the data to a Vantage Pro2 console. Vantage Pro2 Weather
Station console displays and records the station‟s weather data, provides graph and
alarm functions, and interfaces to a computer using the optional WeatherLink®
software. This instrument is actually where the output of Logfile data I used.
The solar panel that our facility used to record the photovoltaic energy output is
PureWafer 235W Polycrystalline Silicon Solar Panel. In order to get the maximum
solar energy productivity, the solar panel we have inclined it at 37 degrees to the
horizontal. PVMS250 will then collect the measurement of PV output and record into
MPP Data file. The PVMS250 unit is a dedicated photovoltaic measurement system.
It incorporates a maximum power point tracker (MPPT) and current-voltage (IV)
curve tracing capability, as well as two PT100 temperature sensor inputs. Between
regular IV traces the PV module under test can be maintained at specific operating
conditions: maximum power point (MPP), open circuit or short circuit.
The coming next day, I continue arrange all the MPP Data and Logfile Data into a
folder in sort of month and year so that to let the user to get the data easily when using
of this system. Afterwards, I begin to analyse and organise the MPP Data and Logfile
Data by using the Solar Monitoring System. This is because I need to make a
performance analysis for the year 2014 and year 2015. For the performance analysis,
it contains of 12 months of data and I have to make a monthly summary on Solar
Irradiance, System Yield, Specific Yield, and Performance Ratio for each month.
i) Solar Irradiance- Total solar energy was available.
ii) System Yield- Total of actual energy produced by the system.
iii) Performance Ratio- Measure of the quality of a PV system
iv) Specific Yield- Measure of energy produced per unit of installed capacity.
At the same time, I also have to prepare graphical diagram in order to support the data
and provide a visual presentation of the data above. Therefore, an annual summary
can be completed by doing this. Graphs and Data (including on Monthly Summary
sheet) will have been updated and can be copied into the website as required.
SIGNED: DATE:
_____________________ Student _____________________
_____________________ Industry Supervisor _____________________
_____________________ WIT Placement Tutor _____________________
Appendix III
CV
Work Placement CV –
BEng (Hons) in Electronic Engineering (WD086)
http://www.wit.ie/wd086
Name: Lee Siang Wei Date of Birth: 24 April 1993
E-mail: jacklee_lsw@hotmail.com Tel: +353 831673290
Nationality: Malaysian
Address: Apartment 21C, Block 9, Riverwalk Accommodation, Inner Ring Road, Waterford.
EDUCATION
Third Level
College: Waterford Institute of Technology Date: Sept 2014-May 2016
Course: BEng (Hons) in Electronic Engineering
Subjects included:
Year 3: Analogue Control, Advanced Engineering Maths, Data Structures & Algorithms, Semiconductor Fundamentals,
Electromagnetic Fields & Waves, Telecommunications 3
College: Tunku Abdul Rahman University College, Malaysia Date: May 2011-Sept 2013
Course: Diploma in Technology (Electronic Engineering) CGPA: 3.4123 (Graduated with Merit)
Subjects included:
Year 2: Mathematics IV, V & VI, Electronic Instrumentation & Communications, Electrical Technology & Circuits,
Microprocessors, Engineering Mechanics, Embedded Systems, Design & Application, C++ Programming,
Industrial Control & Automation.
Year 1: Mathematics I, II & III, Engineering Science I&II, Basic Electronics, Principles of Electrical & Electronics
Engineering, Digital Electronics, Analogue Electronics, Engineering Drawing and CADD, English Language.
Mini Project: Password Door Lock System
It was a system that using theory of electromagnet to lock the door (based microcontroller). The user needs to enter
a correct password to access it.
Second Level
School: SMJK Chio Min, Kulim, Kedah, Malaysia Date: Jan 2006-Oct 2010
Leaving Certificate: SPM with 7A & 3B including Chemistry, Physics, Biology, Mathematics, Chinese and English
1119 (GCE-O) 3B
WORK EXPERIENCE
Name: UWC Electric (M) Sdn. Bhd, Simpang Ampat, Penang, Malaysia
Date: Jan 2013-April 2013
Role or Position: Internship Technical Assistant
Responsibilities / Duties:
 Visual and functional checked for products.
 Maintained, analysed, and repaired faulty circuit board and equipment.
 Evaluated and verified products.
Skills gained:
 Great time management skills; prioritize main task as well.
 Developed problem-solving and technical skills.
 Experience the important of teamwork and interpersonal skills.
Name: Tua Pui Hiang Restaurant, Kulim, Kedah, Malaysia
Date: Sept 2013-Aug 2014
Role or Position: Waiter
Responsibilities / Duties:
 Presented food menus to patrons.
 Provided guests with good services and information.
 Delivered food and beverage orders to kitchen staff.
Work Placement CV –
BEng (Hons) in Electronic Engineering (WD086)
http://www.wit.ie/wd086
 Ensured order delivery to the table in a timely manner.
 Clean up dishes and glasses from the table.
 Fulfilled customer’s requirement when they requested.
Skills gained:
 Good customer service; friendly and kindness to serve guest.
 Effective communication skills with guests and staff.
 Great attention to details.
 High degree of personal cleanliness
 Understanding and dealing with stressful situations.
Name: UYang Smartkids Learning Centre, Bukit Mertajam, Penang, Malaysia
Date: Jan 2011-Aug 2014
Role or Position: Taekwon-Do Instructor
Responsibilities/ Duties:
 Conducted lesson of Traditional Taekwon-Do.
 Monitored and observed students, and provided feedback for students on their progress.
 Managed students to grading examination, competition and reality self-defence.
 Instructed Traditional Taekwon-Do’s spirit and martial virtue to students.
 Inspected mental and ethical discipline of each student.
Skills gained:
 Knowledge and ability in martial arts discipline.
 Self-confidence; speak and demonstrate in front of an audience.
 Perseverance and patience; teach students of vastly differing physical ability.
 Good organisational skills; responsible in running own business.
 Enthusiasm toward martial arts; inspire confidence and motivate students.
 Admirable fitness; initiative to exercise regularly in both aerobic and anaerobic exercise.
Computer Skills:
 Windows 7 Operating System
 C++ Programming, Visual Basic, Microsoft
Word, Excel & Powerpoint, Internet
Language Skills:
 Fluent in Mandarin, Malay, & English
Interests and Achievements
Taekwon-Do Football
 Awarded Black Belt 1st Degree of Malaysian
Global Taekwon-Do Federation.
 President of Taekwon-Do Society in secondary
school (2009-2010).
 Organised “Will Taekwon-Do” Tournament
2011.
 Won bronze medal of Penang State Tournament
last year (open category).
 Led members and students to tournament and
demonstration.
 Attended training class frequently.
 Member of secondary school football club.
 Won Champion of football team 2010 of
school competition.
 Awarded Man of the Competition 2010.
 Enjoyed football and futsal during leisure
time with teammates.
REFEREES
O Hanlon, Fergal
Lecturer in BEng Electronic Studies Waterford Institute of Technology
Tel: +353 5130 2647 Email: FOHANLON@wit.ie
Appendix IV
Product Details and Specification
Measurement Technology for Photovoltaics
Software Version: 1.11
Photovoltaic Measurement System
PVMS Datalogger User Manual
August 2012
© 2012, Egnitec 5
5.3 PVMS Measurement Units
This section displays details of any PVMS monitoring units which have been loaded.
Each PVMS unit loaded into the datalogger will be displayed in a line on the grid, allowing its current operat-
ing status and mode to be observed, as well as the last power measurement and its timestamp.
New Unit A dialog box will be displayed which will allow the user to select from a number of avail-
able COM ports. Once selected the program will attempt to connect to the PVMS unit
and will load and display details of this unit in the PVMS Unit Details dialog box.
Load Unit This allows details of a PVMS unit to be loaded into the datalogger.
Save Unit This allows details of a PVMS unit to be saved.
Remove Unit This allows the selected unit to be removed from the datalogger.
Unit Details This will load a dialog box which displays details about the PVMS unit. The user is able to
change some of the unit’s parameters, including Unit Name (MAX 8 characters) and the
number of points in the IV curve.
If either Unit Name or IV Curve Points are changed on the dialog box then the user will be
given the option of updating these values on the unit’s EEPROM when the dialog box is
closed. Otherwise these changes will not be saved. If the EEPROM is updated, check that
the update was successful by clicking on “Unit Details” again.
The details of the Module under test and the load resistance are also entered on this dia-
log box. These details are stored in the PVMS unit file on the PC. If any changes are made
these must be saved manually (click on “Save Unit” after this dialog box has closed).
Autoload Units This allows the user to select a folder and load all of the PVMS units which have been
stored there (file extension *.pvu).
6. Driver Installation.
The RS422-USB interface cable is based on the FTDI
USB-Serial chipset and suitable drivers must be in-
stalled. Please refer to www.ftdichip.com for further
details.
 Connect each USB-RS422 cable into the PC. The
cable does not have to be connected to the
PVMS unit for the drivers to be installed.
 On Windows Vista and Windows 7 the
drivers software will be automatically
downloaded and installed.
 On older versions of Windows the drivers
will need to be installed manually. You
will be prompted to install the FTDI driv-
ers if they have not already been in-
stalled. The drivers can be downloaded
from http://www.ftdichip.com/Drivers/
VCP.htm.
 Two drivers will be installed for each unit: a USB
Serial Port (COMxx) and a USB Serial Converter.
 Each cable will be assigned a unique COM port
number (e.g. “COM31”).The next time the cable
is plugged in it will be recognised and assigned
the same COM port number.
 To check that installation was successful or if
there are any problems it is possible to view the
device in Device Manager (under Control
Panel).
 Under Ports (COM & LPT) there will be a
USB Serial Port with a COM port number
assigned to it for each cable that is con-
nected to the PC (by default unconnected
devices are not shown).
7. Datalogger Output Files
The measurement data is output from the datalogger
and goes into a set of four files per PVMS Unit:
Logfile: this file stores extra information for each
unit.
<Campaign>_<Unit Name>_LogFile_<yyyy_mm_dd>.txt
(e.g. England_UK0010_logFile_2012_05_31.txt)
MPP Data: this file holds each set of MPP measure-
ments (current, voltage, 2x module temperatures) as
well as an indicator of system operating status.
<Campaign>_<Unit Name>_MPPData_<yyyy_mm_dd>.csv
(e.g. England_UK0010_MPPData_2012_05_31.txt)
IV Main: this file holds one record for each IV curve.
<Campaign>_<Unit Name>_IVMain_<yyyy_mm_dd>.csv
(e.g. England_UK0010_IVMain_2012_05_31.txt)
Datalogger Settings, Driver Installation & Datalogger Output Files
© 2012, Egnitec6
Datalogger Output Files
IV Data: this file holds each of the current-voltage
points on the curve as a separate record.
<Campaign>_<Unit Name>_IVData_<yyyy_mm_dd>.csv
(e.g. England_UK0010_IVData_2012_05_31.txt)
The CSV files can be opened in Excel or a text editor
or can be loaded into tables in a database (e.g.
MySQL). If the Daily File option is selected on the
datalogger the files will be created with the filenames
as shown above and a new set of files will be created
each and every day. If Daily File is not selected the
data will be logged into the same set of files. In this
instance the filenames will not include the date (e.g.
“England_UK0010_IVMain.csv”).
7.1 CSV Header Records
The CSV files each have a set of header records which
hold important information regarding the source of
the files:
 Campaign: the datalogging campaign name.
 Location: the datalogging location name.
 User: the Windows username from the PC.
 ObservationType: identifies which type of
measurement the file contains (either “MPPT”
or “I-V Curve”).
 ObservationName: identifies the data held in
that column.
 ObjectModel: holds the Module Model Number
(from PVMS Unit Details form).
 ObjectSerialNo: holds the Module Serial Num-
ber (from PVMS Unit Details form)
 SensorModel: always “built-in transducer”
 SensorSerialNo: always “N/A”
 DataAcquisitionHardwareModel: the model
number of the PVMS measurement unit (e.g.
PVMS_250/80/12).
 DataAcquisitionHardwareChannel: always “1”
 DataAcquisitionHardwareSerial: the serial
number of the PVMS unit (e.g. “006/0010”)
7.2 CSV Data Records
After the header records there will be the data.
Date & Timestamp: The first column of every data
record is always a date & timestamp (dd-mm-yyyy
hh:mm:ss format).
The rest of the columns differ depending on the file:
MPP Data:
 Impp: Current measurement (see note *).
 Vmpp: Voltage measurement (see note *).
 Module_temperature1: PT100 temperature
from sensor 1 (see note **).
 Module_temperature2: PT100 temperature
from sensor 2 (see note **).
 Err: the current operating status of the unit is
reported as a number: -
 0 MPPT Locked
 1 MPPT Scan
 2 No PV/Low Light (see note ***)
 3 Open Circuit
 4 Initialising
 5 Remote Shutdown
 6 IV Trace Internal
 7 IV Trace External
 8 Overvoltage Fault
 9 Calibration
 10 Short Circuit
Anything apart from 0, 2, 3 or 10 indicates that
the unit is not working as expected and the val-
ues should be treated as unreliable.
IV Main:
Each IV curve has a single record in this file.
 Impp: MPP current (taken from curve)
 Vmpp: MPP voltage (taken from curve)
 Isc: short circuit current
 Voc: open circuit voltage
 Module_temperature1 (see note **)
 Module_temperature2 (see note **)
 IV_Sweep_EndTime: indicates when the IV
curve sweep finished.
 No_of_Points: the number of points that were
measured for this particular curve.
IV Data:
Each IV curve consists of a number of records with
the same date & timestamp (matching the date &
timestamp in the IV Main file).
 SweepPoint: the Point No (starting at 0)
 I: current value
 V: voltage value
Notes:
* Impp and Vmpp in the MPP Data file will hold the
current and voltage reading taken at that specific
time. The analysis of these needs to take into account
the operating status of the unit indicated by Err. This
will indicate which operating mode the unit is work-
ing in or if any error condition exists.
** A value of –99 indicates that no PT100 sensor is
present on that channel.
*** The unit has determined that the light levels are
very low or that no PV panel is connected.
Appendix V
Industry Supervisor’s Report
Student Industrial Placement Guide – WIT BEng (Hons) Electronic Engineering – 2014/15
20
BEng (Hons) Electronic Engineering - WIT
Industry Supervisor’s Report
Student Company
Supervisor Location
Supervisor’s Assessment of the
Student
Maximum Score Actual Score
Technical Competence
10
Ability to Communicate
10
Enthusiasm 10
TOTAL 30
General Comments about the Student and the Placement Programme
Signed: _______________________ Date:________________
Appendix VI
WIT Placement Tutor’s report of
Placement Visit
Student Industrial Placement Guide – WIT BEng (Hons) Electronic Engineering – 2014/15
17
BEng (Honours) Electronic Engineering - WIT
INDUSTRIAL PLACEMENT VISIT
WIT Placement Tutor’s Report (Page 1 of 2)
Student Company
Date of Visit Location
1. General Review of the organisation
(Note: This normally involves a tour of the works on the site and/or office and the student
should demonstrate his /her knowledge of the work in progress)
2. Review of
Documentation
Status Comments
Monthly Reports
Placement Diary
Photos/Acetates
3. Difficulties with Placement?
(Note: This may include discussion of salary, working hours/conditions, accommodation,
health, relationship with Industrial Supervisor/co-workers, type/range of duties, etc.)
Student Industrial Placement Guide – WIT BEng (Hons) Electronic Engineering – 2014/15
18
BEng (Hons) Electronic Engineering - WIT
INDUSTRIAL PLACEMENT VISIT
WIT Placement Tutor’s Report (Page 2 of 2)
4. Academic Review
(a) Semester 5 Results
(b) Final Project – Review of Addendum Reports to date and actions proposed
5. Industrial Supervisor’s (initial) Appraisal of Student
(Note: The College Supervisor should meet with the Industrial Supervisor to discuss the
student’s performance and the WIT placement programme in general)
Name of Industrial Supervisor: Position/Job Title:
6. Assessment of Student during Placement
Visit
Maximum
Score
Actual
Score
Attitude/Enthusiasm 15
Technical Competence 15
Communication Ability 10
TOTAL 40
Signed: __________________________

More Related Content

What's hot

Final Internship Report by kiyimba Bill (International University Of East Afr...
Final Internship Report by kiyimba Bill (International University Of East Afr...Final Internship Report by kiyimba Bill (International University Of East Afr...
Final Internship Report by kiyimba Bill (International University Of East Afr...Bill Kiyimba
 
Internship Report
Internship ReportInternship Report
Internship Reportprathagarg
 
AbleMoJah's IT Report
AbleMoJah's IT ReportAbleMoJah's IT Report
AbleMoJah's IT ReportAble MoJah
 
WSO2 Internship Report
WSO2 Internship ReportWSO2 Internship Report
WSO2 Internship ReportUjitha Iroshan
 
student-s-attachment-log-book.pdf
student-s-attachment-log-book.pdfstudent-s-attachment-log-book.pdf
student-s-attachment-log-book.pdfZhouCrance
 
Computer Science Student Final attachment Logbook
Computer Science Student Final attachment Logbook Computer Science Student Final attachment Logbook
Computer Science Student Final attachment Logbook Paullaster Okoth
 
Nahom final internship report
Nahom final internship reportNahom final internship report
Nahom final internship reportNahom Balcha
 
Information technology Internship report
Information technology Internship reportInformation technology Internship report
Information technology Internship reportRodney kaweesa
 
Report_on_Industrial Placement
Report_on_Industrial PlacementReport_on_Industrial Placement
Report_on_Industrial PlacementAwais Mahmood
 
Internship report (1)
Internship report (1)Internship report (1)
Internship report (1)brhne fitsum
 
Computer science/ IT Fianl attachment report
Computer science/ IT Fianl attachment reportComputer science/ IT Fianl attachment report
Computer science/ IT Fianl attachment reportPaullaster Okoth
 
Yuhang Chen - Internship Report
Yuhang Chen - Internship ReportYuhang Chen - Internship Report
Yuhang Chen - Internship ReportYuhang Chen
 
internship report
internship reportinternship report
internship reportZahid Khan
 
Computer Science Internship Report Leena AI
Computer Science Internship Report Leena AIComputer Science Internship Report Leena AI
Computer Science Internship Report Leena AIshadowhazard77
 
Work Experience Report - Ganamotse
Work Experience Report - GanamotseWork Experience Report - Ganamotse
Work Experience Report - GanamotseGaenamele Ganamotse
 
Computer science industrial training report carried out at web info net ltd ...
Computer science  industrial training report carried out at web info net ltd ...Computer science  industrial training report carried out at web info net ltd ...
Computer science industrial training report carried out at web info net ltd ...rashid muganga
 
Intership report PAK ELEKTRON LIMITED (PEL) , ENERGY METER PLANT SAAD IZHAR
Intership report PAK ELEKTRON LIMITED (PEL) , ENERGY METER PLANT SAAD IZHAR  Intership report PAK ELEKTRON LIMITED (PEL) , ENERGY METER PLANT SAAD IZHAR
Intership report PAK ELEKTRON LIMITED (PEL) , ENERGY METER PLANT SAAD IZHAR SaadIzhar
 

What's hot (20)

Final Internship Report by kiyimba Bill (International University Of East Afr...
Final Internship Report by kiyimba Bill (International University Of East Afr...Final Internship Report by kiyimba Bill (International University Of East Afr...
Final Internship Report by kiyimba Bill (International University Of East Afr...
 
Internship Report
Internship ReportInternship Report
Internship Report
 
AbleMoJah's IT Report
AbleMoJah's IT ReportAbleMoJah's IT Report
AbleMoJah's IT Report
 
WSO2 Internship Report
WSO2 Internship ReportWSO2 Internship Report
WSO2 Internship Report
 
student-s-attachment-log-book.pdf
student-s-attachment-log-book.pdfstudent-s-attachment-log-book.pdf
student-s-attachment-log-book.pdf
 
Computer Science Student Final attachment Logbook
Computer Science Student Final attachment Logbook Computer Science Student Final attachment Logbook
Computer Science Student Final attachment Logbook
 
Nahom final internship report
Nahom final internship reportNahom final internship report
Nahom final internship report
 
Information technology Internship report
Information technology Internship reportInformation technology Internship report
Information technology Internship report
 
Report_on_Industrial Placement
Report_on_Industrial PlacementReport_on_Industrial Placement
Report_on_Industrial Placement
 
Internship report (1)
Internship report (1)Internship report (1)
Internship report (1)
 
Computer science/ IT Fianl attachment report
Computer science/ IT Fianl attachment reportComputer science/ IT Fianl attachment report
Computer science/ IT Fianl attachment report
 
Yuhang Chen - Internship Report
Yuhang Chen - Internship ReportYuhang Chen - Internship Report
Yuhang Chen - Internship Report
 
internship report
internship reportinternship report
internship report
 
INTERNSHIP REPORT
INTERNSHIP REPORTINTERNSHIP REPORT
INTERNSHIP REPORT
 
INTERNSHIP REPORT
INTERNSHIP REPORTINTERNSHIP REPORT
INTERNSHIP REPORT
 
Computer Science Internship Report Leena AI
Computer Science Internship Report Leena AIComputer Science Internship Report Leena AI
Computer Science Internship Report Leena AI
 
Work Experience Report - Ganamotse
Work Experience Report - GanamotseWork Experience Report - Ganamotse
Work Experience Report - Ganamotse
 
Computer science industrial training report carried out at web info net ltd ...
Computer science  industrial training report carried out at web info net ltd ...Computer science  industrial training report carried out at web info net ltd ...
Computer science industrial training report carried out at web info net ltd ...
 
Industrial Training Report-1
Industrial Training Report-1Industrial Training Report-1
Industrial Training Report-1
 
Intership report PAK ELEKTRON LIMITED (PEL) , ENERGY METER PLANT SAAD IZHAR
Intership report PAK ELEKTRON LIMITED (PEL) , ENERGY METER PLANT SAAD IZHAR  Intership report PAK ELEKTRON LIMITED (PEL) , ENERGY METER PLANT SAAD IZHAR
Intership report PAK ELEKTRON LIMITED (PEL) , ENERGY METER PLANT SAAD IZHAR
 

Viewers also liked

Internship Report on Building Construction
Internship Report on Building ConstructionInternship Report on Building Construction
Internship Report on Building ConstructionEsmael Aragaw
 
QNB Group Indonesia Economic Insight 2014
QNB Group Indonesia Economic Insight 2014QNB Group Indonesia Economic Insight 2014
QNB Group Indonesia Economic Insight 2014Joannes Mongardini
 
An Empirical Analysis of Attributes Influencing... Shirin - Abdulaziz -Chris ...
An Empirical Analysis of Attributes Influencing... Shirin - Abdulaziz -Chris ...An Empirical Analysis of Attributes Influencing... Shirin - Abdulaziz -Chris ...
An Empirical Analysis of Attributes Influencing... Shirin - Abdulaziz -Chris ...Shirin Avazxanovna
 
Tài liệu tổng quát về cơ sở dữ liệu
Tài liệu tổng quát về cơ sở dữ liệuTài liệu tổng quát về cơ sở dữ liệu
Tài liệu tổng quát về cơ sở dữ liệuAnh Duong Pham
 
Mississippi's Navy Connections
Mississippi's Navy ConnectionsMississippi's Navy Connections
Mississippi's Navy ConnectionsPictureYourself
 
New base special 27 january 2014
New base special  27 january 2014New base special  27 january 2014
New base special 27 january 2014Khaled Al Awadi
 
QNB Group United Arab Emirates Economic Insight 2013
QNB Group United Arab Emirates Economic Insight 2013QNB Group United Arab Emirates Economic Insight 2013
QNB Group United Arab Emirates Economic Insight 2013Joannes Mongardini
 
Internship report Robin Corral
Internship report Robin CorralInternship report Robin Corral
Internship report Robin CorralRobin Corral
 
Pro mark3rtk reference manual
Pro mark3rtk reference manualPro mark3rtk reference manual
Pro mark3rtk reference manualandy jaya
 
Speciale. JND209. Jeppe Stavnsbo Sørensen
Speciale. JND209. Jeppe Stavnsbo SørensenSpeciale. JND209. Jeppe Stavnsbo Sørensen
Speciale. JND209. Jeppe Stavnsbo SørensenJeppe Stavnsbo
 
Afro tech profile
Afro tech profileAfro tech profile
Afro tech profileafrotech
 
QNB Group China Economic Insight 2015
QNB Group China Economic Insight 2015QNB Group China Economic Insight 2015
QNB Group China Economic Insight 2015Joannes Mongardini
 
PROJECT PORTFOLIO-Antony Ochieng Odhiambo.
PROJECT PORTFOLIO-Antony Ochieng Odhiambo.PROJECT PORTFOLIO-Antony Ochieng Odhiambo.
PROJECT PORTFOLIO-Antony Ochieng Odhiambo.Anthony Ochieng.
 
c.v of Ibrahim salah ibrahim
c.v of Ibrahim salah ibrahimc.v of Ibrahim salah ibrahim
c.v of Ibrahim salah ibrahimibrahim alhag
 

Viewers also liked (20)

Internship Report on Building Construction
Internship Report on Building ConstructionInternship Report on Building Construction
Internship Report on Building Construction
 
QNB Group Indonesia Economic Insight 2014
QNB Group Indonesia Economic Insight 2014QNB Group Indonesia Economic Insight 2014
QNB Group Indonesia Economic Insight 2014
 
M.Hussein CV pdf
M.Hussein CV pdfM.Hussein CV pdf
M.Hussein CV pdf
 
An Empirical Analysis of Attributes Influencing... Shirin - Abdulaziz -Chris ...
An Empirical Analysis of Attributes Influencing... Shirin - Abdulaziz -Chris ...An Empirical Analysis of Attributes Influencing... Shirin - Abdulaziz -Chris ...
An Empirical Analysis of Attributes Influencing... Shirin - Abdulaziz -Chris ...
 
C.V Osman 2015
C.V Osman 2015C.V Osman 2015
C.V Osman 2015
 
Tài liệu tổng quát về cơ sở dữ liệu
Tài liệu tổng quát về cơ sở dữ liệuTài liệu tổng quát về cơ sở dữ liệu
Tài liệu tổng quát về cơ sở dữ liệu
 
Mississippi's Navy Connections
Mississippi's Navy ConnectionsMississippi's Navy Connections
Mississippi's Navy Connections
 
New base special 27 january 2014
New base special  27 january 2014New base special  27 january 2014
New base special 27 january 2014
 
QNB Group United Arab Emirates Economic Insight 2013
QNB Group United Arab Emirates Economic Insight 2013QNB Group United Arab Emirates Economic Insight 2013
QNB Group United Arab Emirates Economic Insight 2013
 
Internship report Robin Corral
Internship report Robin CorralInternship report Robin Corral
Internship report Robin Corral
 
Pro mark3rtk reference manual
Pro mark3rtk reference manualPro mark3rtk reference manual
Pro mark3rtk reference manual
 
Speciale. JND209. Jeppe Stavnsbo Sørensen
Speciale. JND209. Jeppe Stavnsbo SørensenSpeciale. JND209. Jeppe Stavnsbo Sørensen
Speciale. JND209. Jeppe Stavnsbo Sørensen
 
Resume
ResumeResume
Resume
 
Afro tech profile
Afro tech profileAfro tech profile
Afro tech profile
 
QNB Group China Economic Insight 2015
QNB Group China Economic Insight 2015QNB Group China Economic Insight 2015
QNB Group China Economic Insight 2015
 
Yasir new CV
Yasir new CVYasir new CV
Yasir new CV
 
Bcm news wire issue 425
Bcm news wire issue 425Bcm news wire issue 425
Bcm news wire issue 425
 
PROJECT PORTFOLIO-Antony Ochieng Odhiambo.
PROJECT PORTFOLIO-Antony Ochieng Odhiambo.PROJECT PORTFOLIO-Antony Ochieng Odhiambo.
PROJECT PORTFOLIO-Antony Ochieng Odhiambo.
 
Annual_Report_2016
Annual_Report_2016Annual_Report_2016
Annual_Report_2016
 
c.v of Ibrahim salah ibrahim
c.v of Ibrahim salah ibrahimc.v of Ibrahim salah ibrahim
c.v of Ibrahim salah ibrahim
 

Similar to Final Work Placement Report

IRJET - Virtual Lab: Keep Away Physically but Not Technically
IRJET - Virtual Lab: Keep Away Physically but Not TechnicallyIRJET - Virtual Lab: Keep Away Physically but Not Technically
IRJET - Virtual Lab: Keep Away Physically but Not TechnicallyIRJET Journal
 
Kaahwa armstrong intern report
Kaahwa armstrong intern reportKaahwa armstrong intern report
Kaahwa armstrong intern reportkaahwa Armstrong
 
IMPLEMENTATION OF STUDENT REGISTRATION PORTAL APPLICATION
IMPLEMENTATION OF STUDENT REGISTRATION PORTAL APPLICATIONIMPLEMENTATION OF STUDENT REGISTRATION PORTAL APPLICATION
IMPLEMENTATION OF STUDENT REGISTRATION PORTAL APPLICATIONIRJET Journal
 
silo.tips_student-s-attachment-log-book.pdf
silo.tips_student-s-attachment-log-book.pdfsilo.tips_student-s-attachment-log-book.pdf
silo.tips_student-s-attachment-log-book.pdfAlphonceKiprono1
 
silo.tips_student-s-attachment-log-book.pdf
silo.tips_student-s-attachment-log-book.pdfsilo.tips_student-s-attachment-log-book.pdf
silo.tips_student-s-attachment-log-book.pdfAlphonceKiprono1
 
IRJET- Course outcome Attainment Estimation System
IRJET-  	  Course outcome Attainment Estimation SystemIRJET-  	  Course outcome Attainment Estimation System
IRJET- Course outcome Attainment Estimation SystemIRJET Journal
 
Attendance System Using Fingerprint Identification With Website Designing And...
Attendance System Using Fingerprint Identification With Website Designing And...Attendance System Using Fingerprint Identification With Website Designing And...
Attendance System Using Fingerprint Identification With Website Designing And...IRJET Journal
 
CS640_Thesis_AbulAalaAlamsBari13250849
CS640_Thesis_AbulAalaAlamsBari13250849CS640_Thesis_AbulAalaAlamsBari13250849
CS640_Thesis_AbulAalaAlamsBari13250849Almas Bari
 
Report final
Report finalReport final
Report finalJim Kats
 
Final_Project_Report_DT021_4_2011_Charlie_Weld
Final_Project_Report_DT021_4_2011_Charlie_WeldFinal_Project_Report_DT021_4_2011_Charlie_Weld
Final_Project_Report_DT021_4_2011_Charlie_WeldCharlie Weld
 
The impact of corporate responsiveness on firm risk and market beta
The impact of corporate responsiveness on firm risk and market betaThe impact of corporate responsiveness on firm risk and market beta
The impact of corporate responsiveness on firm risk and market betaCPA MURITHI GODFREY NJUE
 
Student Industrial Workshop Experience Scheme (SIWES) Report
Student Industrial Workshop Experience Scheme (SIWES) ReportStudent Industrial Workshop Experience Scheme (SIWES) Report
Student Industrial Workshop Experience Scheme (SIWES) ReportOkpehHarrison
 
IRJET- Enhanced Mobile Application for Training and Placement Cell
IRJET- Enhanced Mobile Application for Training and Placement CellIRJET- Enhanced Mobile Application for Training and Placement Cell
IRJET- Enhanced Mobile Application for Training and Placement CellIRJET Journal
 
Applying quality-standard (css)
Applying quality-standard (css)Applying quality-standard (css)
Applying quality-standard (css)Bong Bandola
 
An investigation into the physical build and psychological aspects of an inte...
An investigation into the physical build and psychological aspects of an inte...An investigation into the physical build and psychological aspects of an inte...
An investigation into the physical build and psychological aspects of an inte...Jessica Navarro
 
Industrial Attachment Program (IAP) Report
Industrial Attachment Program (IAP) ReportIndustrial Attachment Program (IAP) Report
Industrial Attachment Program (IAP) ReportAkshit Arora
 
Industrial Training Report on PLC & SCADA
Industrial Training Report on PLC & SCADAIndustrial Training Report on PLC & SCADA
Industrial Training Report on PLC & SCADAAman Jaiswal
 

Similar to Final Work Placement Report (20)

IRJET - Virtual Lab: Keep Away Physically but Not Technically
IRJET - Virtual Lab: Keep Away Physically but Not TechnicallyIRJET - Virtual Lab: Keep Away Physically but Not Technically
IRJET - Virtual Lab: Keep Away Physically but Not Technically
 
Report docx
Report docxReport docx
Report docx
 
Kaahwa armstrong intern report
Kaahwa armstrong intern reportKaahwa armstrong intern report
Kaahwa armstrong intern report
 
IMPLEMENTATION OF STUDENT REGISTRATION PORTAL APPLICATION
IMPLEMENTATION OF STUDENT REGISTRATION PORTAL APPLICATIONIMPLEMENTATION OF STUDENT REGISTRATION PORTAL APPLICATION
IMPLEMENTATION OF STUDENT REGISTRATION PORTAL APPLICATION
 
silo.tips_student-s-attachment-log-book.pdf
silo.tips_student-s-attachment-log-book.pdfsilo.tips_student-s-attachment-log-book.pdf
silo.tips_student-s-attachment-log-book.pdf
 
silo.tips_student-s-attachment-log-book.pdf
silo.tips_student-s-attachment-log-book.pdfsilo.tips_student-s-attachment-log-book.pdf
silo.tips_student-s-attachment-log-book.pdf
 
IRJET- Course outcome Attainment Estimation System
IRJET-  	  Course outcome Attainment Estimation SystemIRJET-  	  Course outcome Attainment Estimation System
IRJET- Course outcome Attainment Estimation System
 
Attendance System Using Fingerprint Identification With Website Designing And...
Attendance System Using Fingerprint Identification With Website Designing And...Attendance System Using Fingerprint Identification With Website Designing And...
Attendance System Using Fingerprint Identification With Website Designing And...
 
CS640_Thesis_AbulAalaAlamsBari13250849
CS640_Thesis_AbulAalaAlamsBari13250849CS640_Thesis_AbulAalaAlamsBari13250849
CS640_Thesis_AbulAalaAlamsBari13250849
 
Report final
Report finalReport final
Report final
 
Final_Project_Report_DT021_4_2011_Charlie_Weld
Final_Project_Report_DT021_4_2011_Charlie_WeldFinal_Project_Report_DT021_4_2011_Charlie_Weld
Final_Project_Report_DT021_4_2011_Charlie_Weld
 
The impact of corporate responsiveness on firm risk and market beta
The impact of corporate responsiveness on firm risk and market betaThe impact of corporate responsiveness on firm risk and market beta
The impact of corporate responsiveness on firm risk and market beta
 
Student Industrial Workshop Experience Scheme (SIWES) Report
Student Industrial Workshop Experience Scheme (SIWES) ReportStudent Industrial Workshop Experience Scheme (SIWES) Report
Student Industrial Workshop Experience Scheme (SIWES) Report
 
IRJET- Enhanced Mobile Application for Training and Placement Cell
IRJET- Enhanced Mobile Application for Training and Placement CellIRJET- Enhanced Mobile Application for Training and Placement Cell
IRJET- Enhanced Mobile Application for Training and Placement Cell
 
Applying quality-standard (css)
Applying quality-standard (css)Applying quality-standard (css)
Applying quality-standard (css)
 
RiskAssessmentReport
RiskAssessmentReportRiskAssessmentReport
RiskAssessmentReport
 
An investigation into the physical build and psychological aspects of an inte...
An investigation into the physical build and psychological aspects of an inte...An investigation into the physical build and psychological aspects of an inte...
An investigation into the physical build and psychological aspects of an inte...
 
Industrial Attachment Program (IAP) Report
Industrial Attachment Program (IAP) ReportIndustrial Attachment Program (IAP) Report
Industrial Attachment Program (IAP) Report
 
Industrial Training Report on PLC & SCADA
Industrial Training Report on PLC & SCADAIndustrial Training Report on PLC & SCADA
Industrial Training Report on PLC & SCADA
 
Sport.net(2).doc
Sport.net(2).docSport.net(2).doc
Sport.net(2).doc
 

Final Work Placement Report

  • 1. Work Placement Industrial Report Nanotechnology Research Group Waterford Institute of Technology Name: Lee Siang Wei Year 3 Semester 2 Academic Year 2014/15 Department of Engineering Technology School of Engineering Waterford Institute of Technology, Ireland.
  • 2. Student Industrial Placement-WIT BEng (Hons) Electronic Engineering – 2014/15 i Declaration “The report submitted herewith is a result of my own works. All information that has been obtained from other sources had been fully acknowledged. I understand that plagiarism constitutes a breach of Institute rules and regulations and would be subjected to disciplinary actions.” Signature ----------------------- Lee Siang Wei Date:
  • 3. Student Industrial Placement-WIT BEng (Hons) Electronic Engineering – 2014/15 ii Acknowledgement Firstly, I would like to thank my industrial supervisor who is also Principal Investigator of Nanotechnology Research Group, Dr. Joseph O'Mahony for his positive attitude showed to my work and supervision that truly helps the progression and smoothness of this internship program. The co-operation is much indeed appreciated. Secondly, I also like to thank to these people below:  Yang Dong (Kevin) Postgraduate Researcher at Nanotechnology Research Group Development Engineer at Waterford Institute of Technology  Shi Bo Cai (Cian) Development Scientist at Waterford Institute of Technology Part-Time Assistant Lecturer at Waterford Institute of Technology for extending their friendship towards me and their guidance and knowledge, skill and for encouraging me through this practical training since the first day I am in Nanotechnology Research Group, then making a pleasure-training environment in the Nanotechnology Workshops. With their all guiding and helping this report would be a reality. Last but not least, I would like to express my heartfelt gratitude to my family members for their support, concern and love. A paper is not enough for me to express the support and guidance I received from them almost for all the work I did there
  • 4. Student Industrial Placement-WIT BEng (Hons) Electronic Engineering – 2014/15 iii Table of contents Declaration................................................................................................................................i Acknowledgement....................................................................................................................ii Chapter 1: Introduction.............................................................................................1-11 1.1 : Objectives 1.2 : Position and Job Responsibilities during Work Placement 1.3 : Work Placement Organisation 1.3.1 WIN-IPT Profile 1.3.2 WIN-IPT Staff Person, Academic Partners and Industrial Partners 1.3.2.1 Staff Person 1.3.2.2 Academic Partner 1.3.3 WIN-IPT Working Projects Chapter 2: Projects, Tasks and Activities...............................................................12-41 2.1 : Weekly Tasks and Activities Description 2.2 : Programming Work 2.2.1 Description of coding of Solar Monitoring System 2.2.2 User Guide for Solar Monitoring System 2.3 : Office Work 2.3.1 Office work for WIT Weather Station Chapter 3: Learning Outcomes………………………………………………..…42-43 Chapter 4: Conclusion..................................................................................................44 References............................................................................................................................45-46 Appendices.............................................................................................................................47
  • 5. Student Industrial Placement-WIT BEng (Hons) Electronic Engineering – 2014/15 1 Chapter 1: Introduction As one of the student of Engineering, we should proud that what have we have study. This is because nowadays Engineering is one of the toughest courses in most study road. That‘s why Accreditation of Engineering and Technology (ABET) define it as, ―the profession in which knowledge of the mathematical and natural sciences gained by study, experience and practice is applied with judgment to develop ways to utilize, economically, the material and forces of nature for the benefit of mankind‖. It is compulsory that all the Engineering students no matter him or her who study in any college or university must undergo at least one time of work placement, including School of Engineering, Waterford Institute of Technology. Work placement in industry was introduced on the awareness that student can do their practical work well with applying of Engineering theoretical knowledge gained during lecture. It is a great opportunity provided to student to comprehend and appreciate real-life working experience. In this report, it describes the activities carried out during a 15-week, full-time work placement at the Nanotechnology Research Group of Waterford Institute of Technology. The document contains information about the organization and the responsibilities performed throughout the period from 9 February until 5 June 2015. The first part of the report offers an overview of the organization, followed by the working tasks initially agreed upon with the Nanotechnology Group. Hence, it continues to describe in some detail the most relevant projects carried out and their respective analysis. Finally, the report ends with a few learning outcomes and conclusions from this work placement. At the beginning of the internship I formulated several learning goals, which I wanted to achieve:  to see what is like to work in a professional environment;  to see if this kind of work is a possibility for my future career;  to use my gained skills and knowledge and see what skills and knowledge I still need to work in a professional environment;  to get fieldwork experience/collect data in an environment unknown for me;
  • 6. Student Industrial Placement-WIT BEng (Hons) Electronic Engineering – 2014/15 2  to get experience in working in another country/with persons from another culture;  to enhance my interpersonal communication skills; 1.1 Objectives Work placement provided:  To prepare students for employment at the conclusion of their studies by providing an opportunity to relate academic and practical aspects of their work.  To acquaint students with first-hand knowledge of the various aspects of work as they really are in the industry.  To provide students with the opportunity to establish contact with the profession of their choice, hoping that this may lead to employment after their graduation.  To provide the industry an opportunity to assess in advance performance of its potential employees. 1.2 Position and Job Responsibilities during Work Placement During 15 weeks at here, I had been work as a research student in the group of Nanotechnology Research Department of Waterford Institute of Technology. As a research student, the scope of work is to complete programming work and troubleshoot the code of incomplete Solar Monitoring System. Solar Monitoring System is a system that generates final result of solar energy data, for examples daily yield, daily irradiance, specific yield and performance ratio by inserting some of the specific data into the system. These data are very valuable as we need them in order to carry out a direct comparison between the region of Waterford, Ireland and Bangor, Wales. At the same time, data collected from existing solar electricity generating sites in both Ireland and Wales will also be gathered and compared in order to realistically assess the potential for solar power in the cross-border region. In this system, it contains a lot of debugging errors when the system is running. Hence, I have to interpret and investigate the former error coding in order to find out where is the actual location of them located. During the discovery of the error coding,
  • 7. Student Industrial Placement-WIT BEng (Hons) Electronic Engineering – 2014/15 3 a modification and changes on the coding is indeed to keep the system running free of errors even also improve the system. This process has to be tested repeatedly as when an error exists at certain part of the code, it might not work well in the next coming codes. Therefore, every time I have to examine the codes and test debug run of the system after modifying the codes. After the completion of coding on this system, I have to test the system whether it fully functioning or not by browsing the specific data and then make a comparison on outcome data with previous data. Furthermore, I have to analyse and organise all the solar monitoring data by using the new-created system. As I early mentioned, these data are using to make a comparison between 2 regions, therefore I need to make a performance analysis of Waterford Weather Station for both the year 2014 and 2015. Inside performance analysis, it contains a monthly summary on Solar Irradiance, System Yield, Specific Yield, Performance Ratio and soon on. Moreover, graphical and schematic diagrams for monthly and annual weather station data were also prepared to support the data and provide a visual presentation of the data. These data will have been updated and can be copied into the website as required. At last, I got to make another copy of performance analysis for WIN-IPT in order to assimilate the format of the Weather Station Data of Waterford with Weather Station Data of Bangor. This is because WIN-IPT will need both of these data to develop a number of portable Solar Energy Monitoring stations and carryout a direct comparison between the two regions. I‘m feel honoured that can work with this group that offered me to learn lots of programing skills, knowledge, and experiences on computer system and also the area of Photovoltaic (PV) technologies. Furthermore, I also had been trained to be a) Instil the qualities of integrity, responsibility and self-confident. b) Instil spirit of teamwork and good relationship between students and workers.. c) Expose to actual working environment.
  • 8. Student Industrial Placement-WIT BEng (Hons) Electronic Engineering – 2014/15 4 1.3 Work Placement Organisation 1.3.1 WIN-IPT Profile WIN-IPT (stands for The Wales Ireland Network for Innovative Photovoltaic Technologies) is an industry-driven initiative, designed to improve modernisation and develop business opportunities for small and medium-sized enterprises (SMEs) working in the area of Photovoltaic (PV) technologies. The PV sector is growing rapidly, with annual growth rates exceeding 25% seen in the EU. Yet, with weak R&D Infrastructure bases, the PV market is 1/200th of the EU average in Ireland and 1/20th in Wales. The development of a network of expertise to provide research- informed knowledge, in addition to laboratory and manufacturing support, is required to bring the cross-border PV market into line with EU norms. Therefore, WIN-IPT will create an inter-regional (West Wales and South-East Ireland) centre of PV expertise through knowledge transfer between higher education research institutes, industry and local authorities. They are willing to provide direct R&D assistance and consultancy services to SMEs in the PV sector. Specifically, WIN-IPT will deliver direct R&D support to develop: • Self-powered wireless sensors for building management and control functions • Self-powered lighting and display technologies for building navigation • Low-cost printable photovoltaic device manufacturing processes • Next generation Solar Cell technologies – Organic Photovoltaic (OPV) In addition the network will monitor the performance of existing PV electricity generators and investigate the potential for further exploitation of solar energy in the cross-border region. WIN-IPT actions will result in a better informed industry, with greater confidence for investing in PV and low carbon technologies. Well, this 3-year initiative (2012–2014) is part-funded by the European Regional Development Fund (ERDF), through the Ireland Wales Programme (INTERREG 4A).
  • 9. Student Industrial Placement-WIT BEng (Hons) Electronic Engineering – 2014/15 5 1.3.2 WIN-IPT Staff Person, Academic Partners and Industrial Partners There are 3 different academic organisation s from different country included in various kind projects of WIN-IPT: Waterford Institute of Technology from Ireland, Swansea University from United Kingdom, and lastly was Bangor University from Wales. Below were the detail of staff and description of them: 1.3.2.1 Staff Person a) Waterford Institute of Technology (WIT), Ireland  Brian Murphy  Joseph O‘Mahony  Dong Yang (Kevin)  Yiyang Sun (Bill)  Daniel Tiemann  Mandy O‘Neill  Ken Deevy  Eleanor Owens  Panagiotis Manesiotis  Mervin Doyle  Colm Tynan  Derek Sinnott  Stephen Norton b) Swansea University, UK  David T. Gethin  Tatyana V. Korochkina  Tim Claypole c) Bangor University  Jeff Kettle  James Wang  Eva Campo  Xianfeng Chen
  • 10. Student Industrial Placement-WIT BEng (Hons) Electronic Engineering – 2014/15 6 1.3.2.2 Academic Partner a) Waterford Institute of Technology, Waterford City, Ireland  School of Engineering The School is comprised of the departments of Architecture, Construction & Civil Engineering, Engineering Technology, and Trade Studies. It provides professionally accredited flexible pathways for lifelong learning in a variety of engineering, architecture and built environment disciplines. It includes three Departments and is home to a broad range of education courses and research programmes from Higher Certificate to Doctorate at Levels 6-10 on the Irish National Framework of Qualifications. Besides, the students increasingly work in interdisciplinary teams to help solve real world problems to gaining specialist individual knowledge and skills. Most of the degree programmes also include an Industrial Placement semester in Ireland or overseas. The innovative research activities are typically carried out in partnership with local, national and international companies, organisations and communities.  Pharmaceutical & Molecular Biotechnology Research Centre (PMBRC) The Pharmaceutical and Molecular Biotechnology Research Centre (PMBRC) is an applied research centre which aims to support the sustainable growth of the pharmaceutical and healthcare industry in the south east of Ireland. Situated in the heart of the region on the WIT campus, the centre seeks to stimulate research and innovation, allowing companies to embed R&D into their activities. The PMBRC has established links with national and international partners in industry, academia and medical care institutions. The PMBRC Gateway is delivering solutions for industry in the pharmaceutical and healthcare sectors in areas such as drug delivery, process technology, biotechnology, biomedical and separation science. PMCRC offers industry:  Physico-chemical characterisation of materials.  Advanced analytical capability.  Formulation, process development and drug delivery
  • 11. Student Industrial Placement-WIT BEng (Hons) Electronic Engineering – 2014/15 7 b) Swansea University, Singleton Park, Swansea, Wales  Welsh Centre for Printing & Coating (WCPC) WCPC is one of the World's leading centres for research and development of printing and coating processes. The WCPC has expertise in screen, flexographic, lithographic, rotogravure, digital and pad printing. In addition the WCPC also has experience in the modelling of the print process, using techniques such as finite element, finite difference and statistical and neural networks. The comprehensive laboratories are fully equipped for sample analysis and characterization of material properties relevant to the print process. Furthermore, the WCPC has access to the extensive facilities within Swansea University. The multi-disciplinary staff includes post-doctoral and PhD researchers from both industrial and academic backgrounds, together with support staff. The expertise in the fundamental science and its practical application to improving process quality and productivity is used to provide assistance identified by individual companies, problem solving or developing specific courses for the transfer of information. c) Bangor University, Dean Street, Bangor, Gwynedd, Wales  School of Electronic Engineering With an international reputation as a centre that undertakes both fundamental and applied research into organic electronic materials and devices, the School of Electronic Engineering encourages collaboration both nationally and internationally. The excellent research facilities for organic electronics have been instrumental in attracting collaboration from as far afield as Brazil, Germany, Japan, Spain and Taiwan. Current research programmes include:  Organic TFTs and circuits  Organic memory  Interfaces in organic devices  Organic photovoltaics (OPVs)  Sensors  OLEDs
  • 12. Student Industrial Placement-WIT BEng (Hons) Electronic Engineering – 2014/15 8 The School of Electronic Engineering has two main research themes:  Optoelectronic Devices and Systems (ODS),  Organic Electronics (OE), with further activity in laser micromachining being undertaken in the University‘s spin-out company UK LMC Ltd based in the OpTIC Technium in St Asaph. Through a combination of basic, strategic and applied research these groups aim to develop fundamental understanding of key physical mechanisms and also aim to develop commercially exploitable technology.
  • 13. Student Industrial Placement-WIT BEng (Hons) Electronic Engineering – 2014/15 9 1.3.3 WIN-IPT Working Projects They have few of key projects: Organic Photovoltaic (OPV), Solar Monitoring, Printed Devices, and lastly is Energy Harvesting. a) Energy harvesting Energy harvesting technologies provide a model replacement for traditional batteries in applications where battery power is undesirable due to the cost associated with battery replacement or where the use of batteries are prohibited due to practical access limitations. These technologies are ideal for wireless sensors, especially in building retrofit applications where direct power sources are unavailable or costly to implement. An energy harvester will gain energy from its ambient environment and convert it into usable electrical energy, capable of powering small devices such as the ultra-low power wireless sensor technology provided by Analog Devices, Ireland. Linking this technology with the innovative high performance DSSC technology developed by SolarPrint Ireland, WIN-IPT will demonstrate state-of-the-art energy harvesting applications through the deployment of ambient powered Wireless Sensor Networks for the control of energy use in a variety of buildings in the South-East of Ireland and North Wales. These buildings will range from historical public sites to ultra-modern high efficiency buildings. Furthermore, WIN-IPT will combine this technology with the innovative ASTRAL technology, developed by the Telecommunications Software & Systems Group (TSSG) at WIT, to produce a novel building energy control product. Capable of a simple retrofit into existing building stock, this product will assist building managers to reduce the energy costs associated with the operation of their buildings. b) Printed devices Printing processes, such as screen printing, flexography, gravure, offset lithography and inkjet, which are common to the graphic arts industry can be deployed for the mass production of low-cost functional electronic devices such as thin film transistors, solar cells and light emitting diodes.
  • 14. Student Industrial Placement-WIT BEng (Hons) Electronic Engineering – 2014/15 10 The combination of printing expertise, available at the Welsh Centre for Printing and Coating (WCPC) at Swansea University, and organic device development and characterisation expertise, available at Bangor University and Waterford Institute of Technology, will form an innovative research cluster to develop new technologies and manufacturing processes for photovoltaic and photo emissive devices. This knowledge cluster will work with industrial partners to develop specialised conductive ink formulations that will lead to the development of novel devices. c) Solar monitoring North Wales and the South-East of Ireland share a common mild climate, with similar sunshine patterns, and should therefore be capable of generating similar amounts of solar electricity. While support for the roll-out of solar electricity generation is comparatively strong in relation to other renewable sources in North Wales, the opposite is the case for Ireland. Here the desire for increased fuel diversity has not fully addressed the potential for solar power and the development of grid integration solutions for renewables. WIN-IPT will address this shortfall in policy by comparing solar energy yields on both sides of the cross-border region. Working with innovative companies such as Egnitec and Pure Wafer Solar, WIN-IPT will develop a number of portable Solar Energy Monitoring stations and carryout a direct comparison between the two regions. Data collected from existing solar electricity generating sites in both Ireland and Wales will also be gathered and compared in order to realistically assess the potential for solar power in the cross- border region. Feeding into this will be a survey to determine the potential total rooftop solar electricity yield for Waterford City in South-East Ireland. WIN-IPT Network‘s activity will be guided by relevant industrial experiences to ensure that the barriers to market roll-out can be addressed from the perspective of both the public and the private sectors.
  • 15. Student Industrial Placement-WIT BEng (Hons) Electronic Engineering – 2014/15 11 Solar Monitoring Data: WIT SOLAR MONITORING FACILITY, Waterford City, Ireland (Latitude: 52.244886, Longitude: -7.140378) BANGOR UNIVERSITY SOLAR MONITORING FACILITY, Dean Street, Bangor, Gwynedd, LL57 1UT, Wales (Latitude: 53.22963, Longitude: -4.12402) d) Organic Photovoltaic Organic Photovoltaic (OPV) devices, based on small molecules and polymers, have the potential to provide a low-cost alternative to silicon in the generation of solar electricity. With reported laboratory power conversion efficiencies exceeding 10%, and the potential for manufacture using suitable printing processes, OPV is an exciting future technology. Key outstanding issues to be addressed include:  The identification of organic molecules/polymers that can be prepared in ink formulation for printing  Optimisation of the lifetime and performance of OPV devices Of particular interest is the ability to integrate the manufacture of these devices with other printable technologies to produce fully functional self-powered devices of high reliability. WIN-IPT will work with industrial partners to develop a knowledge cluster in the cross-border region to support this emerging technology.
  • 16. Student Industrial Placement-WIT BEng (Hons) Electronic Engineering – 2014/15 12 Chapter 2: Projects, Tasks and Activities During my work placement at Nanotechnology Research Group in WIT, I have worked on different tasks, projects and activities. The projects and activities can be divided into weekly tasks that involve programming work and office work that have to be conducted at the actual events. 2.1 Weekly Tasks and Activities Description Week 2 to week 9  Redesign a new interface of Weather Station Data.  Interpreted and investigated the former code with errors.  Modified it and improved the previous system.  Examined and tested the code repeatedly until no error exists.  Tested the completed system whether it fully utilized or not. Start from week 2, I have received the first task of my project that is to identify and resolve the errors of previous system of Solar Energy Monitoring. The Solar Energy Monitoring System is a system used to calculate and generate final result of solar energy, for instances: daily yield, daily irradiance, specific yield and performance ratio after gathering the MPP Data and Logfile Data. These results will then ready to copy into the website as required after the documentation. Meanwhile, it is Microsoft Visual Studio in base system which means that I can write my programming coding and interface design in VB mode. At first, I need to redesign a new interface of the system with more user-friendly and easy to use. I had made minor changes on interface of this system. For instances: I set the bigger size of font to let the user easy to recognize and won‘t be easily wrong press. In addition, I also hide some of the buttons so that the user won‘t be confuse and follows the step when they using of this system. The hidden buttons will be showed respectively when it reaches its function. Below are some differences between previous system and new created system:
  • 17. Student Industrial Placement-WIT BEng (Hons) Electronic Engineering – 2014/15 13 Previous Solar Monitoring System
  • 18. Student Industrial Placement-WIT BEng (Hons) Electronic Engineering – 2014/15 14 New Interface Solar Monitoring System
  • 19. Student Industrial Placement-WIT BEng (Hons) Electronic Engineering – 2014/15 15 After design for the interface, I then started to interpreted and investigated the former code in order to fix into my new-design system. When the errors exist, I need to modified the codes in another way to keep the system running free of error even improve the system. This process has to be done repeatedly as when an error exists at certain part of the code, it might not work well in the next coming codes. Therefore, every time I have to examine the codes and test debug run of the system after modifying the codes. For the coding, I will explain more details in chapter 2.1.1. Week 10 to week 15  Collected the data at root top of Engineering Building of WIT.  Managed and organised annual and monthly weather station data for year 2014 and 2015  Prepared graph and schematic diagram for annual and monthly weather station data.  Summarised the annual and monthly weather station data by collection of information. During week 10, I was accompanied by Yang Dong in order to collect the MPP and logfile Data from WIT solar monitoring facility which is the root top of engineering building of WIT. The Solar Monitoring Facility at Waterford Institute of Technology is comprised of i) Weather Station - Davis Instrument Vantage Pro 2, with Solar Radiation and UV Sensors ii) PureWafer 235W Polycrystalline Silicon Solar Panel, inclined at 37 degrees to the horizontal iii) Egnitec PVMS250 PV Measurement System, for logging PV data
  • 20. Student Industrial Placement-WIT BEng (Hons) Electronic Engineering – 2014/15 16 PureWafer 235W Polycrystalline Silicon Solar Panel Davis Instrument Vantage Pro 2 PVMS250 PV Measurement System
  • 21. Student Industrial Placement-WIT BEng (Hons) Electronic Engineering – 2014/15 17 The Davis Instrument Vantage Pro2 weather station series function as to measure barometric pressure, temperature, humidity, rainfall, wind speed and direction, UV/solar(with additional of Solar Radiation and UV Sensor) and soon on. It consists of 2 components: the Integrated Sensor Suite (ISS) which houses and manages the external sensor array; and the weather station console which provides the user interface, data display, A/D conversion and calculations. The Integrated Sensor Suite (ISS) collects outside weather data and sends the data to a Vantage Pro2 console. The standard version of the ISS contains a rain collector, temperature sensor, humidity sensor and anemometer. Temperature and humidity sensors are mounted in a passive radiation shield to minimize the impact of solar radiation on sensor readings. The anemometer measures wind speed and direction and can be installed adjacent to the ISS or apart from it. Integrated Sensor Suite Vantage Pro2 Weather Station console displays and records the station‘s weather data, provides graph and alarm functions, and interfaces to a computer using the optional WeatherLink® software. This instrument is actually where the output of Logfile Data I used. Furthermore, Vantage Pro2 weather station also includes 2 additional sensors which are UV Sensor and Solar Radiation Sensor. Solar Radiation and UV Sensors is to measure global radiation, the sum at the point of measurement of both the direct and diffuse components of solar irradiance. The sensor‘s transducer, which converts
  • 22. Student Industrial Placement-WIT BEng (Hons) Electronic Engineering – 2014/15 18 incident radiation to electrical current, is a silicon photodiode with wide spectral response. From the sensor‘s output voltage, the console calculates and displays solar irradiance. It also integrates the irradiance values and displays total incident energy over a set period of time. Vantage Pro2 Weather Station console The solar panel that our facility used to record the photovoltaic energy output is PureWafer 235W Polycrystalline Silicon Solar Panel. In order to get the maximum solar energy productivity, the solar panel we have inclined it at 37 degrees to the horizontal. PVMS250 will then collect the measurement of PV output and record into MPP Data file. PureWafer 235W Polycrystalline Silicon Solar Panel
  • 23. Student Industrial Placement-WIT BEng (Hons) Electronic Engineering – 2014/15 19 The PVMS250 unit is a dedicated photovoltaic measurement system. It incorporates a maximum power point tracker (MPPT) and current-voltage (IV) curve tracing capability, as well as two PT100 temperature sensor inputs. Between regular IV traces the PV module under test can be maintained at specific operating conditions: maximum power point (MPP), open circuit or short circuit. PVMS250 Photovoltaic Measurement Systems In order to let the user to get the data easily when using of this system, I had arranged all the MPP Data and Logfile Data into a folder in sort of month and year. Afterwards, I begin to manage and organise the MPP Data and Logfile Data by using the Solar Monitoring System. This is because I need to make a performance analysis for the year 2014 and year 2015. For the performance analysis, it contains of 12 months of data and I have to make a monthly summary on Solar Irradiance, System Yield, Specific Yield, and Performance Ratio for each month. i) Solar Irradiance- Total solar energy was available. ii) System Yield- Total of actual energy produced by the system. iii) Performance Ratio- Measure of the quality of a PV system iv) Specific Yield- Measure of energy produced per unit of installed capacity. At the same time, I also have to prepare graphical diagram in order to support the data and provide a visual presentation of the data above. Therefore, an annual summary can be completed by doing this. Graphs and Data (including on Monthly Summary sheet) will have been updated and can be copied into the website as required.
  • 24. Student Industrial Placement-WIT BEng (Hons) Electronic Engineering – 2014/15 20 2.2 Programming Work The projects that I have worked on during my work placement can be divided into the following 5 parts, the figure below shown that the flow chart of Solar Monitoring System. Figure 2.1 Flow Chart of Solar Monitoring System First part of system is to browse the monthly Logfile data of weather station data. Inside this text file consists of various kinds of solar monitoring data: date, time, temperature, wind speed, wind direction, humidity, solar radiation, solar energy and soon on in every minute which are important for data processing and documentation. For the second part, the function is to load the selected Logfile by clicking ‗load‘ button and then to transfer it into the excel form of data grid view. The purpose of 3rd part is to calculate the average temperature, hourly and daily solar irradiation per day based on the value of collected data (temperature and solar radiation) and solar formulae. Each of the data will printed on the second data grid view by daily. The 4th part of system is to fill in the PV (photovoltaic) data by inserting the certain month of MPP Data which is in ‗csv‘ form of excel file. After inserting MPP Data, the system Part 1: Browse Button Part 3: Read Button Part 2: Load Button Part 4: PV Button Part 5: Save Button Solar Monitoring System
  • 25. Student Industrial Placement-WIT BEng (Hons) Electronic Engineering – 2014/15 21 started to calculate hourly and daily PV output which is the power generated by photovoltaic. Moreover, it also compute the specific yield and performance ratio based on certain formulae. For the 5th part is the last part of system, is to transfer and save all the processed data into excel form of data. The data saved in the form of excel will be exactly same as the data that showed in the data grid view of the system. 2.2.1 Description of coding of Solar Monitoring System Part 1: Browse Button Figure 2.2 Function WeatherStationData_Load Figure 2.2 shows that the default loading of Solar Monitoring System. I set that the ability of each button except ‗Browse‘ button as false so that no user is pressing that button before clicking the ‗Browse‘ button. Figure 2.3 Function ButtonBrowse_Click
  • 26. Student Industrial Placement-WIT BEng (Hons) Electronic Engineering – 2014/15 22 Figure 2.3 states that the function of button ‗Browse‘. I inserted a dialog function called as ―FolderBrowserDialog‖ so that to let the user to search the Logfile Data folder location in ‗txt‘ type of file from the PC. If there is a multiple Logfile Data in that folder, it will repeat and continue add into the listbox until the last ‗txt‘ file. Once the user selects any one of the Logfile Data from listbox, the system will enable the button ‗Load‘ to ready for the next step. Part 2: Load Button Figure 2.4 Function ButtonLoad_Click Figure 2.4 show that the function of button ‗Load‘. I had clear the row and set 38 columns of data grid view. This is because inside the Logfile Data has 38 columns of different type of data, for examples: Solar Radiation, UV Index, Wind Direction, Wind Speed, Temperature and soon on. A ―For Loop‖ is needed here to print out the name index of each of data. After that, another ―For Loop‖ is needed to read the value of row of Logfile Data. As we know, each row consists of collected various solar data per minute. It takes some time to read the data as monthly logfile data consists of 43 thousand of rows to print into the DataGridView1, which is ―Weather Data Load‖ tab control. After the completion of loop, the data grid view will add another row to
  • 27. Student Industrial Placement-WIT BEng (Hons) Electronic Engineering – 2014/15 23 indicate that the progress is finish. Therefore, the system will proceed to another tab control which is ―Weather Station Data‖ and the GroupBox1 which contains of button ‗Read‘ and button ‗PV‘ is enable to show for next function. Figure 2.5 Function FillingResults Figure 2.5 shows that the private sub function of FillingResults which is used to print out each of the header name into DataGridView2. This function must be done before the function of ‗Read‘ button because the header must be given to let the user know the type of the value. Part 3: Read Button Figure 2.6 Function ButtonRead_Click Figure 2.6 shows that the function of button ‗Read‘. After completion of running function read(), it enable the ‗PV‘ button.
  • 28. Student Industrial Placement-WIT BEng (Hons) Electronic Engineering – 2014/15 24 Figure 2.7 Function read() Figure 2.7 shows the function read(). At first, I make some declaration on which data on I used. Therefore, a ―For Loop‖ is needed to accumulate the total value of solar radiation and temperature per day in order to get the average value of them. As you can see, after accumulate every minute of the value of solar radiation and temperature, ‗samples‘ will also accumulate by 1 until the end of the day. It mean that the values
  • 29. Student Industrial Placement-WIT BEng (Hons) Electronic Engineering – 2014/15 25 will then divided by ‗samples‘ which is total 1440 minutes (24 hours x 60 minutes) to get the average value on that day. This step is keep repeated until the end of the month. As I mentioned in Figure 2.1.4, each of the value of average temperature, hourly solar irradiation and daily solar irradiation will then print on their column respectively day by day. Part 4: PV Button Figure 2.8 Function ButtonPV_Click Figure 2.8 shows the function of button ‗PV‘. As the same way as button ‗Browse‘, I inserted ―FolderBrowserDialog‖ to let the user to search another type of file: MPP Data in ‗csv‘ form. The ―While Loop‖ is place here to make sure the user to insert the correct month of MPP Data with Logfile Data as a message box will appear to warn the user to browse the MPP Data again and again until the right month of MPP Data inserted. If the inserting of MPP data is same month of logfile data, then it will continue run through the function of read2().
  • 30. Student Industrial Placement-WIT BEng (Hons) Electronic Engineering – 2014/15 26 Figure 2.9 Function read2() Once the system run here, it will calculate hourly and daily PV output which is the power generated by photovoltaic. Moreover, it also compute the specific yield and performance ratio based on certain formulae.
  • 31. Student Industrial Placement-WIT BEng (Hons) Electronic Engineering – 2014/15 27 Part 5: Save Button Figure 2.10 Function ButtonSave_Click Figure 2.10 is the function of transferring and saving all the processed data into excel form of data. The data saved in the form of excel will be exactly same as the data that showed in the data grid view of the system. This part of system does not face lots of problem as the coding run smoothly and data in excel file is exact the same with the system.
  • 32. Student Industrial Placement-WIT BEng (Hons) Electronic Engineering – 2014/15 28 2.2.2 User Guide for Solar Monitoring System In order to use the system, below is the guidance of the way to access the Solar Monitoring System. 1. Import the logfile data by clicking the ‗Browse‘ button. i. It will bring u to a new interface that to browse for the folder, it is recommend that put all the Logfile Data into a specific folder so that easier to find the location. ii. After select the folder where the Logfile Data put inside, click ‗OK‘ button to proceed to next step. iii. The listbox will display the Logfile Data in ‗txt‘ type. The ‗Load‘ button is unable to click as none of the Logfile Data is choose.
  • 33. Student Industrial Placement-WIT BEng (Hons) Electronic Engineering – 2014/15 29 2. Select any one of logfile data and press the button ‗Load‘. i. The system will need some time to access the data and then transform them into data grid view on the ―Weather Data Load‖ tab control page. ii. After complete the loading, all the Logfile Data will display on the tab control ―Weather Data Load‖. 3. Click the ‗Read‘ button to proceed the next step. i. This step also need some time to run as it calculate the the average temperature, hourly and daily solar irradiation per day based on the data in logfile. ii. After the completion of calculation, all the results will display on the tab control of ―Processed Weather Data‖.
  • 34. Student Industrial Placement-WIT BEng (Hons) Electronic Engineering – 2014/15 30 4. Import the MPP Data in ‗csv‘ type of excel file by pressing ‗PV‘ button. i. Make sure that the month of MPP Data file must be exact the same month with Logfile Data. ii. Same as above, the system also need some time to run through the calculation of hourly, daily PV output, specific yield and performance ratio. iii. The results will also show at the same page.
  • 35. Student Industrial Placement-WIT BEng (Hons) Electronic Engineering – 2014/15 31 5. Press the ‗Save‘ button to save all the results in ―Processed Weather Data‖ and transform into excel form.
  • 36. Student Industrial Placement-WIT BEng (Hons) Electronic Engineering – 2014/15 32 2.3 Office Work Once done for the programming part of Solar Monitoring System, I had got to begin to manage and organise the MPP Data and Logfile Data by using the Solar Monitoring System. This is because I need to make a performance analysis for the year 2014 and year 2015. For the performance analysis, it contains of 12 months of data and I have to make a monthly summary on Solar Irradiance, System Yield, Specific Yield, and Performance Ratio for each month. i) Solar Irradiance- Total solar energy was available. ii) System Yield- Total of actual energy produced by the system. iii) Performance Ratio- Measure of the quality of a PV system iv) Specific Yield- Measure of energy produced per unit of installed capacity. At the same time, I also have to prepare graphical diagram in order to support the data and provide a visual presentation of the data above. Therefore, an annual summary can be completed by doing this. Graphs and Data (including on Monthly Summary sheet) will have been updated and can be copied into the website as required. At last, I got to make another copy of performance analysis for WIN-IPT in order to assimilate the format of the Weather Station Data of Waterford with Weather Station Data of Bangor. This is because WIN-IPT will need both of these data to develop a number of portable Solar Energy Monitoring stations and carryout a direct comparison between the two regions.
  • 37. Student Industrial Placement-WIT BEng (Hons) Electronic Engineering – 2014/15 33 2.3.1 Office work for WIT Weather Station As I mentioned in my weekly log, I need to sum up some of the value respectively as I need to make a summary of monthly and annually performance analysis on Waterford Weather Station Data. There are a few values that I needed to calculate: Daily Solar Irradiance, Daily Photovoltaic Output, Specific Yield, and Performance Ratio. At here, I would like to explain each of these terms: i) Daily Solar Irradiance is a measure of the solar energy (measured in kWh/m2) by daily produced by the Sun in the form of electromagnetic radiation. ii) Daily PV Output is the amount of usable energy (measured in kWh) produced by the system by daily after harvesting of solar energy. iii) Specific Yield is the total annual energy generated per unit of installed capacity (measure in kWh/kWp). It is often used to help determine the financial value of an array and compare operating results from different technologies and systems iv) Performance Ratio is a measure of the quality of a PV system (including BOS components) and its performance in a specific location – dimensionless. It shows up losses due to shading, soiling, inverter losses, irradiation, temperature etc. It is less dependent on irradiation levels than specific yield. The formulae of performance ratio is given below: ( ( ) ( ) ) Performance Ratio values: >0.8 – good system 0.65-0.8 – average system <0.65 – poor system At first, I have to total up the values of Daily Solar Irradiance, Daily PV Output, and also Specific Yield for specific month sheet. This is because I need the total amount of Solar Irradiance and PV Output to calculate the average performance ratio for that
  • 38. Student Industrial Placement-WIT BEng (Hons) Electronic Engineering – 2014/15 34 month. After that, I can make a calculation on Performance Ratio once I get the total values for both Daily Solar Irradiance and Daily PV Output. By using the formula given above, total of Daily PV Output divided by total of Daily Solar Irradiance and also the peak power of PV which is 0.235 (as ours module the PV using is 235Wp). Therefore, 2 graphical diagrams for both Daily Solar Irradiance and Daily PV Output are required to support the data and provide a visual presentation of the data. This procedure need to conduct for several times in order to make up the annually performance analysis.
  • 39. Student Industrial Placement-WIT BEng (Hons) Electronic Engineering – 2014/15 35 For the annually performance analysis, a new sheet is opened to copy the monthly weather station data into here. As you can see, the values for each month of the PV Output, Solar Irradiance, Specific Yield and Performance Ratio are copied into this page in order to make a graphical diagram for the purpose of visualisation presentation.
  • 40. Student Industrial Placement-WIT BEng (Hons) Electronic Engineering – 2014/15 36 Besides, I have to prepare another performance analysis for WIN-IPT Weather Station Data. I was given another Solar Monitoring System to do this. The new Solar Monitoring System was using of database of Microsoft Access to run through the program. Below is the user guide for Performance Database for WIN-IPT Weather Station Data: 1. Open PV_performance.mdb (access database) a. FIRST TIME ONLY – the user will need to delete all the records form the tbl_WeatherData table 2. Import egnitec data a. Move all MPP Data files into a folder b. Open frmImportData i. Import Folder by clicking ‗…‘, it will select folder where MPP Data files are located. ii. File Type – set to default mode ―Egnitec MPP_IV‖ iii. Click on ‗Validate‘, it should return with ―Validation Complete‖ and File Count will have the number of valid data files it found. iv. Click on ―Process Data‖, it should return with ―Processing Complete‖ and Record Count will have the number of import records processed. Import File will have name of the file holding the import records. v. Click on ―Import Data‖, the user will be asked if they wish to ―Delete Existing Records from Table?‖ – (FIRST TIME ONLY) select ―Yes‖ the first time to use this database (this will delete all the existing Bangor data), otherwise ―No‖.
  • 41. Student Industrial Placement-WIT BEng (Hons) Electronic Engineering – 2014/15 37 vi. The user may get a message warning that they won‘t be able to undo the paste append – click ―Yes‖ to continue. The user will get an ―Import Complete‖ message once the data has been imported. 3. Import Weather Data a. Click on ―External Data‖ ribbon tab heading b. Click on ―Text File‖ on the ―Import‖ section of the ribbon – this will bring up ―Get External Data –Text File‖ dialog box i. File name – select the weather Data Logfile. ii. Click on ―Append a copy of the records to the table‖ radio button iii. Select ―tbl_WeatherData‖ from combo list iv. Click OK to bring up the ―Import Text Wizard‖ dialog
  • 42. Student Industrial Placement-WIT BEng (Hons) Electronic Engineering – 2014/15 38 v. Click ―Advanced...‖ to bring up Import Specification dialog vi. Click ―Specs...‖, select ―Weatherlink Import Specification‖ from list and Click on ―Open‖. This will open the ―Weatherlink Import Specification‖ in the Import spec dialog.
  • 43. Student Industrial Placement-WIT BEng (Hons) Electronic Engineering – 2014/15 39 vii. Click ―OK‖ to bring back to the Import text File dialog. viii. Click ―Finish‖ to import the data. ix. Access will come back with ―Access unable to append all the data to the table‖ x. Click ―Yes‖ to proceed with appending data to table. xi. ―Save Import Steps‖ dialog will be displayed. Click ―Close‖. 4. Extract Performance Monitoring Data a. Open ―PV_Performance_2015.xlsx‖ excel spreadsheet b. Open frmExportData form in Access – it might take a while to load, as it builds a list of valid export months. c. Select the month for which you wish to extract data. d. Click on ―Daily Yield‖ to extract daily yield data (it might take a while to run!). A query will be displayed with the data records. e. Copy the data to the clipboard - Right click on box at top left of query and select ―Copy‖
  • 44. Student Industrial Placement-WIT BEng (Hons) Electronic Engineering – 2014/15 40 f. Switch to the spread sheet and select cell A27 and paste the data. g. This will update the data on the spread sheet and the associated graph and calculated monthly totals. The spread sheet was designed with two modules in mind, so I will probably have to change it a bit as I only have one module. h. Repeat for ―Solar Energy‖ and ―Monitoring Availability‖ (use the ―Monitoring Availability (Post May 2014)‖ button), pasting into cells indicated above. 5. Monthly Summary –I will need to change formulae for Specific Yield, for ours module is 235Wp. 6. Graphs and Data (including on Monthly Summary sheet) will now have been updated and can be copied into the website as required.
  • 45. Student Industrial Placement-WIT BEng (Hons) Electronic Engineering – 2014/15 41 On a monthly basis: Monitoring Availability: a measure of what was measured and when was it measured, it is very useful as a guide to how accurate the other figures are. Energy Yield : a measure of actual energy produced (in kWh). Daily Irradiance : a measure of how much energy was available (in kWh/m2). Therefore, I got to calculate performance figures like Energy Yield, Specific Yield, Performance Ratio & Total Irradiation based on certain formulae. On an annual basis I need to report monthly totals for System Yield and Irradiation, Specific Yield and Performance Ratio like the same way as WIT Weather Station Data.
  • 46. Student Industrial Placement-WIT BEng (Hons) Electronic Engineering – 2014/15 42 Chapter 3: Learning Outcomes Work placement is the beginning of the road that will lead me what I want to be at after my graduation. Besides, it provides a good opportunity for me to practice I need to perform and also prepares me for the future life that I aim at. In this chapter I will reflect on my work placement.  Improving of Practical Skill The work placement let me have the opportunity to connect the learning of theory in the class with current industry challenges, and have exposure to the latest technologies. It was exactly what I needed to foster the lack of practical skills I had. For example, I had learnt of programming language and done a mini assignment on this programming during last semester and this work placement provide me a great chance to apply my programming knowledge fully on Solar Monitoring System. I would acquire practical experience to complement the theoretical content of my studies. In addition, I was taught some basics on data collection, data processing and setting-up research projects.  Learning of New Theoretical Knowledge During my work placement period in the Nanotechnology Research Group of WIT, it was a new learning on my theoretical knowledge, when I have been learned the course of Electronics Engineering in the classroom. Through this work placement, I had been learnt more about the knowledge on renewable energy which is solar energy and also photovoltaic system. This knowledge might be helpful for me to search for my future career.  Enhancing of Interpersonal Communication Skills During my work placement period, the Interpersonal skills, the skills I use every day to communicate and interact with other people, are greatly improved for me. Not only how I communicate with others, but also I got confidence and my ability to listen and understand. Problem solving, decision making and personal stress management are also considered interpersonal skills. Through this internship, I found that I gained many new perspectives, such as problem solving skill, diversity, and good
  • 47. Student Industrial Placement-WIT BEng (Hons) Electronic Engineering – 2014/15 43 communication, attention to detail, time management, self-confidence, responsibility and cultural sensitivity. Although I was reserved in communication at the beginning due to my main language is Chinese language but in the course of months it went better. This is because an interesting and open attitude of the people has helped me a lots in this field. Besides, my supervisor was so kind to answer with patience and teach me much that made this work placement so enjoyable. I had gotten a wonderful internship that spent such a happy moment with all of them.  Work Ethics Related Issue A work placement is an opportunity to learn the skills and behaviours along with the work values that are required for success in the workplace. Workplace ethics are established codes of conduct that reflect the values of the organization or company where you are employed. I have seen possess a willingness to work hard from my supervisor during my work placement period. In addition to working hard it is also important to work smart. This means I acquired the most efficient way to complete tasks and finding ways to save time while completing daily tasks. It‘s also important to care about my job and complete all projects while maintaining a positive attitude.
  • 48. Student Industrial Placement-WIT BEng (Hons) Electronic Engineering – 2014/15 44 Chapter 4 Conclusion After going through the whole period of work placement as a research student, I‘ve observed so many professional activities and learnt them as well. One main thing that I have learned through this internship is time management skills as well as self- motivation. When I first started I did not think that I was going to be able to make myself sit in an office for six hours a day, five days a week. Once I realized what I had to do I organized my day and work so that I was not overlapping or wasting my hours. I learned that I needed to be organized and have questions ready for when it was the correct time to get feedback. From this work placement and time management I had to learn how to motivate myself through being in the office for so many hours. I came up with various proposals and ideas that the group is still looking into using. This work placement program was very fruitful to me because I had to cover many different fields not only cultural part. I also learnt new concepts and new ways of working. During this period I acquired practical experience to complement the theoretical content of my study for campus WIT. In conclusion, this practical training has exposed me with the technical working environment as my preparation to join the workforce upon my completion studies. This work placement experience also helps in producing well-balanced graduates who are not only technically competent but also skilled in interpersonal communication, which is the main moving force of advancement. This work placement was definitely beneficial for me and I‘m grateful and thankful that I got to experience and learn many things.
  • 49. Student Industrial Placement-WIT BEng (Hons) Electronic Engineering – 2014/15 45 References About the Welsh Centre for Printing and Coating in Welsh Centre for Printing and Coating. Retrieve from http://wcpcswansea.com/about/ About WIN-IPT in Wales Ireland Network for Innovative Photovoltaic Technologies. Retrieved from http://www.winipt.eu/index.php/about/ , http://www.winipt.eu/index.php/projects/ Integrated Sensor Suite Installation Manual in Davis Instruments Corp. . Retrieved from http://www.davisnet.com/product_documents/weather/manuals/07395- 249_IM_06152.pdf PMBRC Gateway - Pharmaceutical & Healthcare in Enterprise Ireland. Retrieved from http://www.enterprise-ireland.com/en/research-innovation/companies/collaborate- with-companies-research-institutes/technology-gateway-pmbrc.html PVMS Photovoltaic Measurement Systems—Specification in Engitec. Retrieved from http://www.egnitec.com/downloads/PVMS_Unit_Spec_(1.0).pdf Research in the School of Electronic Engineering in Bangor University. Retrieved from http://www.bangor.ac.uk/eng/research.php.en
  • 50. Student Industrial Placement-WIT BEng (Hons) Electronic Engineering – 2014/15 46 School of Engineering-Welcome in Waterford Institute of Technology. Retrieved from http://www.wit.ie/schools/engineering/school_of_engineering Vantage Pro2 Console Manual in Davis Instruments Corp. . Retrieved from http://www.davisnet.com/product_documents/weather/manuals/07395- 234_IM_06312.pdf
  • 51. Student Industrial Placement-WIT BEng (Hons) Electronic Engineering – 2014/15 47 Appendices
  • 53. BEng (Hons) Electronic Engineering – WIT Work Placement Weekly Log Employment Record Sheet Student: Lee Siang Wei Week Ending: 13 February 2015 Week No. : 1 Day Hours Work Description Monday 6  Have a tour of Nanotechnology Research Group at Engineering Research Building of WIT.  Introduced of the personnel and facilities of the department. Tuesday 6  Detailed orientation to the department‟s work placement project.  Become one of the contributors of the Solar Energy Monitoring Project. Wednesday 6  Familiarize myself with various kinds of data of solar monitoring and harvesting.  Online self-learning of basic theory and knowledge of Solar Energy and Insolation. Thursday 6 Friday 6 SIGNED: DATE: _____________________ Student _____________________ _____________________ Industry Supervisor _____________________ _____________________ WIT Placement Tutor _____________________
  • 54. BEng (Hons) Electronic Engineering – WIT Work Placement Weekly Log Employment Record Sheet Student: Lee Siang Wei Week Ending: 6 March 2015 Week No. : 2 Day Hours Work Description Monday 6  Received first task of the project that is to identify and resolve the errors of previous system of solar energy monitoring.  Online self-revision on basic theory of Visual Basic information. Tuesday 6  Online self -revision on basic theory of Visual Basic information. Wednesday 6  Redesign a new interface of Weather Station Data.  Interpreted and investigated the former code with errors.  Modified it and improved the previous system.  Examined and tested the code repeatedly until no error exists.  Coding Progress:  1st part of system which is „Browse‟ button that used to browse the „txt‟ files of monthly weather station data. (Done)  1st part of system is considered as easier part in overall of the system because its function is only to browse the „txt‟ data from computer. Thursday 6 Friday 6 SIGNED: DATE: _____________________ Student _____________________ _____________________ Industry Supervisor _____________________ _____________________ WIT Placement Tutor _____________________
  • 55. BEng (Hons) Electronic Engineering – WIT Work Placement Weekly Log Employment Record Sheet Student: Lee Siang Wei Week Ending: 13 March 2015 Week No. : 3 Day Hours Work Description Monday 6  Interpreted and investigated the former code with errors.  Modified it and improved the previous system.  Examined and tested the code repeatedly until no error exists.  Coding Progress:  2nd part of system is then to load the monthly „txt‟ files and transfer it into excel form of data grid view. (Pending)  2nd part of system faced a minor problem but it‟s not vital during the loading of „txt‟ files. It takes longer time to load the monthly file and then transform into data grid view. Tuesday 6 Wednesday 6 Thursday 6 Friday 6 SIGNED: DATE: _____________________ Student _____________________ _____________________ Industry Supervisor _____________________ _____________________ WIT Placement Tutor _____________________
  • 56. BEng (Hons) Electronic Engineering – WIT Work Placement Weekly Log Employment Record Sheet Student: Lee Siang Wei Week Ending: 20 March 2015 Week No. : 4 Day Hours Work Description Monday 6  Interpreted and investigated the former code with errors.  Modified it and improved the previous system.  Examined and tested the code repeatedly until no error exists.  Coding Progress:  2nd part of system is then to load the monthly „txt‟ files and transfer it into excel form of data grid view. (Done) Tuesday 6 Wednesday 6 Thursday 6 Friday 6 SIGNED: DATE: _____________________ Student _____________________ _____________________ Industry Supervisor _____________________ _____________________ WIT Placement Tutor _____________________
  • 57. BEng (Hons) Electronic Engineering – WIT Work Placement Weekly Log Employment Record Sheet Student: Lee Siang Wei Week Ending: 27 March 2015 Week No. : 5 Day Hours Work Description Monday 6  Interpreted and investigated the former code with errors.  Modified it and improved the previous system.  Examined and tested the code repeatedly until no error exists.  Coding Progress:  3rd part of system is to calculate the average temperature, hourly and daily solar irradiation based on the value of collected data and solar formulae. (Pending)  3rd part of system is one of the complicated parts because the code still consisting errors and will not return to its real value. Tuesday 6 Wednesday 6 Thursday 6 Friday 6 SIGNED: DATE: _____________________ Student _____________________ _____________________ Industry Supervisor _____________________ _____________________ WIT Placement Tutor _____________________
  • 58. BEng (Hons) Electronic Engineering – WIT Work Placement Weekly Log Employment Record Sheet Student: Lee Siang Wei Week Ending: 3 April 2015 Week No. : 6 Day Hours Work Description Monday 6  Interpreted and investigated the former code with errors.  Modified it and improved the previous system.  Examined and tested the code repeatedly until no error exists.  Coding Progress:  3rd part of system is the „read‟ button functions as to read the data in excel form and calculate the average temperature, hourly and daily solar irradiation based on the value of collected data and solar formulae. (Done)  Finally the values of hourly and daily solar irradiance return to its real value.  This is because some of the coding has mixed together and caused the errors exists. Tuesday 6 Wednesday 6 Thursday 6 Friday 6 SIGNED: DATE: _____________________ Student _____________________ _____________________ Industry Supervisor _____________________ _____________________ WIT Placement Tutor _____________________
  • 59. BEng (Hons) Electronic Engineering – WIT Work Placement Weekly Log Employment Record Sheet Student: Lee Siang Wei Week Ending: 10 April 2015 Week No. : 7 Day Hours Work Description Monday 6  Interpreted and investigated the former code with errors.  Modified it and improved the previous system.  Examined and tested the code repeatedly until no error exists.  Coding Progress:  4th part of system is to calculate the hourly, daily PV output, specific yield and performance ratio on certain month based on certain formulae by inserting Excel „csv‟ files which is consist of MPP data. (Pending)  While the MPP data consists of Impp, Vmpp, Module Temperature 1&2 and Err. Impp and Vmpp are MPP current and MPP voltage that hold the current and voltage reading taken at specific time. Meanwhile, Module Temperature 1&2 are PT 100 temperature from sensor 1&2. Err is the current operating status of the unit.  Encountered a problem that sometimes it can‟t load the Excel csv file and also stuck at 12th line of row. Tuesday 6 Wednesday 6 Thursday 6 Friday 6 SIGNED: DATE: _____________________ Student _____________________ _____________________ Industry Supervisor _____________________ _____________________ WIT Placement Tutor _____________________
  • 60. BEng (Hons) Electronic Engineering – WIT Work Placement Weekly Log Employment Record Sheet Student: Lee Siang Wei Week Ending: 17 April 2015 Week No. : 8 Day Hours Work Description Monday 6  Interpreted and investigated the former code with errors.  Modified it and improved the previous system.  Examined and tested the code repeatedly until no error exists.  Coding Progress:  4th part of system is to calculate the hourly, daily PV output, specific yield and performance ratio on certain month based on certain formulae by inserting Excel „csv‟ files which is consist of MPP data. (Done)  The problem solved by modifying the codes. This is because the „temppath‟ of the coding didn‟t match the original path name of Excel „csv‟ files. Tuesday 6 Wednesday 6 Thursday 6 Friday 6 SIGNED: DATE: _____________________ Student _____________________ _____________________ Industry Supervisor _____________________ _____________________ WIT Placement Tutor _____________________
  • 61. BEng (Hons) Electronic Engineering – WIT Work Placement Weekly Log Employment Record Sheet Student: Lee Siang Wei Week Ending: 24 April 2015 Week No. : 9 Day Hours Work Description Monday 6  Interpreted and investigated the former code with errors.  Modified it and improved the previous system.  Examined and tested the code repeatedly until no error exists.  Tested the completed system whether it utilised or not.  Coding Progress:  5th part of system is to save all the processed data and transferred all of them into excel files. (Done) Tuesday 6 Wednesday 6 Thursday 6 Friday 6 SIGNED: DATE: _____________________ Student _____________________ _____________________ Industry Supervisor _____________________ _____________________ WIT Placement Tutor _____________________
  • 62. BEng (Hons) Electronic Engineering – WIT Work Placement Weekly Log Employment Record Sheet Student: Lee Siang Wei Week Ending: 1 May 2015 Week No. : 10 Day Hours Work Description Monday 6  Collected the data at root top of Engineering Building of WIT.  Arranged MPP Data and Logfile Data into a folder in sort of month and year.  Managed and organised annual and monthly weather station data for year 2014.  Prepared graph and schematic diagram for annual and monthly weather station data.  Summarised the annual and monthly weather station data by collection of information. Tuesday 6 Wednesday 6 Thursday 6 Friday 6 SIGNED: DATE: _____________________ Student _____________________ _____________________ Industry Supervisor _____________________ _____________________ WIT Placement Tutor _____________________
  • 63. BEng (Hons) Electronic Engineering – WIT Work Placement Weekly Log Employment Record Sheet Student: Lee Siang Wei Week Ending: 8 May 2015 Week No. : 11 Day Hours Work Description Monday 6  Managed and organised annual and monthly weather station data for year 2014.  Prepared graph and schematic diagram for annual and monthly weather station data.  Summarised the annual and monthly weather station data by collection of information. Tuesday 6 Wednesday 6 Thursday 6 Friday 6 SIGNED: DATE: _____________________ Student _____________________ _____________________ Industry Supervisor _____________________ _____________________ WIT Placement Tutor _____________________
  • 64. BEng (Hons) Electronic Engineering – WIT Work Placement Weekly Log Employment Record Sheet Student: Lee Siang Wei Week Ending: 15 May 2015 Week No. : 12 Day Hours Work Description Monday 6  Managed and organised annual and monthly weather station data for year 2014.  Prepared graph and schematic diagram for annual and monthly weather station data.  Summarised the annual and monthly weather station data by collection of information. Tuesday 6 Wednesday 6 Thursday 6 Friday 6 SIGNED: DATE: _____________________ Student _____________________ _____________________ Industry Supervisor _____________________ _____________________ WIT Placement Tutor _____________________
  • 65. BEng (Hons) Electronic Engineering – WIT Work Placement Weekly Log Employment Record Sheet Student: Lee Siang Wei Week Ending: 22 May 2015 Week No. : 13 Day Hours Work Description Monday 6  Managed and organised annual and monthly weather station data for year 2014.  Prepared graph and schematic diagram for annual and monthly weather station data.  Summarised the annual and monthly weather station data by collection of information. Tuesday 6 Wednesday 6 Thursday 6 Friday 6 SIGNED: DATE: _____________________ Student _____________________ _____________________ Industry Supervisor _____________________ _____________________ WIT Placement Tutor _____________________
  • 66. BEng (Hons) Electronic Engineering – WIT Work Placement Weekly Log Employment Record Sheet Student: Lee Siang Wei Week Ending: 29 May 2015 Week No. : 14 Day Hours Work Description Monday 6  Managed and organised annual and monthly weather station data for year 2015.  Prepared graph and schematic diagram for annual and monthly weather station data.  Summarised the annual and monthly weather station data by collection of information. Tuesday 6 Wednesday 6 Thursday 6 Friday 6 SIGNED: DATE: _____________________ Student _____________________ _____________________ Industry Supervisor _____________________ _____________________ WIT Placement Tutor _____________________
  • 67. BEng (Hons) Electronic Engineering – WIT Work Placement Weekly Log Employment Record Sheet Student: Lee Siang Wei Week Ending: 5 June 2015 Week No. : 15 Day Hours Work Description Monday 6  Managed and organised annual and monthly weather station data for year 2015.  Prepared graph and schematic diagram for annual and monthly weather station data.  Summarised the annual and monthly weather station data by collection of information. Tuesday 6 Wednesday 6 Thursday 6 Friday 6 SIGNED: DATE: _____________________ Student _____________________ _____________________ Industry Supervisor _____________________ _____________________ WIT Placement Tutor _____________________
  • 69. Monthly Progress Report Week Beginning: 9th February 2015 Week Ending: 27th February 2015 For the 1st week of my internship, I take part in a tour of the Nanotechnology Research Group at Engineering Research Building of WIT and was introduced to various personnel. Lots of facilities and utensils of the department were also introduced on their general use of application and instruction to using them. Following the coming next day, a detailed orientation to the several of internship programs were announced by my internship supervisor. I received my special project assignment and then began to experience the Solar Monitoring Division. WIN-IPT (stands for The Wales Ireland Network for Innovative Photovoltaic Technologies) is an industry-driven initiative, designed to promote invention and develop business opportunities for small and medium-sized enterprises (SMEs) working in the area of Photovoltaic (PV) technologies. They have few of key projects: Organic Photovoltaic (OPV), Solar Monitoring, Printed Devices, and lastly is Energy Harvesting. As I mentioned from above, I was assign to the Solar Monitoring division. This division is to develop a number of portable Solar Energy Monitoring stations and carryout a direct comparison between Bangor (North Wales) and Waterford (South- East of Ireland). Data collected from existing solar electricity generating sites in both Ireland and Wales will also be gathered and compared in order to accurately assess the potential for solar power in the cross-border region. WIN-IPT will comparing solar energy yields on both sides of the cross-border region. Meanwhile, the solar monitoring data consists of 2 facilities which is WIT Solar Monitoring Facility and Bangor University Solar Monitoring Facility. In this division, I have to familiarize myself as soon as possible with numerous kinds of solar monitoring data such as Logfile, MPP (Maximum Power Point) Data, IV Main, and IV Data. Logfile stores extra information (maximum and minimum temperature, humidity, wind speed, wind direction, solar energy and soon on) for each unit. MPP Data file holds each set of MPP measurements (current, voltage, 2x module
  • 70. temperatures) as well as an indicator of system operating status. IV Main file holds one record for each IV curve and IV Data file holds each of the current-voltage points on the curve as a separate record. These data are collected from the root top of Engineering Building of WIT by PVMS250 unit. The PVMS250 unit is a dedicated photovoltaic measurement system. It incorporates a maximum power point tracker (MPPT) and current-voltage (IV) curve tracing capability, as well as two PT100 temperature sensor inputs. At the same time, I also make my online learning of basic theory and knowledge of Solar Insulation and Photovoltaic technologies in order to fix myself into this division. SIGNED: DATE: _____________________ Student _____________________ _____________________ Industry Supervisor _____________________ _____________________ WIT Placement Tutor _____________________
  • 71. Monthly Progress Report Week Beginning: 2nd March 2015 Week Ending: 27th March 2015 Start from this week, I have received the first task of my project that is to identify and resolve the errors of previous system of Solar Energy Monitoring. The Solar Energy Monitoring System is a system used to calculate and generate final result of solar energy, for instances: daily yield, daily irradiance, specific yield and performance ratio after gathering the MPP Data and Logfile Data. At the same time, I have to make revision on basic theory of Visual Basic myself again by online learning. As my main task of this project is to resolve the Solar Energy Monitoring System, I need to redesign a new interface of the system. It used me up to few hours to redesign so that to make the system more user-friendly and easy to use. This week onwards, I have started to interpreted and investigated the former code in order to fix into my new-design system. When the errors exist, I need to make some changes on the codes to keep the system running free of error even also improve the system. This process has to be done repeatedly as when an error exists at certain part of the code, it might not work well in the next coming codes. Therefore, every time I have to examine the codes and test debug run of the system after modifying the codes. Back to my programming project, I divided it into five parts. First part of system is to browse the monthly Logfile data of weather station data. Inside this text file consists of various kinds of solar monitoring data: date, time, temperature, wind speed, wind direction, humidity, solar radiation, solar energy and soon on in every minute which are important for data processing and documentation. At first, a „browse‟ button is created to show the Logfile onto the listbox of the system. The code is written to access the computer file system in order to search the Logfile in„txt‟ type. As there are many of Logfile where we place together into a folder, therefore a “For Loop” is used to repeat the searching and adding of Logfile onto the listbox. This part of system is
  • 72. considered as easier part compare with other parts of system due to its browsing and adding text file function from the computer. For the second part, the function is to load the selected Logfile by clicking „load‟ button and then to transfer it into the excel form of data grid view. Firstly, I have to clear the row and set 38 columns of data grid view. This is because the Logfile has 38 columns of different type of data. After that, a “For Loop” is needed to read the row of Logfile data. As we know, each row consists of collected various solar data per minute. It takes some time to read the data as monthly Logfile data consists of 43 thousand of rows to transfer into the data grid view. I tried to modify the codes in order to minimise the loading time of Logfile but at the last I maintain the coding as well because it showing more and more errors after edit the coding. On the last week of this month, I was on my way to complete the part 3 of the solar monitoring system. It is one of the complicated parts in overall system because it contains of calculation and formulae of certain data. Meanwhile, it also consists of many debug errors when I start to run the default system as the value of solar irradiation doesn‟t return to its value. During this week, I was spent my time in inspecting and analysing the way to solve these problem existed. SIGNED: DATE: _____________________ Student _____________________ _____________________ Industry Supervisor _____________________ _____________________ WIT Placement Tutor _____________________
  • 73. Monthly Progress Report Week Beginning: 3th April 2015 Week Ending: 24th April 2015 During this month, I was still continuing my last work of my project which is part 3 of the system. I found out that the coding had mixed together with part 4 of the system. For example, when the data for certain column is allocated in column 7, it is supposed no other data overlap again in that column as it causes the latest data might interchange with the oldest data. As a result, this effects to the accuracy of data and the final calculation of solar irradiation. After that, I have made some changes in the coding and keep testing for the debug run. Finally the values of hourly and daily solar irradiance return to its real value. The purpose of this part is to calculate the average temperature, hourly and daily solar irradiation per day based on the value of collected data (temperature and solar radiation) and solar formulae. Each of the data will printed on the second data grid view by daily. I have modified the coding that to accumulate all the total value of temperature and solar radiation per day, therefore divided by „sample‟ which is total 1440 minutes (24 hours x 60 minutes) to get the average value on that day. This step is keep repeated until the end of the month. The 4th part of system is to fill in the PV (photovoltaic) data by inserting the certain month of MPP Data which is in „csv‟ form of excel file. After inserting MPP Data, the system started to calculate hourly and daily PV output which is the power generated by photovoltaic. Moreover, it also compute the specific yield and performance ratio based on certain formulae. MPP data consists of Impp, Vmpp, Module Temperature 1&2 and Err. Impp and Vmpp are MPP current and MPP voltage that hold the current and voltage reading taken at specific time. Meanwhile, Module Temperature 1&2 are PT 100 temperature from sensor 1&2. Err is the current operating status of the unit. The time taken for MPP Data is from 4am to 10.59pm in minute every day, there is a total of 4 records of Impp, Vmpp, Module Temperature 1&2 and Err in a minute.
  • 74. In this part of system, I found that the certain „MPP Data no found‟ message box keep showing when the debugging time. After I figure out the problem it comes from the name of the inserting MPP Data. This is because the system won‟t run smoothly without the exact same name of the MPP Data file, as the MPP Data file is exact the same name just the date is different. Besides, the way of this part is almost same like part 3, if the inserting of MPP data is same month of Logfile data, then it should be run smoothly throughout the system. On the other side, a message box will appear and state that the error occurs. All the value calculated will be showed zero due to the correctness of MPP Data. In order to correct the data again, you have to insert the correct MPP Data again so let the system to get the correct data. For the 5th part is the last part of system, is to transfer and save all the processed data into excel form of data. The data saved in the form of excel will be exactly same as the data that showed in the data grid view of the system. This part of system does not face lots of problem as the coding run smoothly and data in excel file is exact the same with the system. SIGNED: DATE: _____________________ Student _____________________ _____________________ Industry Supervisor _____________________ _____________________ WIT Placement Tutor _____________________
  • 75. Monthly Progress Report Week Beginning: 27th April 2015 Week Ending: 5th June 2015 After done the coding of my project, I have to test the system whether it fully utilised or not. I have browse for the MPP and Logfile Data from 2014 and then print out the result in order to compare with the previous data. If the comparison of data is same, it mean that the system run smoothly. On the 1st week of May, I was accompanied by Yang Dong in order to collect the MPP and Logfile Data from WIT solar monitoring facility which is the root top of engineering building of WIT. The Solar Monitoring Facility at Waterford Institute of Technology is comprised of i) Weather Station - Davis Instrument Vantage Pro 2, with Solar Radiation and UV Sensors ii) PureWafer 235W Polycrystalline Silicon Solar Panel, inclined at 37 degrees to the horizontal iii) Egnitec PVMS250 PV Measurement System, for logging PV data The Davis Instrument Vantage Pro2 weather station series function as to measure barometric pressure, temperature, humidity, rainfall, wind speed and direction, UV/solar(with additional of Solar Radiation and UV Sensor) and soon on. It consists of 2 components: the Integrated Sensor Suite (ISS) which houses and manages the external sensor array; and the console which provides the user interface, data display, A/D conversion and calculations. The Integrated Sensor Suite (ISS) collects outside weather data and sends the data to a Vantage Pro2 console. Vantage Pro2 Weather Station console displays and records the station‟s weather data, provides graph and alarm functions, and interfaces to a computer using the optional WeatherLink® software. This instrument is actually where the output of Logfile data I used. The solar panel that our facility used to record the photovoltaic energy output is PureWafer 235W Polycrystalline Silicon Solar Panel. In order to get the maximum
  • 76. solar energy productivity, the solar panel we have inclined it at 37 degrees to the horizontal. PVMS250 will then collect the measurement of PV output and record into MPP Data file. The PVMS250 unit is a dedicated photovoltaic measurement system. It incorporates a maximum power point tracker (MPPT) and current-voltage (IV) curve tracing capability, as well as two PT100 temperature sensor inputs. Between regular IV traces the PV module under test can be maintained at specific operating conditions: maximum power point (MPP), open circuit or short circuit. The coming next day, I continue arrange all the MPP Data and Logfile Data into a folder in sort of month and year so that to let the user to get the data easily when using of this system. Afterwards, I begin to analyse and organise the MPP Data and Logfile Data by using the Solar Monitoring System. This is because I need to make a performance analysis for the year 2014 and year 2015. For the performance analysis, it contains of 12 months of data and I have to make a monthly summary on Solar Irradiance, System Yield, Specific Yield, and Performance Ratio for each month. i) Solar Irradiance- Total solar energy was available. ii) System Yield- Total of actual energy produced by the system. iii) Performance Ratio- Measure of the quality of a PV system iv) Specific Yield- Measure of energy produced per unit of installed capacity. At the same time, I also have to prepare graphical diagram in order to support the data and provide a visual presentation of the data above. Therefore, an annual summary can be completed by doing this. Graphs and Data (including on Monthly Summary sheet) will have been updated and can be copied into the website as required. SIGNED: DATE: _____________________ Student _____________________ _____________________ Industry Supervisor _____________________ _____________________ WIT Placement Tutor _____________________
  • 78. Work Placement CV – BEng (Hons) in Electronic Engineering (WD086) http://www.wit.ie/wd086 Name: Lee Siang Wei Date of Birth: 24 April 1993 E-mail: jacklee_lsw@hotmail.com Tel: +353 831673290 Nationality: Malaysian Address: Apartment 21C, Block 9, Riverwalk Accommodation, Inner Ring Road, Waterford. EDUCATION Third Level College: Waterford Institute of Technology Date: Sept 2014-May 2016 Course: BEng (Hons) in Electronic Engineering Subjects included: Year 3: Analogue Control, Advanced Engineering Maths, Data Structures & Algorithms, Semiconductor Fundamentals, Electromagnetic Fields & Waves, Telecommunications 3 College: Tunku Abdul Rahman University College, Malaysia Date: May 2011-Sept 2013 Course: Diploma in Technology (Electronic Engineering) CGPA: 3.4123 (Graduated with Merit) Subjects included: Year 2: Mathematics IV, V & VI, Electronic Instrumentation & Communications, Electrical Technology & Circuits, Microprocessors, Engineering Mechanics, Embedded Systems, Design & Application, C++ Programming, Industrial Control & Automation. Year 1: Mathematics I, II & III, Engineering Science I&II, Basic Electronics, Principles of Electrical & Electronics Engineering, Digital Electronics, Analogue Electronics, Engineering Drawing and CADD, English Language. Mini Project: Password Door Lock System It was a system that using theory of electromagnet to lock the door (based microcontroller). The user needs to enter a correct password to access it. Second Level School: SMJK Chio Min, Kulim, Kedah, Malaysia Date: Jan 2006-Oct 2010 Leaving Certificate: SPM with 7A & 3B including Chemistry, Physics, Biology, Mathematics, Chinese and English 1119 (GCE-O) 3B WORK EXPERIENCE Name: UWC Electric (M) Sdn. Bhd, Simpang Ampat, Penang, Malaysia Date: Jan 2013-April 2013 Role or Position: Internship Technical Assistant Responsibilities / Duties:  Visual and functional checked for products.  Maintained, analysed, and repaired faulty circuit board and equipment.  Evaluated and verified products. Skills gained:  Great time management skills; prioritize main task as well.  Developed problem-solving and technical skills.  Experience the important of teamwork and interpersonal skills. Name: Tua Pui Hiang Restaurant, Kulim, Kedah, Malaysia Date: Sept 2013-Aug 2014 Role or Position: Waiter Responsibilities / Duties:  Presented food menus to patrons.  Provided guests with good services and information.  Delivered food and beverage orders to kitchen staff.
  • 79. Work Placement CV – BEng (Hons) in Electronic Engineering (WD086) http://www.wit.ie/wd086  Ensured order delivery to the table in a timely manner.  Clean up dishes and glasses from the table.  Fulfilled customer’s requirement when they requested. Skills gained:  Good customer service; friendly and kindness to serve guest.  Effective communication skills with guests and staff.  Great attention to details.  High degree of personal cleanliness  Understanding and dealing with stressful situations. Name: UYang Smartkids Learning Centre, Bukit Mertajam, Penang, Malaysia Date: Jan 2011-Aug 2014 Role or Position: Taekwon-Do Instructor Responsibilities/ Duties:  Conducted lesson of Traditional Taekwon-Do.  Monitored and observed students, and provided feedback for students on their progress.  Managed students to grading examination, competition and reality self-defence.  Instructed Traditional Taekwon-Do’s spirit and martial virtue to students.  Inspected mental and ethical discipline of each student. Skills gained:  Knowledge and ability in martial arts discipline.  Self-confidence; speak and demonstrate in front of an audience.  Perseverance and patience; teach students of vastly differing physical ability.  Good organisational skills; responsible in running own business.  Enthusiasm toward martial arts; inspire confidence and motivate students.  Admirable fitness; initiative to exercise regularly in both aerobic and anaerobic exercise. Computer Skills:  Windows 7 Operating System  C++ Programming, Visual Basic, Microsoft Word, Excel & Powerpoint, Internet Language Skills:  Fluent in Mandarin, Malay, & English Interests and Achievements Taekwon-Do Football  Awarded Black Belt 1st Degree of Malaysian Global Taekwon-Do Federation.  President of Taekwon-Do Society in secondary school (2009-2010).  Organised “Will Taekwon-Do” Tournament 2011.  Won bronze medal of Penang State Tournament last year (open category).  Led members and students to tournament and demonstration.  Attended training class frequently.  Member of secondary school football club.  Won Champion of football team 2010 of school competition.  Awarded Man of the Competition 2010.  Enjoyed football and futsal during leisure time with teammates. REFEREES O Hanlon, Fergal Lecturer in BEng Electronic Studies Waterford Institute of Technology Tel: +353 5130 2647 Email: FOHANLON@wit.ie
  • 80. Appendix IV Product Details and Specification
  • 81. Measurement Technology for Photovoltaics Software Version: 1.11 Photovoltaic Measurement System PVMS Datalogger User Manual August 2012
  • 82. © 2012, Egnitec 5 5.3 PVMS Measurement Units This section displays details of any PVMS monitoring units which have been loaded. Each PVMS unit loaded into the datalogger will be displayed in a line on the grid, allowing its current operat- ing status and mode to be observed, as well as the last power measurement and its timestamp. New Unit A dialog box will be displayed which will allow the user to select from a number of avail- able COM ports. Once selected the program will attempt to connect to the PVMS unit and will load and display details of this unit in the PVMS Unit Details dialog box. Load Unit This allows details of a PVMS unit to be loaded into the datalogger. Save Unit This allows details of a PVMS unit to be saved. Remove Unit This allows the selected unit to be removed from the datalogger. Unit Details This will load a dialog box which displays details about the PVMS unit. The user is able to change some of the unit’s parameters, including Unit Name (MAX 8 characters) and the number of points in the IV curve. If either Unit Name or IV Curve Points are changed on the dialog box then the user will be given the option of updating these values on the unit’s EEPROM when the dialog box is closed. Otherwise these changes will not be saved. If the EEPROM is updated, check that the update was successful by clicking on “Unit Details” again. The details of the Module under test and the load resistance are also entered on this dia- log box. These details are stored in the PVMS unit file on the PC. If any changes are made these must be saved manually (click on “Save Unit” after this dialog box has closed). Autoload Units This allows the user to select a folder and load all of the PVMS units which have been stored there (file extension *.pvu). 6. Driver Installation. The RS422-USB interface cable is based on the FTDI USB-Serial chipset and suitable drivers must be in- stalled. Please refer to www.ftdichip.com for further details.  Connect each USB-RS422 cable into the PC. The cable does not have to be connected to the PVMS unit for the drivers to be installed.  On Windows Vista and Windows 7 the drivers software will be automatically downloaded and installed.  On older versions of Windows the drivers will need to be installed manually. You will be prompted to install the FTDI driv- ers if they have not already been in- stalled. The drivers can be downloaded from http://www.ftdichip.com/Drivers/ VCP.htm.  Two drivers will be installed for each unit: a USB Serial Port (COMxx) and a USB Serial Converter.  Each cable will be assigned a unique COM port number (e.g. “COM31”).The next time the cable is plugged in it will be recognised and assigned the same COM port number.  To check that installation was successful or if there are any problems it is possible to view the device in Device Manager (under Control Panel).  Under Ports (COM & LPT) there will be a USB Serial Port with a COM port number assigned to it for each cable that is con- nected to the PC (by default unconnected devices are not shown). 7. Datalogger Output Files The measurement data is output from the datalogger and goes into a set of four files per PVMS Unit: Logfile: this file stores extra information for each unit. <Campaign>_<Unit Name>_LogFile_<yyyy_mm_dd>.txt (e.g. England_UK0010_logFile_2012_05_31.txt) MPP Data: this file holds each set of MPP measure- ments (current, voltage, 2x module temperatures) as well as an indicator of system operating status. <Campaign>_<Unit Name>_MPPData_<yyyy_mm_dd>.csv (e.g. England_UK0010_MPPData_2012_05_31.txt) IV Main: this file holds one record for each IV curve. <Campaign>_<Unit Name>_IVMain_<yyyy_mm_dd>.csv (e.g. England_UK0010_IVMain_2012_05_31.txt) Datalogger Settings, Driver Installation & Datalogger Output Files
  • 83. © 2012, Egnitec6 Datalogger Output Files IV Data: this file holds each of the current-voltage points on the curve as a separate record. <Campaign>_<Unit Name>_IVData_<yyyy_mm_dd>.csv (e.g. England_UK0010_IVData_2012_05_31.txt) The CSV files can be opened in Excel or a text editor or can be loaded into tables in a database (e.g. MySQL). If the Daily File option is selected on the datalogger the files will be created with the filenames as shown above and a new set of files will be created each and every day. If Daily File is not selected the data will be logged into the same set of files. In this instance the filenames will not include the date (e.g. “England_UK0010_IVMain.csv”). 7.1 CSV Header Records The CSV files each have a set of header records which hold important information regarding the source of the files:  Campaign: the datalogging campaign name.  Location: the datalogging location name.  User: the Windows username from the PC.  ObservationType: identifies which type of measurement the file contains (either “MPPT” or “I-V Curve”).  ObservationName: identifies the data held in that column.  ObjectModel: holds the Module Model Number (from PVMS Unit Details form).  ObjectSerialNo: holds the Module Serial Num- ber (from PVMS Unit Details form)  SensorModel: always “built-in transducer”  SensorSerialNo: always “N/A”  DataAcquisitionHardwareModel: the model number of the PVMS measurement unit (e.g. PVMS_250/80/12).  DataAcquisitionHardwareChannel: always “1”  DataAcquisitionHardwareSerial: the serial number of the PVMS unit (e.g. “006/0010”) 7.2 CSV Data Records After the header records there will be the data. Date & Timestamp: The first column of every data record is always a date & timestamp (dd-mm-yyyy hh:mm:ss format). The rest of the columns differ depending on the file: MPP Data:  Impp: Current measurement (see note *).  Vmpp: Voltage measurement (see note *).  Module_temperature1: PT100 temperature from sensor 1 (see note **).  Module_temperature2: PT100 temperature from sensor 2 (see note **).  Err: the current operating status of the unit is reported as a number: -  0 MPPT Locked  1 MPPT Scan  2 No PV/Low Light (see note ***)  3 Open Circuit  4 Initialising  5 Remote Shutdown  6 IV Trace Internal  7 IV Trace External  8 Overvoltage Fault  9 Calibration  10 Short Circuit Anything apart from 0, 2, 3 or 10 indicates that the unit is not working as expected and the val- ues should be treated as unreliable. IV Main: Each IV curve has a single record in this file.  Impp: MPP current (taken from curve)  Vmpp: MPP voltage (taken from curve)  Isc: short circuit current  Voc: open circuit voltage  Module_temperature1 (see note **)  Module_temperature2 (see note **)  IV_Sweep_EndTime: indicates when the IV curve sweep finished.  No_of_Points: the number of points that were measured for this particular curve. IV Data: Each IV curve consists of a number of records with the same date & timestamp (matching the date & timestamp in the IV Main file).  SweepPoint: the Point No (starting at 0)  I: current value  V: voltage value Notes: * Impp and Vmpp in the MPP Data file will hold the current and voltage reading taken at that specific time. The analysis of these needs to take into account the operating status of the unit indicated by Err. This will indicate which operating mode the unit is work- ing in or if any error condition exists. ** A value of –99 indicates that no PT100 sensor is present on that channel. *** The unit has determined that the light levels are very low or that no PV panel is connected.
  • 85. Student Industrial Placement Guide – WIT BEng (Hons) Electronic Engineering – 2014/15 20 BEng (Hons) Electronic Engineering - WIT Industry Supervisor’s Report Student Company Supervisor Location Supervisor’s Assessment of the Student Maximum Score Actual Score Technical Competence 10 Ability to Communicate 10 Enthusiasm 10 TOTAL 30 General Comments about the Student and the Placement Programme Signed: _______________________ Date:________________
  • 86. Appendix VI WIT Placement Tutor’s report of Placement Visit
  • 87. Student Industrial Placement Guide – WIT BEng (Hons) Electronic Engineering – 2014/15 17 BEng (Honours) Electronic Engineering - WIT INDUSTRIAL PLACEMENT VISIT WIT Placement Tutor’s Report (Page 1 of 2) Student Company Date of Visit Location 1. General Review of the organisation (Note: This normally involves a tour of the works on the site and/or office and the student should demonstrate his /her knowledge of the work in progress) 2. Review of Documentation Status Comments Monthly Reports Placement Diary Photos/Acetates 3. Difficulties with Placement? (Note: This may include discussion of salary, working hours/conditions, accommodation, health, relationship with Industrial Supervisor/co-workers, type/range of duties, etc.)
  • 88. Student Industrial Placement Guide – WIT BEng (Hons) Electronic Engineering – 2014/15 18 BEng (Hons) Electronic Engineering - WIT INDUSTRIAL PLACEMENT VISIT WIT Placement Tutor’s Report (Page 2 of 2) 4. Academic Review (a) Semester 5 Results (b) Final Project – Review of Addendum Reports to date and actions proposed 5. Industrial Supervisor’s (initial) Appraisal of Student (Note: The College Supervisor should meet with the Industrial Supervisor to discuss the student’s performance and the WIT placement programme in general) Name of Industrial Supervisor: Position/Job Title: 6. Assessment of Student during Placement Visit Maximum Score Actual Score Attitude/Enthusiasm 15 Technical Competence 15 Communication Ability 10 TOTAL 40 Signed: __________________________