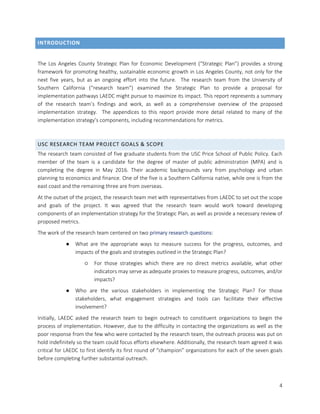
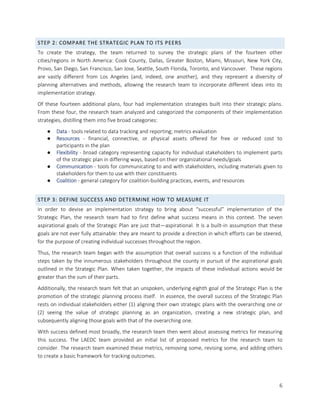
The document provides a recommendation for implementing the LA County Strategic Plan for Economic Development from 2016-2020. It proposes that LAEDC create two new committees focused on liveability and innovation, in addition to leveraging existing committees. It also recommends forming a steering committee of executive leaders to coordinate efforts. LAEDC should serve as a facilitator, assisting committees and preventing duplicative work. Metrics were also reviewed and over 90 were identified to measure progress across the seven goals of the strategic plan. The report details tools to engage stakeholders and keep them involved in the implementation process.


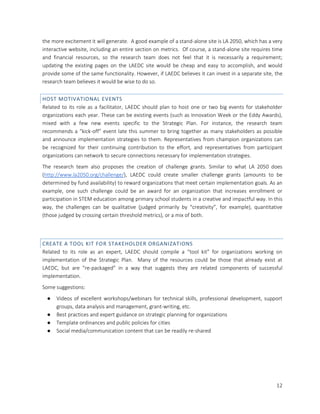


![INDICATOR UNIT OF MEASURE DATA SOURCE COST OF
ACCESS
BASELINE BASELINE
YEAR
1 Child development
and education
programs
Percentage of children under age 5
enrolled in early child development
and education programs
LA2050 -- 21% 2013
1 Child development
and education
programs
Number of the Early Childhood
Education (ECE) programs offered
-- -- -- --
1 Youth
unemployment
rate
Percentage unemployment rate for
youth ages 16-19
CA Employment
Development
Department
Public/free 20% 2016
1 Access to high-
speed Wi-Fi
Number of public institutions with
free wi-fi (e.g., public schools,
libraries)
-- -- -- --
1 STEM enrollment
and participation
trend
Total enrollment and participation
trend (number of students and
percentage)
School districts Need to
collect
-- --
1 Afterschool
programs
Trend of funding available, students
enrolled
-- Need to
collect
-- --
1 Graduation rates Percentage graduated CA Department of
Education
Public/free 80.80% 2014
1 HS dropout rate &
disparity
Percentage dropout and disparity
among key population segments
CA Department of
Education
Public/free 3.30% 2014
1 High School
student
proficiency in
English/ Language
Arts and Math [HS
exit exams]
percentage CA Department of
Education
Public/free 84% 2014
1 High school
student
proficiency in
Science/
Technology/
Engineering [HS
exit exams]
percentage CA Department of
Education
Public/free 84% 2014
1 Success of English
Learners
English Learners who complete high
school with English proficiency
CA Department of
Education
Public/free 65.30% 2014
1 Retention rates
(and demographic
specs) from local
higher education
institutions
percentage -- -- -- --
1 Advanced
Placement (AP)
enrollment in
schools within
severely
economically
distressed census
tracts
Trend in number of students
enrolled in AP classes (number of
students and percentage)
School districts in target
tracts
Need to
collect
-- 2014
1 Education
attainment levels
Percentage with High School, Some
College, Bachelors, etc.
ACS/Social Explorer Public/free -- 2014
1 Percentage of
children who feel
safe at school
most or all of the
time
percentage CA Department of
Education
Public/free 81% --
2 Key legislations,
regulations and
policies
Number of key bills, regulations,
executive orders, judicial decisions
affecting key LA County industry
clusters
LAEDC -- 20 2016
2 Employment
growth (jobs)
Percentage of new jobs in total jobs
per industry cluster
BLS Public/free -- 2015
2 Employment
growth (income)
Average income change in dollars in
each industry cluster per year
BLS Public/free -- 2015
GOAL /
GUIDING QUESTION
Invest in our people to provide
greater opportunity
How are we allocating public
resources for education - students
/ adults?
Strengthen our leading export-
oriented industry clusters
How can the County support
leading industry clusters that
create well-paying jobs?
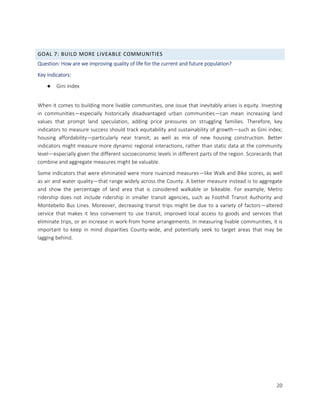
APPENDIX A: FULL LIST OF METRICS](https://image.slidesharecdn.com/24131ef7-742b-4688-9d6a-f4ed68263b60-160511210119/85/Final-Report-with-Appendices-26-320.jpg)
![INDICATOR UNIT OF MEASURE DATA SOURCE COST OF
ACCESS
BASELINE BASELINE
YEAR
GOAL /
GUIDING QUESTION
2 Industry cluster
Location Quotient
LQ per industry cluster BLS Public/free -- 2015
2 Networking Number of major industry-specific
conferences held in LA County
-- Need to
collect
-- --
2 Net business
migration
Percentage change in number of
establishments per industry cluster
-- -- -- --
2 Scale of expansion Number of establishments within
each industry cluster
Census Statistics of U.S.
Businesses
-- -- 2012
2 Strategy for
alignment
(qualitative)
COGs have strategic plans
identifying complementary
strengths? Yes/No
-- Need to
collect
-- --
2 Marketing and
brand strategy
Does industry have trade
organization? Yes/No
-- Need to
collect
-- --
3 Venture Capital
Investment
Annual venture capital investment
into LA County firms
PWC Public/free $797.7 billion 2014
3 R&D Investment Federal funding dollars for
university research invested into the
region
National Science
Foundation
Public/free
3 R&D Investment University expenditures on R&D -- Need to
collect
-- --
3 Real Estate
Development for
Industry research
Square feet of publicly-owned real
estate identified for applied
research in key industries (available
and in pipeline)
-- Need to
collect
-- --
3 Innovation Event Number of LA Innovation Week
events and attendance
LAEDC -- -- --
3 Targeted brand
strategy for LA
County as the
place for
innovation and
entrepreneurship
Yes/No -- Need to
collect
-- --
3 Entrepreneurship
support/growth
Total number of incubators &
accelerators
SoCal Tech Need to
organize
available
information
-- --
3 Entrepreneurship
support/growth
Number of new firms established in
LA County per industry cluster
Census County Business
Patterns
Public/free -- --
3 Entrepreneurship
support/growth
Number of new firms/start-ups
established in business incubators
or accelerators
Private
incubator/accelerator
Need to
collect
-- --
3 Entrepreneurship
support/growth
Total number employees and/or
gross revenues by firm age
Census Business
Dynamics Statistics
Public/free -- 2013
4 Economic
Development
Planning
Number of Cities with an Economic
Development element in their
General Plan
Cities Need to
collect
-- --
4 Economic
Development
Planning
Number of cities with business early
warning/problem identification
systems
Cities Need to
collect
-- --
4 Economic
Development
Planning
Countywide coordination to reduce
regional competition (Yes/No)
Cities Need to
collect
-- --
4 Business Programs Number of businesses directly
assisted per year by City or County
Cities Need to
collect
-- --
4 Business Programs Number of cities with annually
funded economic
development/business assistance
programs
Cities Need to
collect
-- --
4 Cost of doing
business
Number of cities with a Kosmont-
Rose Cost of Doing Business Rating
of (and improved scores over
previous year): [$, $$, $$$, $$$$]
Rose Institute of State
and Local Government
Public/free -- --
4 Business License
Processing
Total new Business Licenses
(excluding retail and food service)
processed per year
Cities Need to
collect
-- --
Strengthen our leading export-
oriented industry clusters
How can the County support
leading industry clusters that
create well-paying jobs?
Accelerate innovation and
entrepreneurship
How are we investing resources
to cultivate a more
entrepreneurial, industiral
culture?
Be more business-friendly
How to we enhance existing
structures to facilitate a more
competitive business
environment?](https://image.slidesharecdn.com/24131ef7-742b-4688-9d6a-f4ed68263b60-160511210119/85/Final-Report-with-Appendices-27-320.jpg)