Download as PDF, PPTX
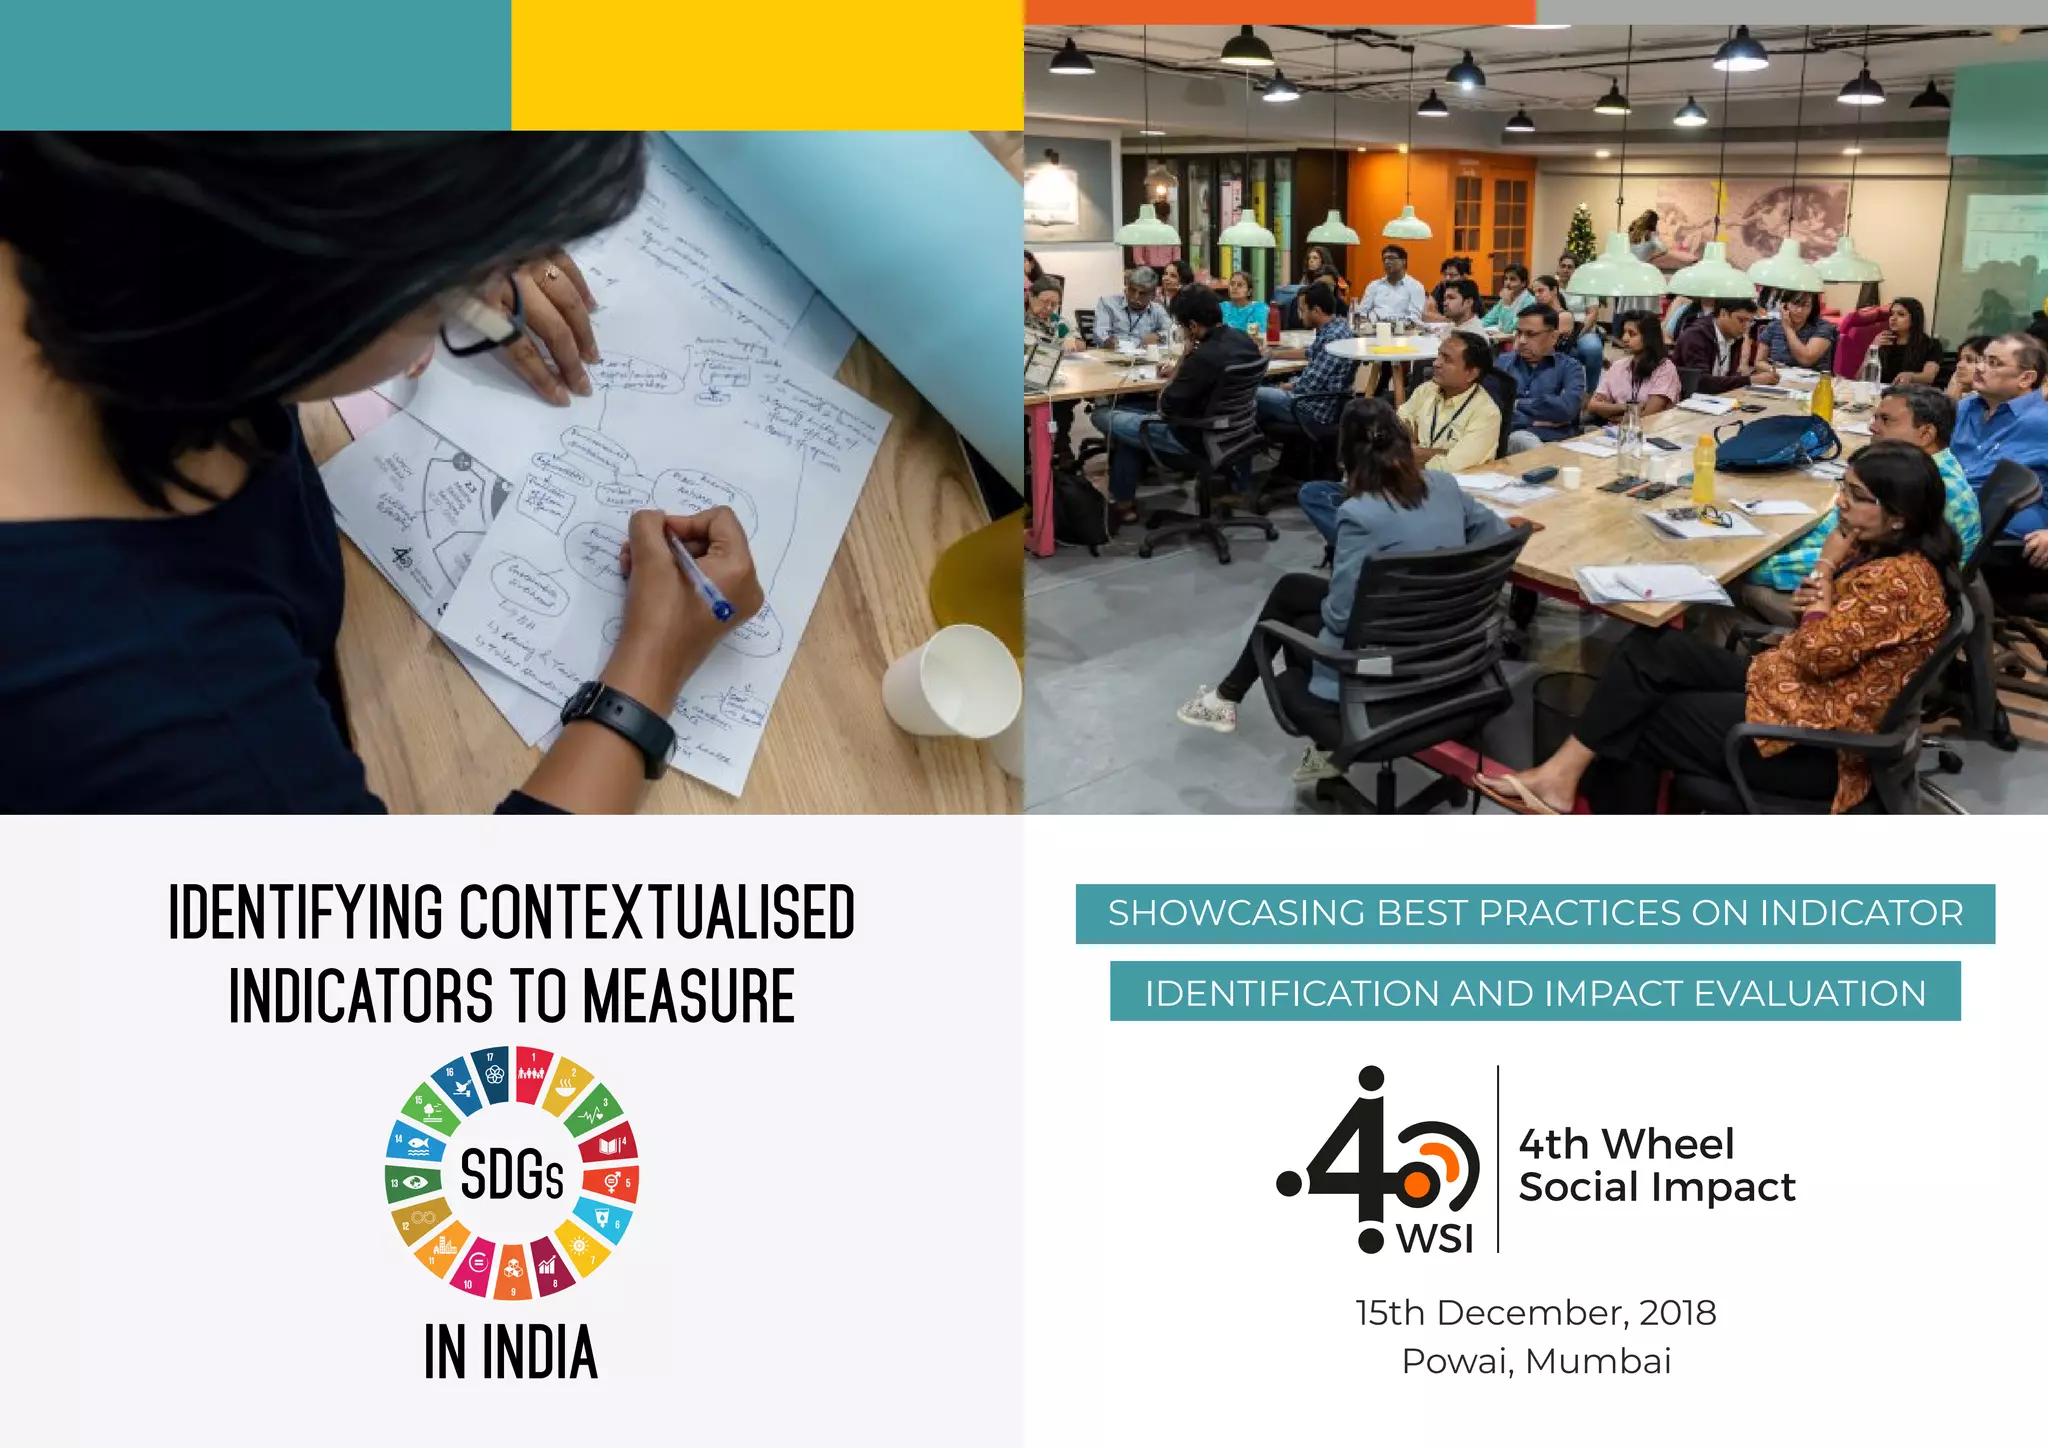
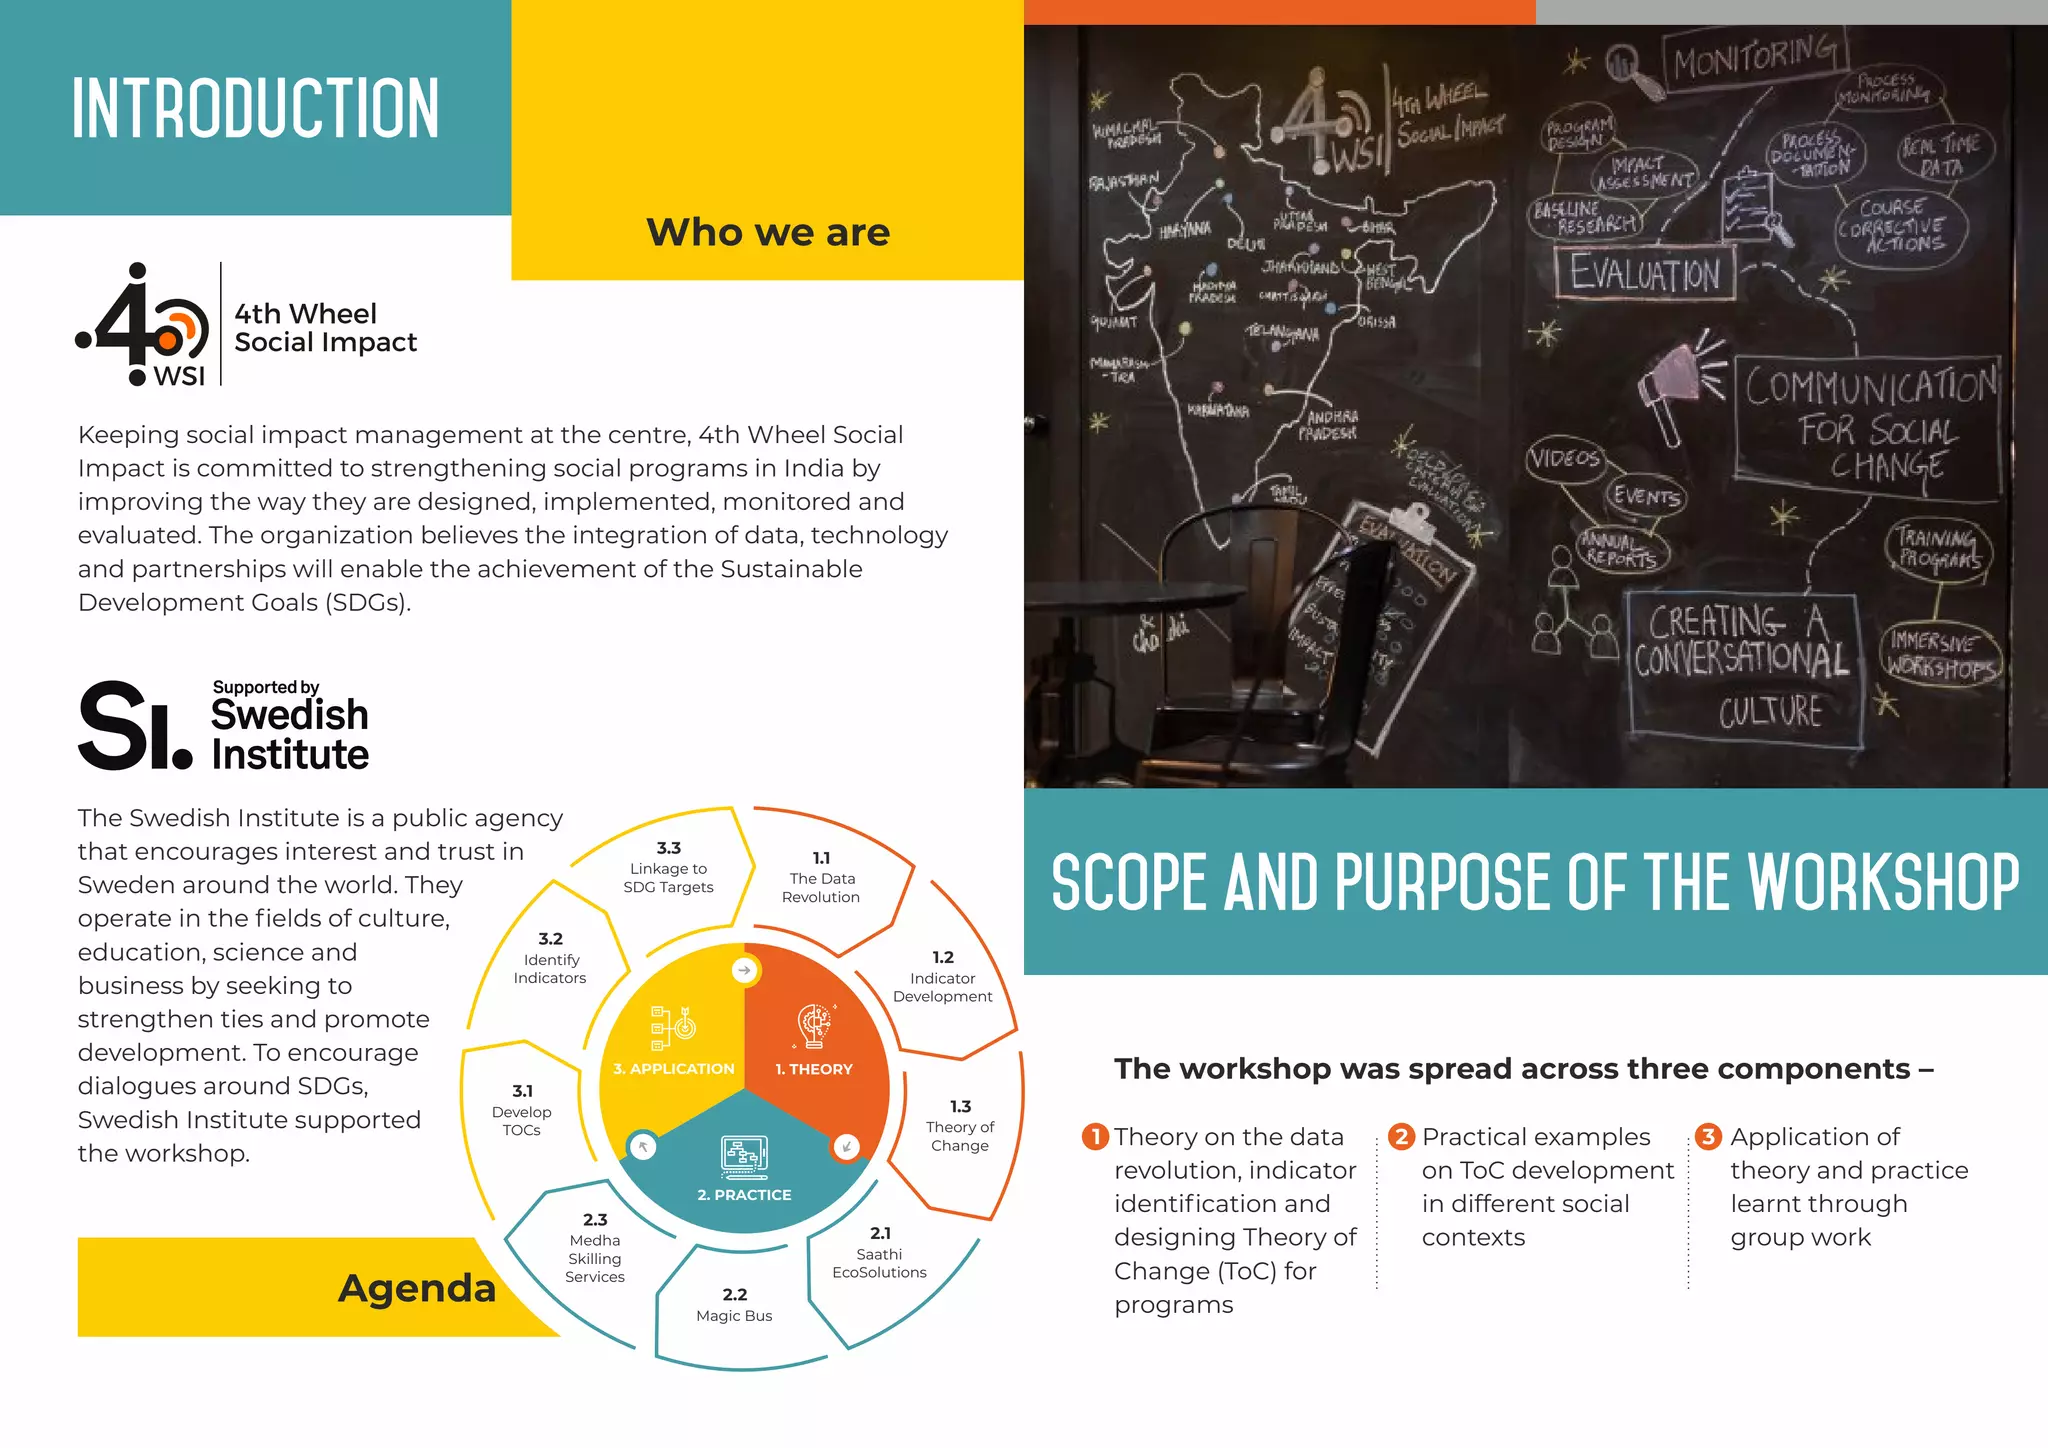
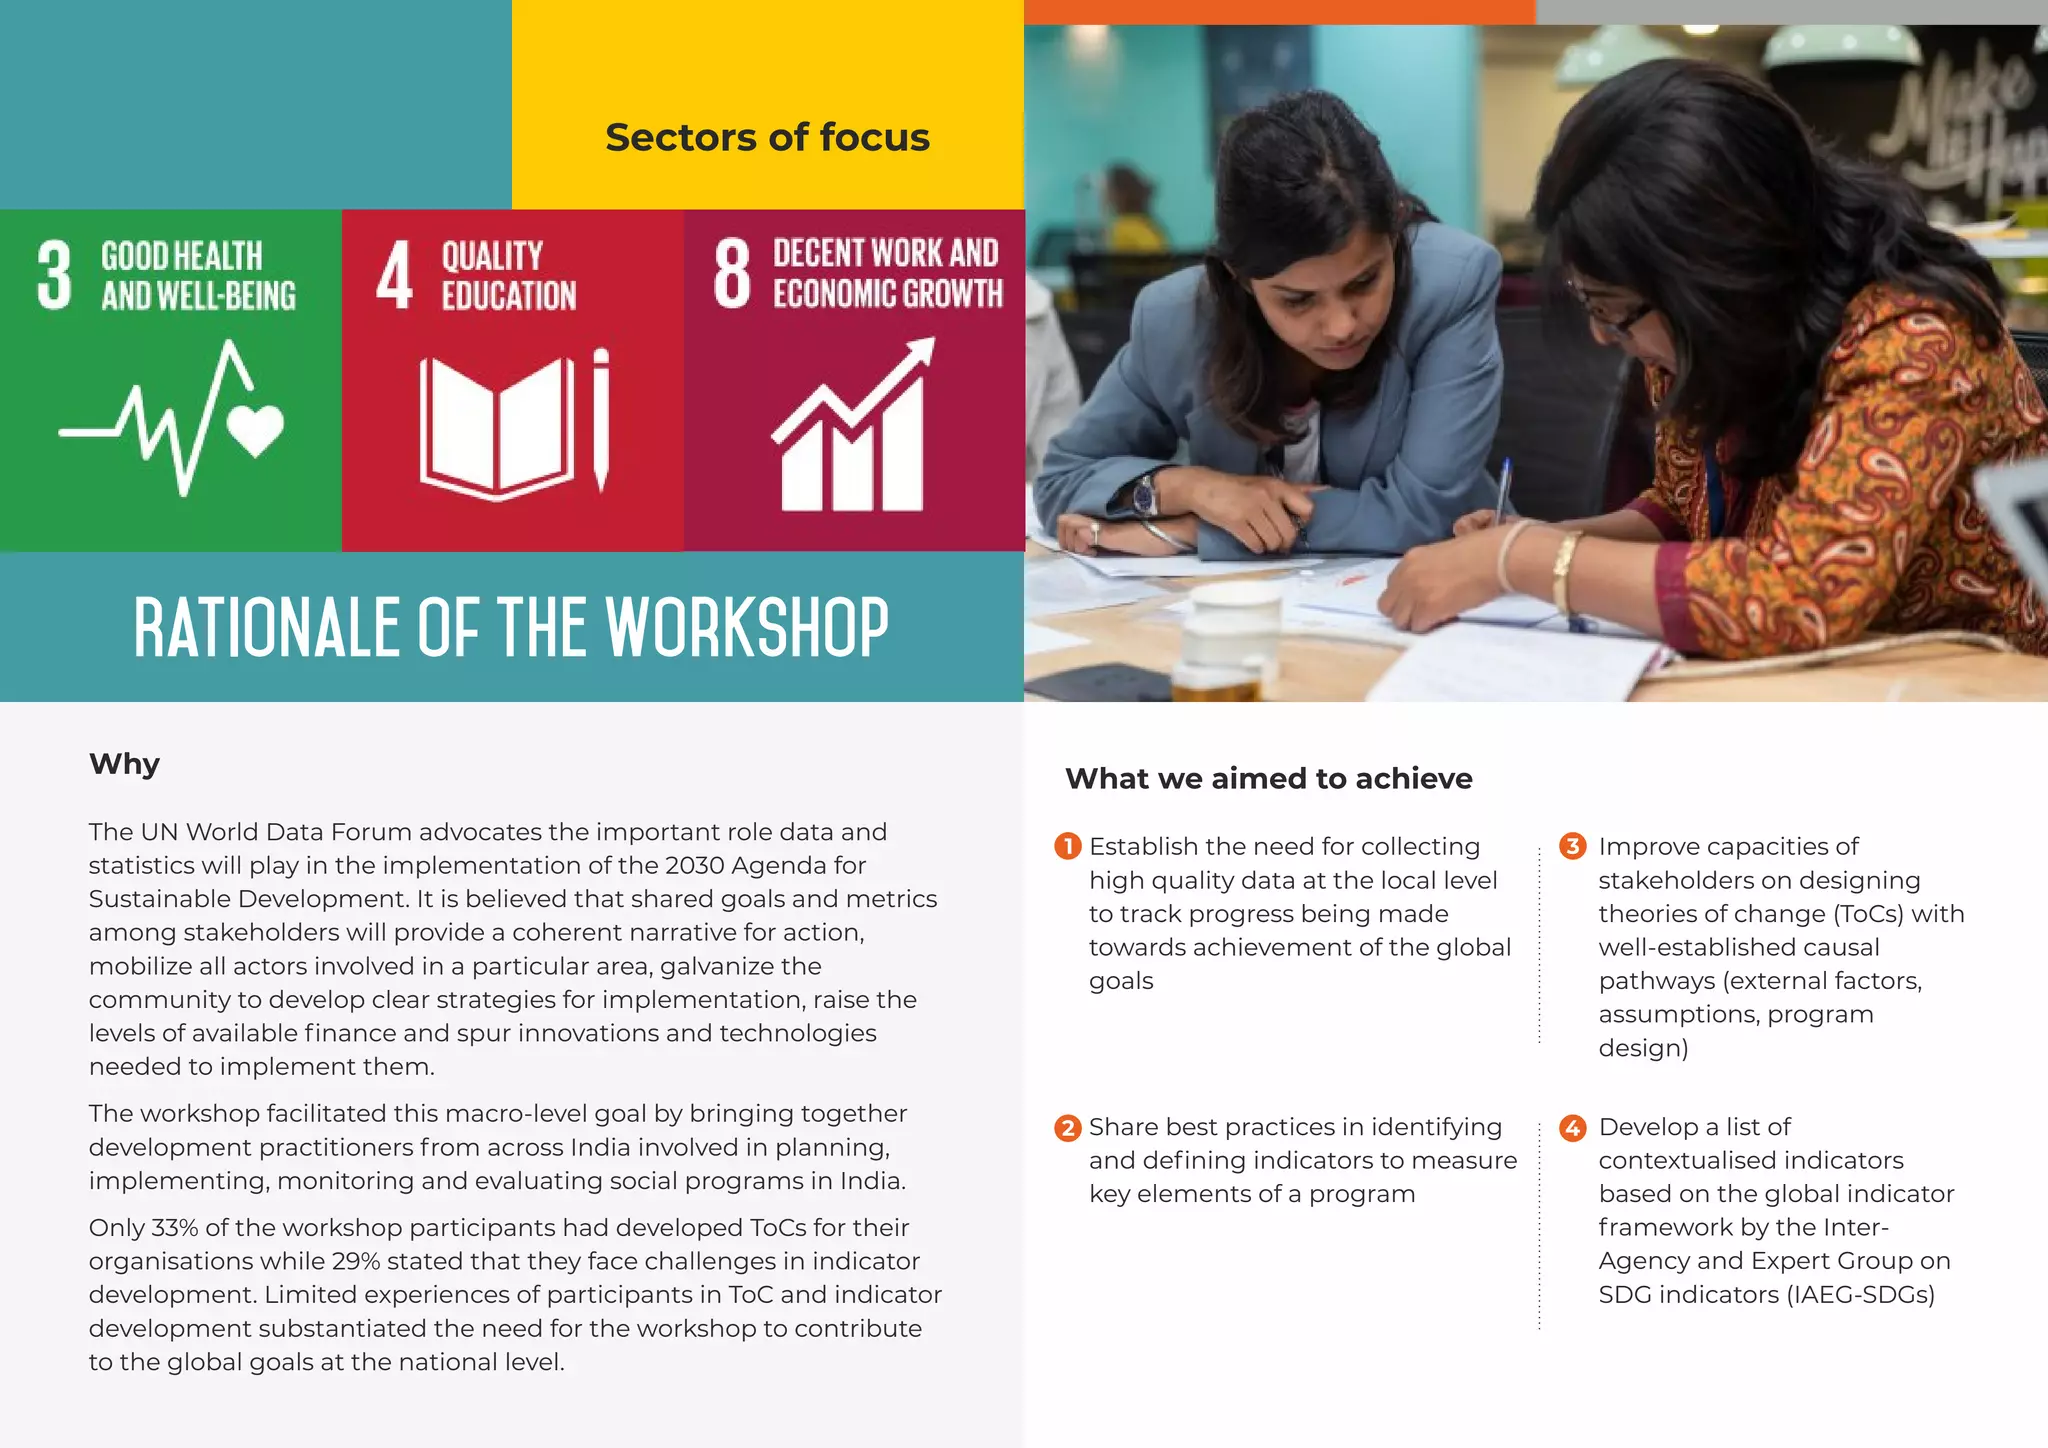
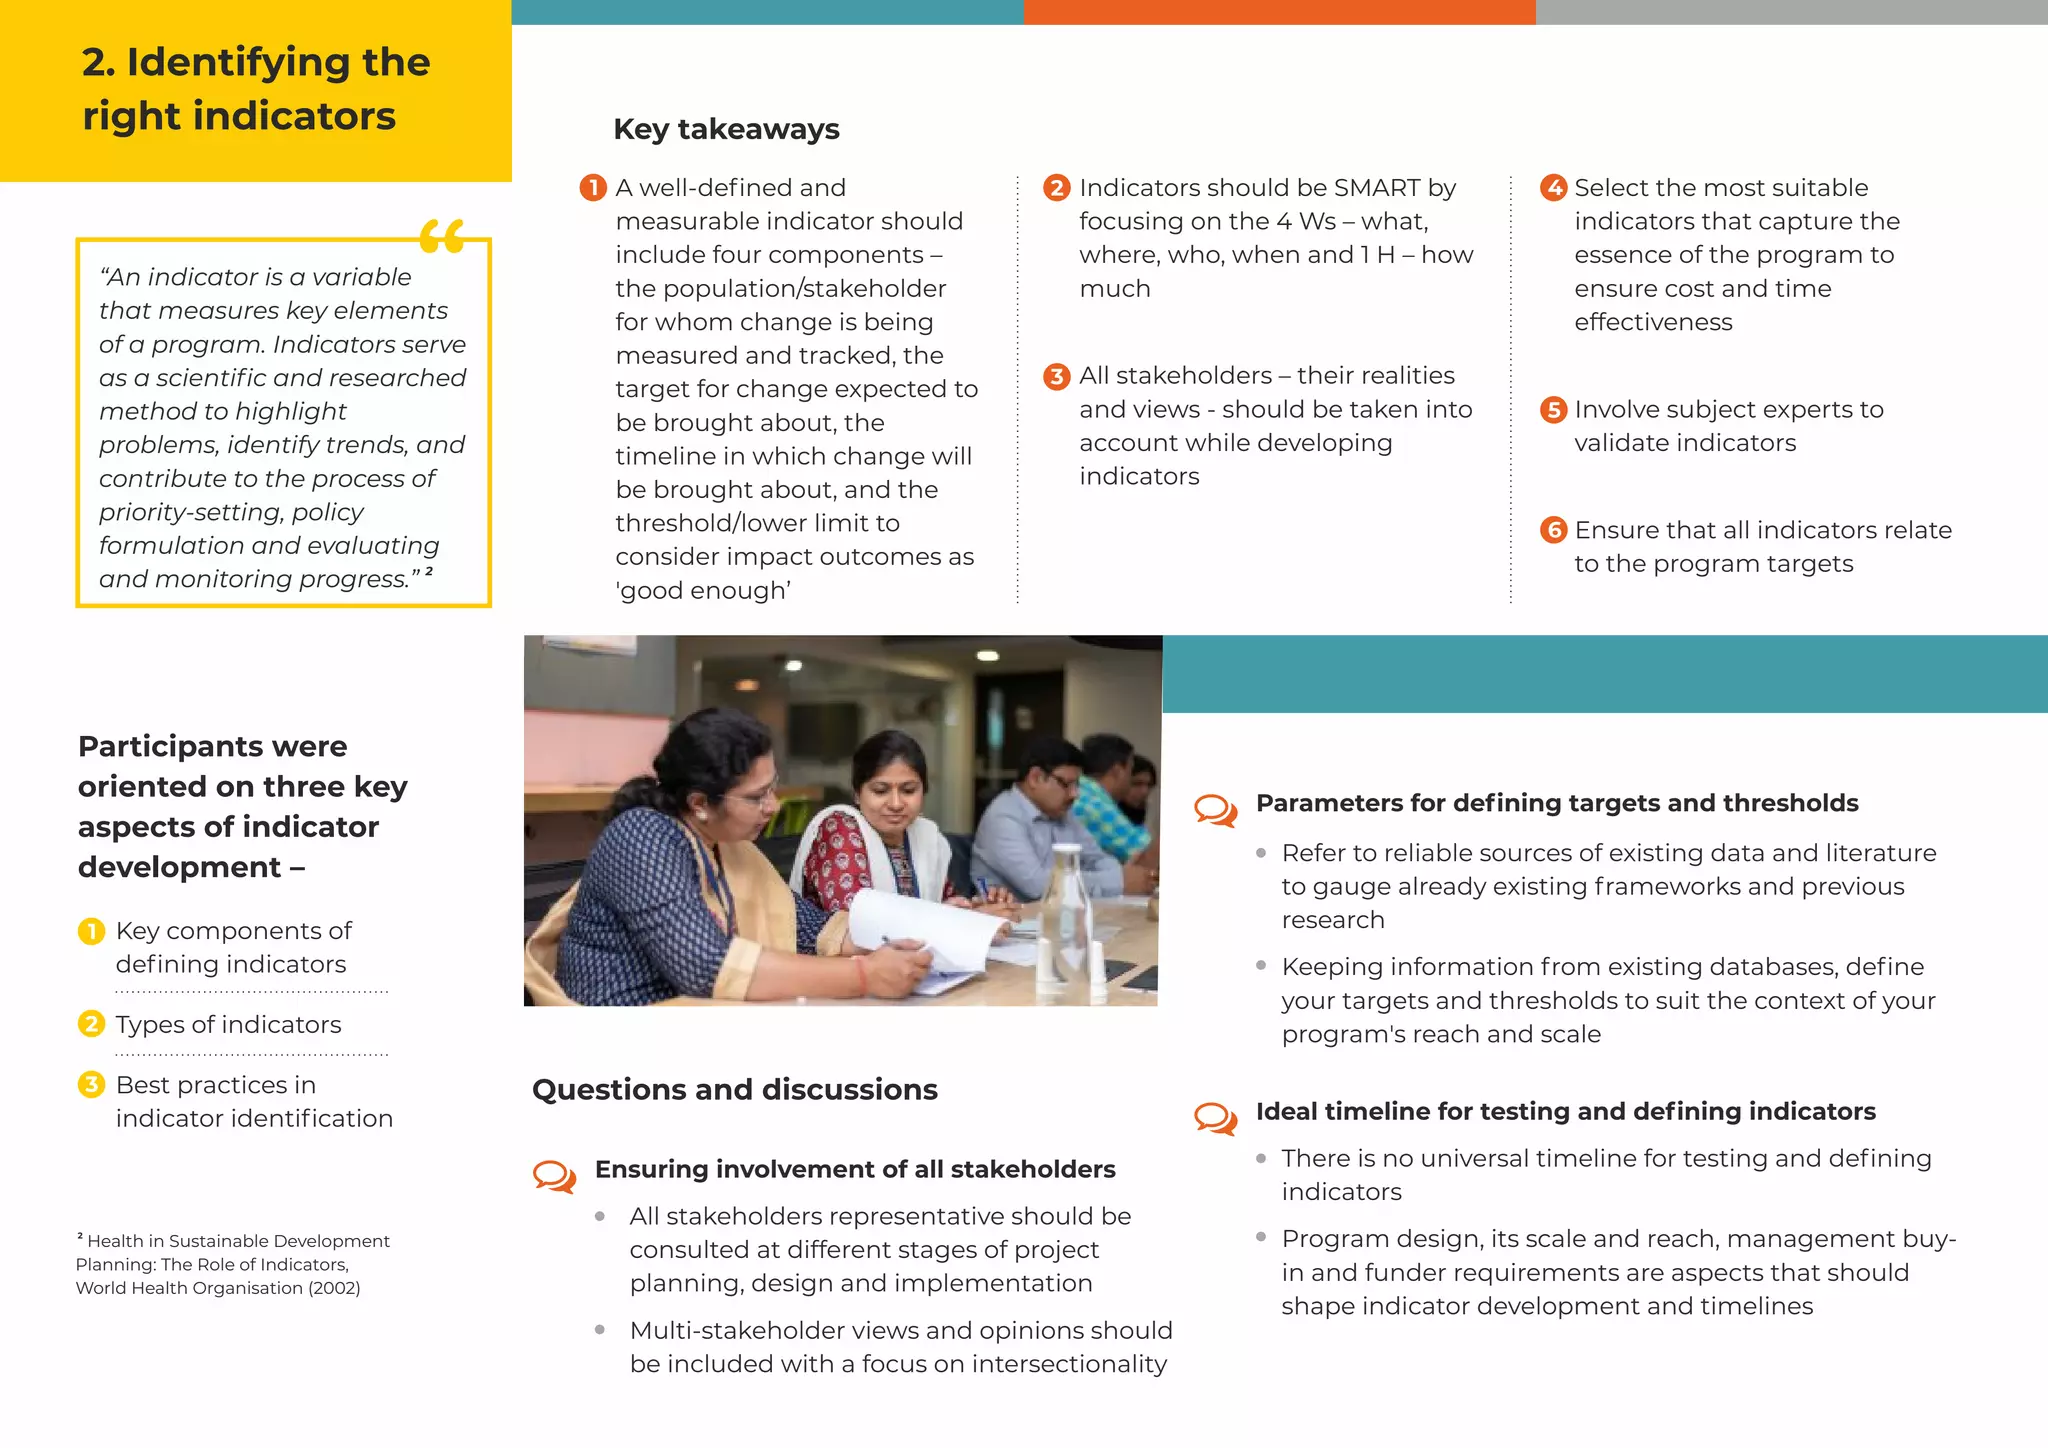
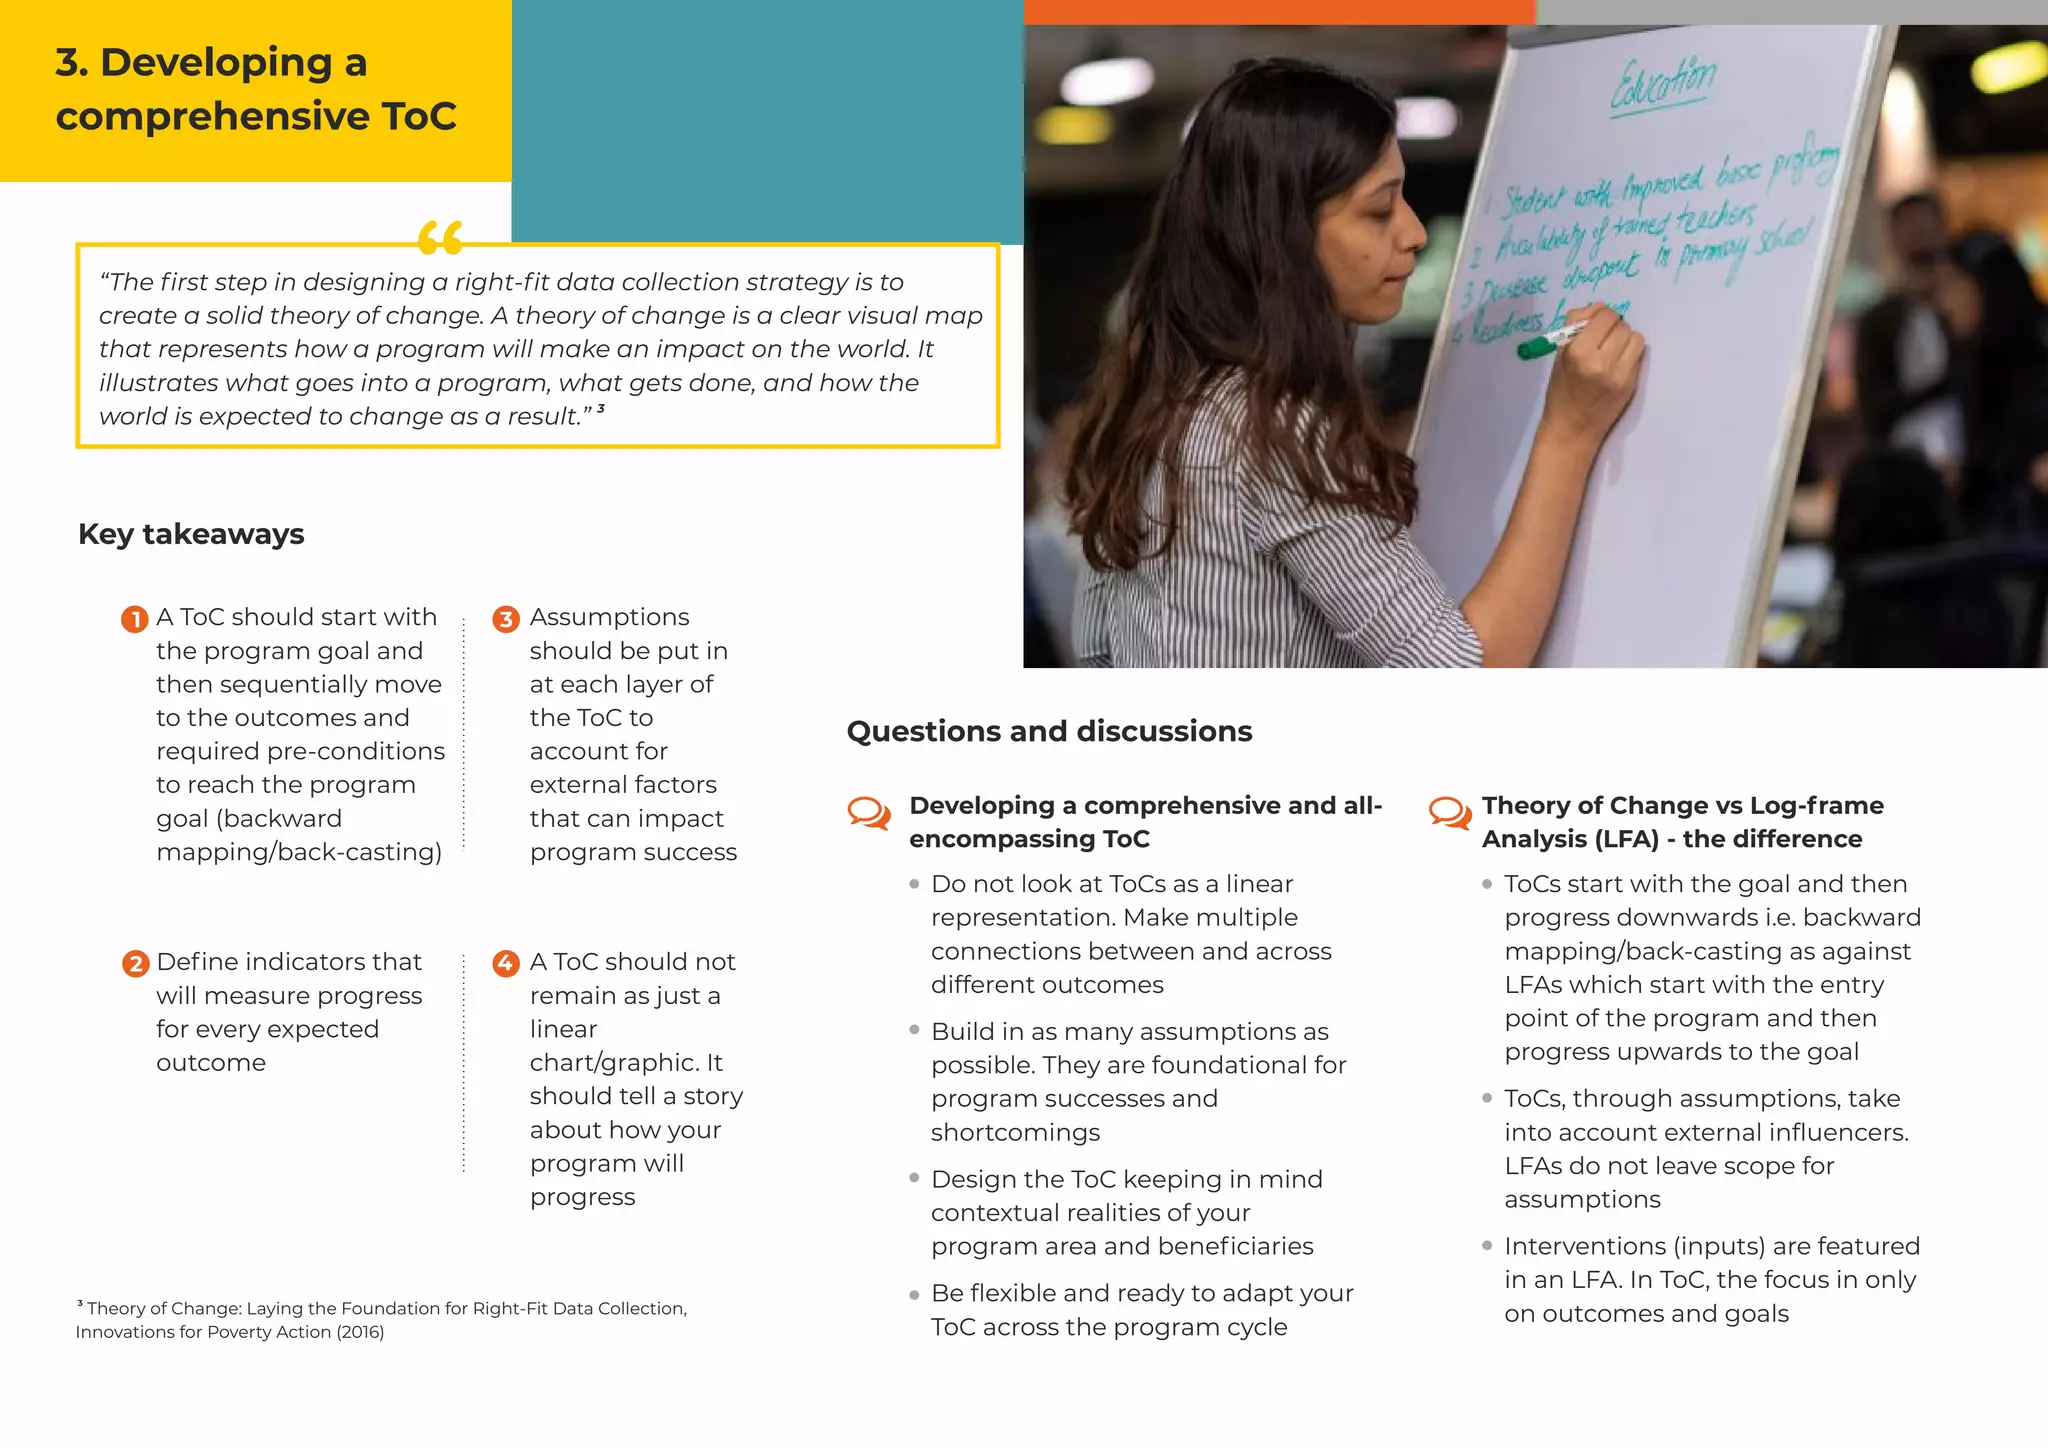
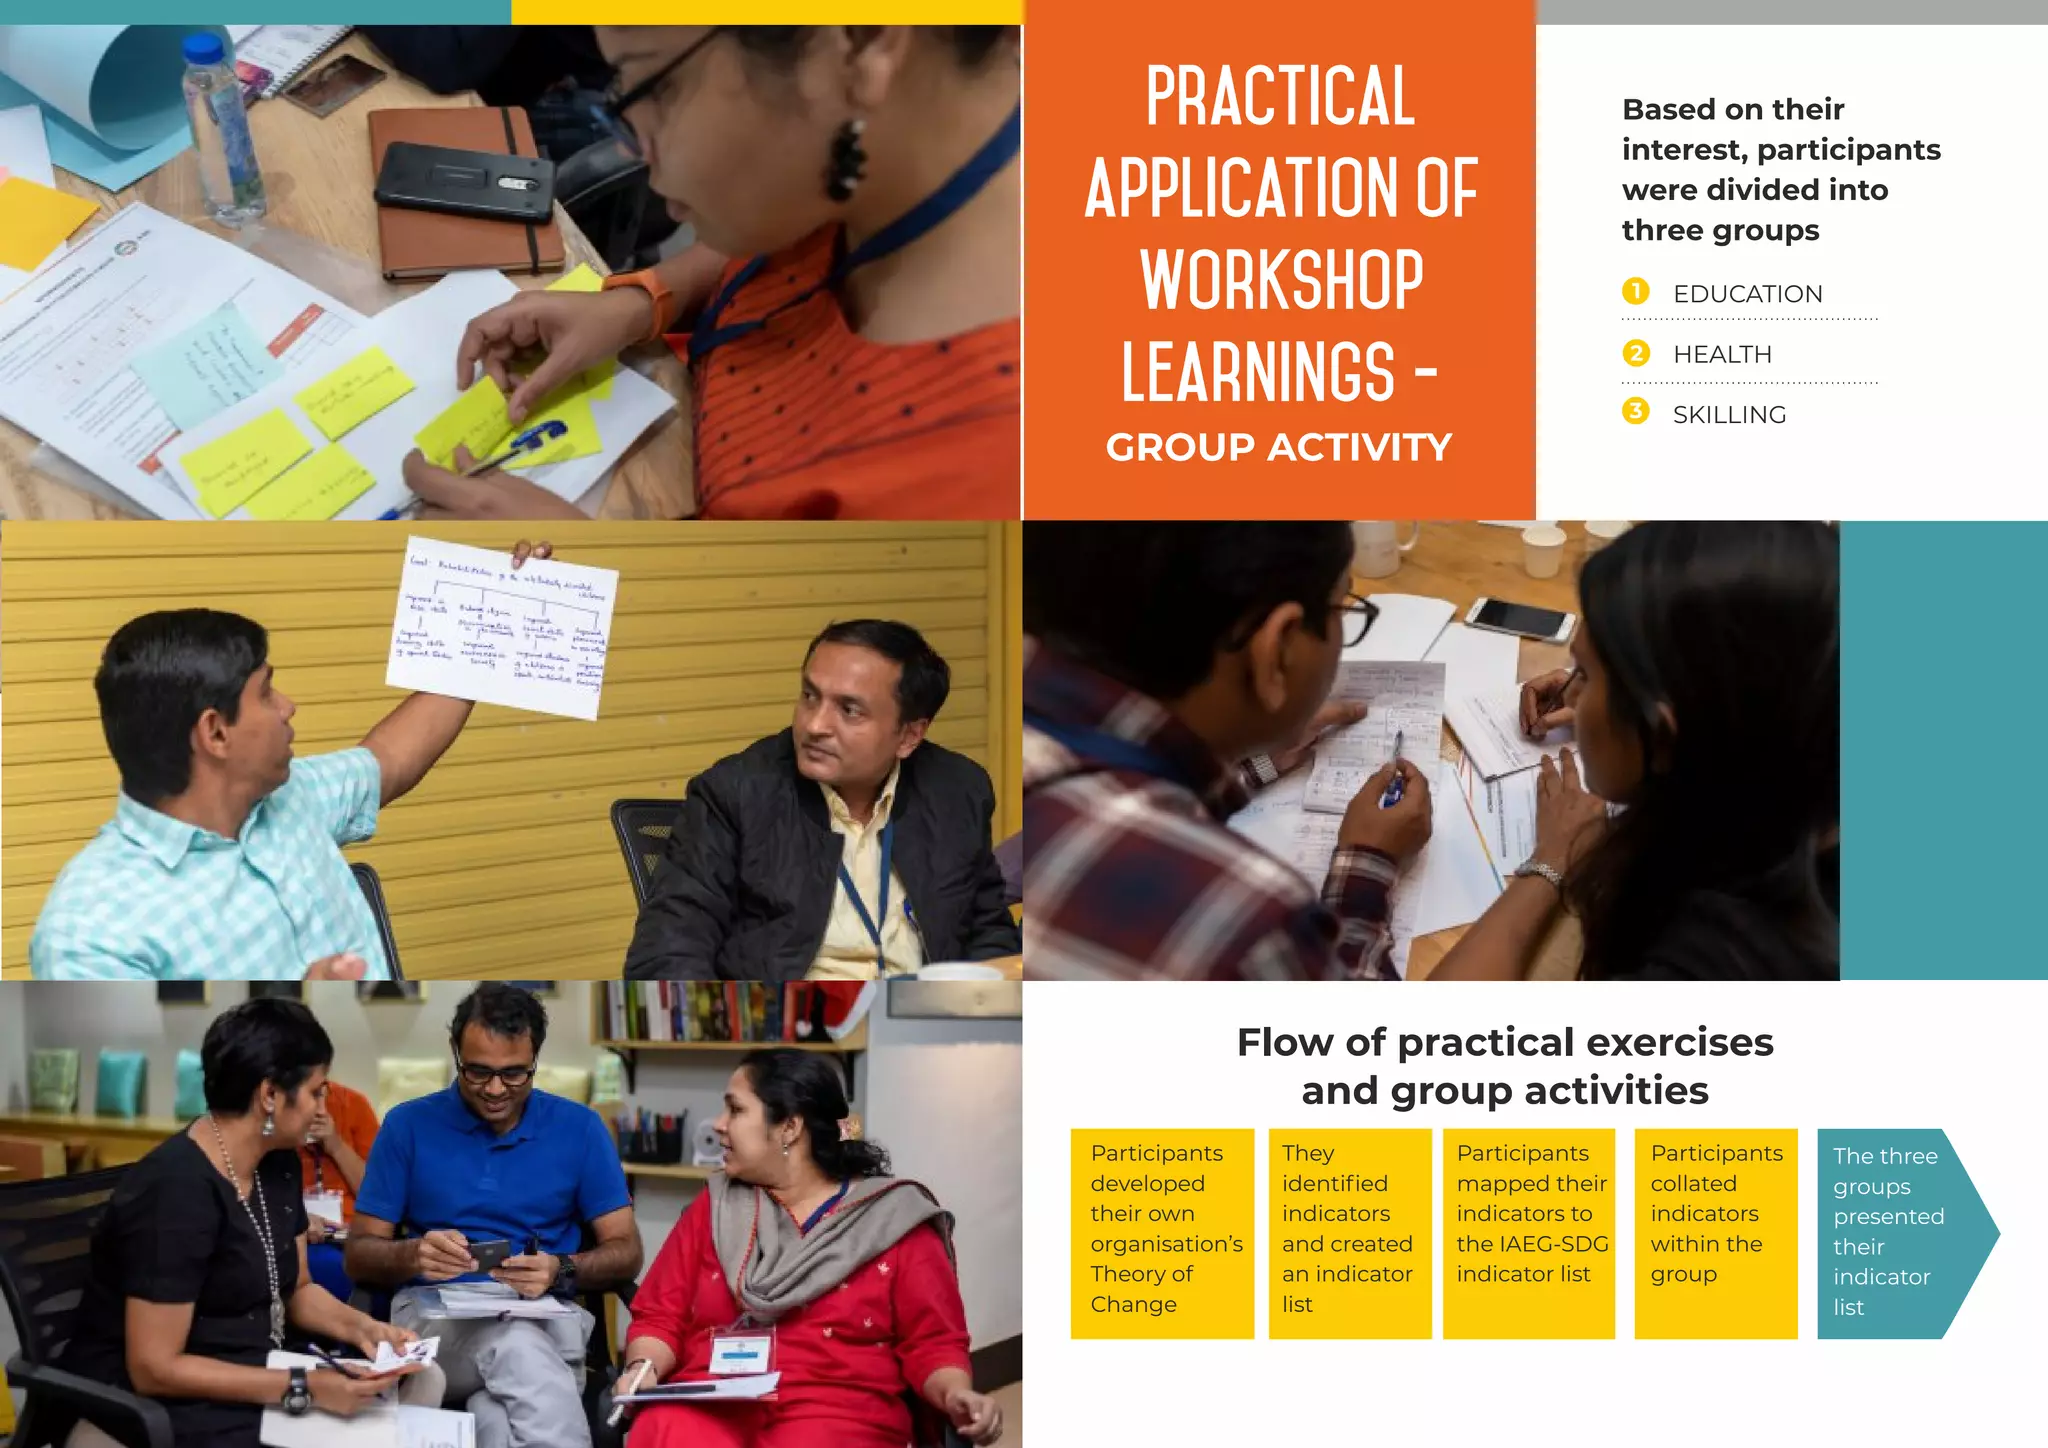
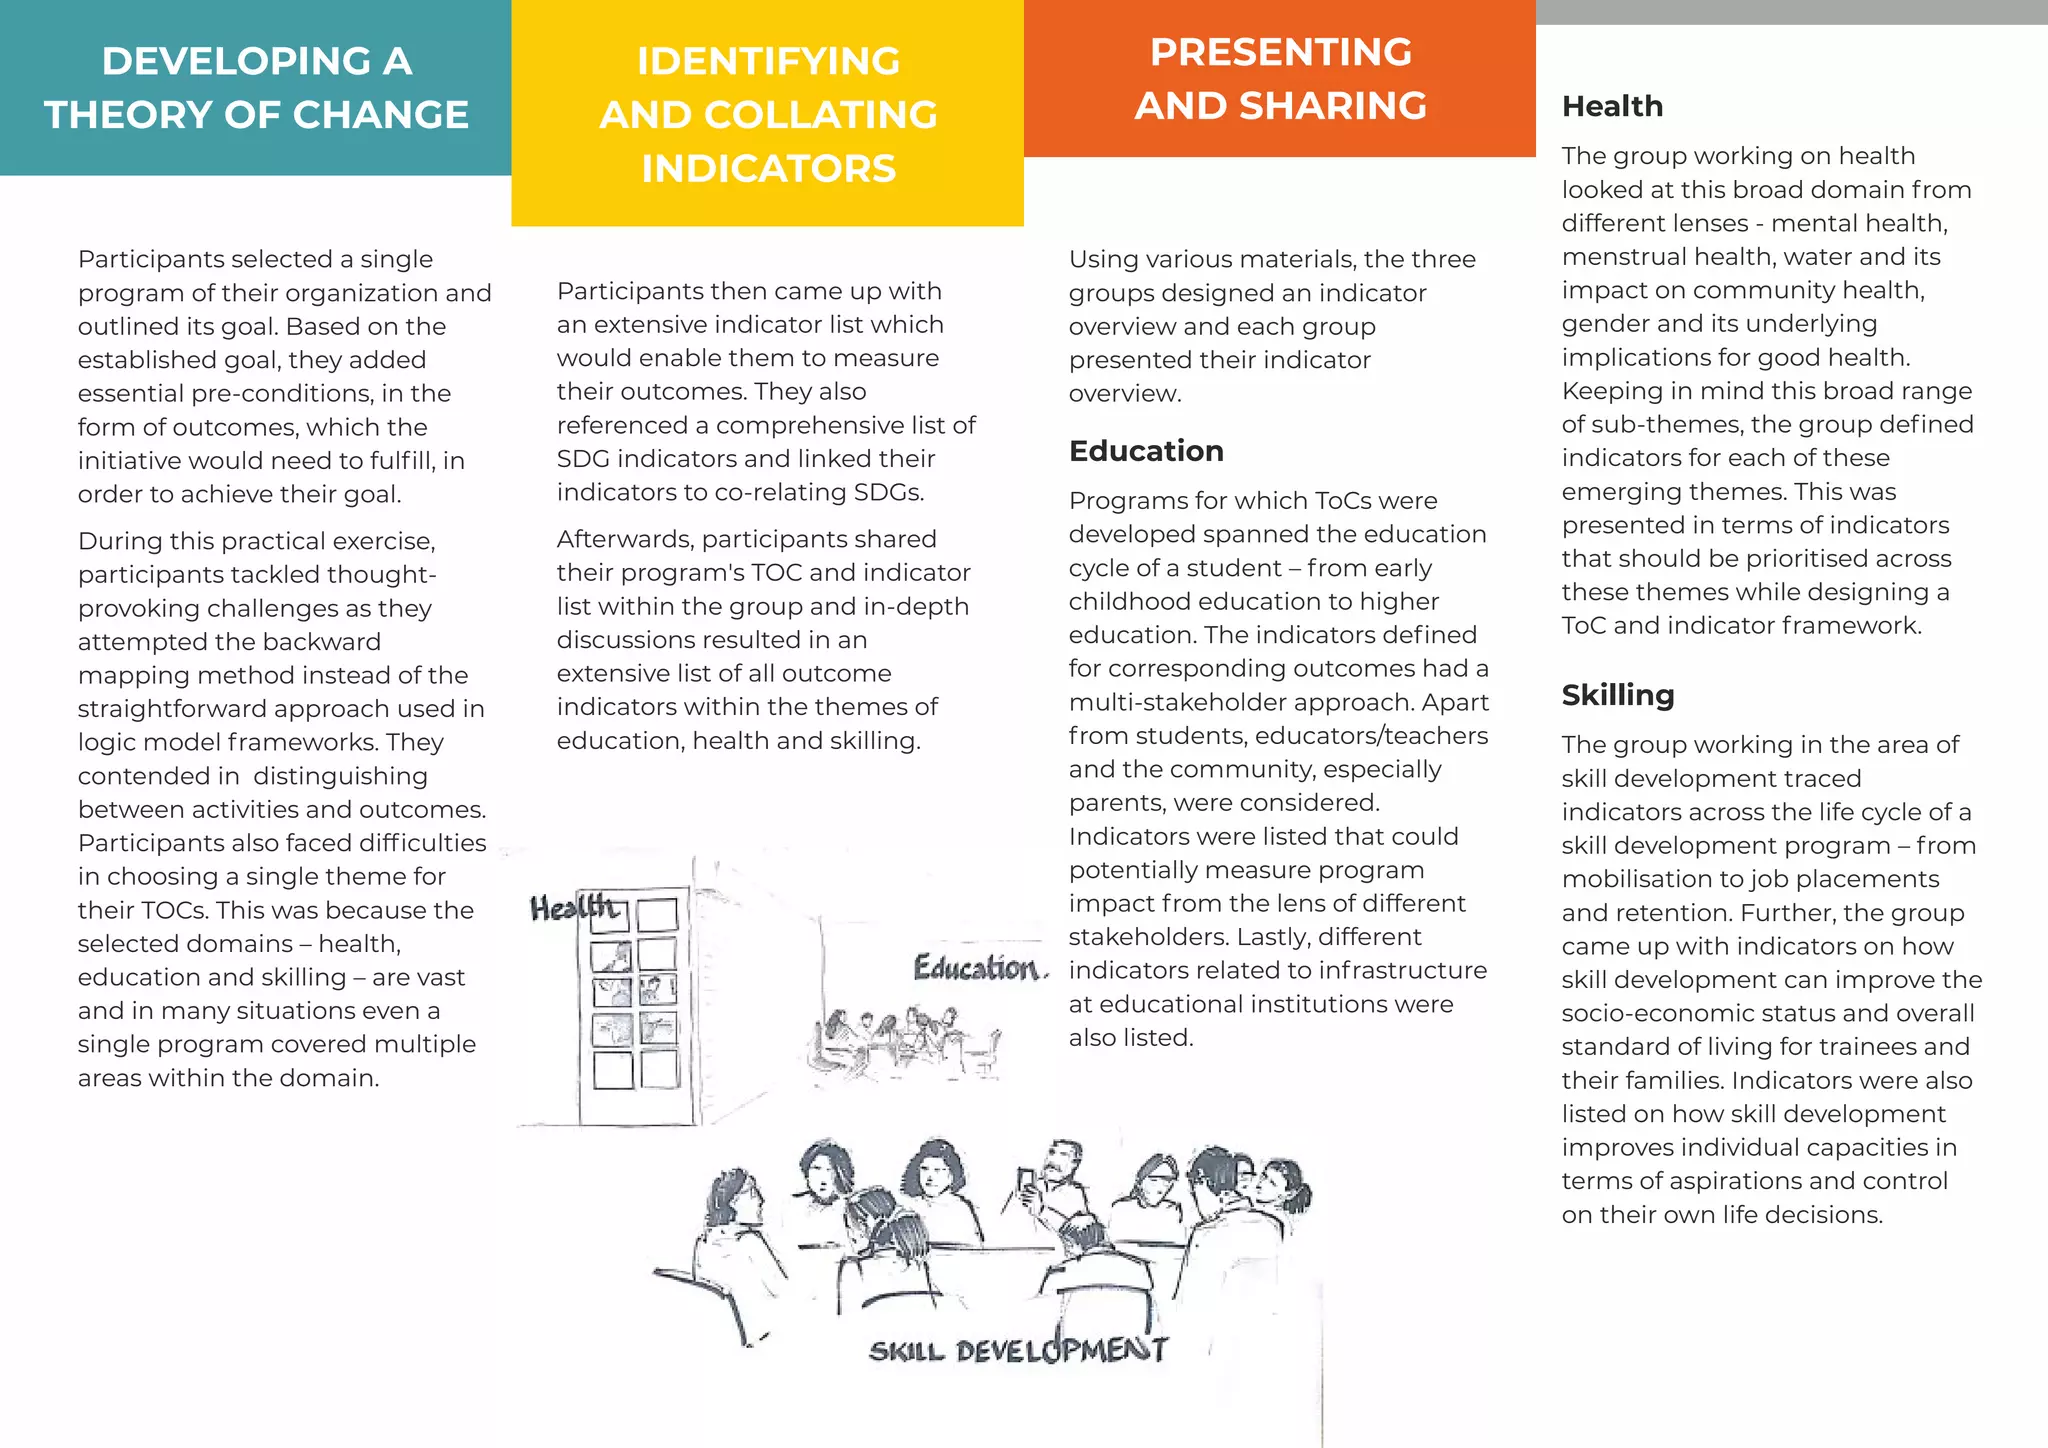
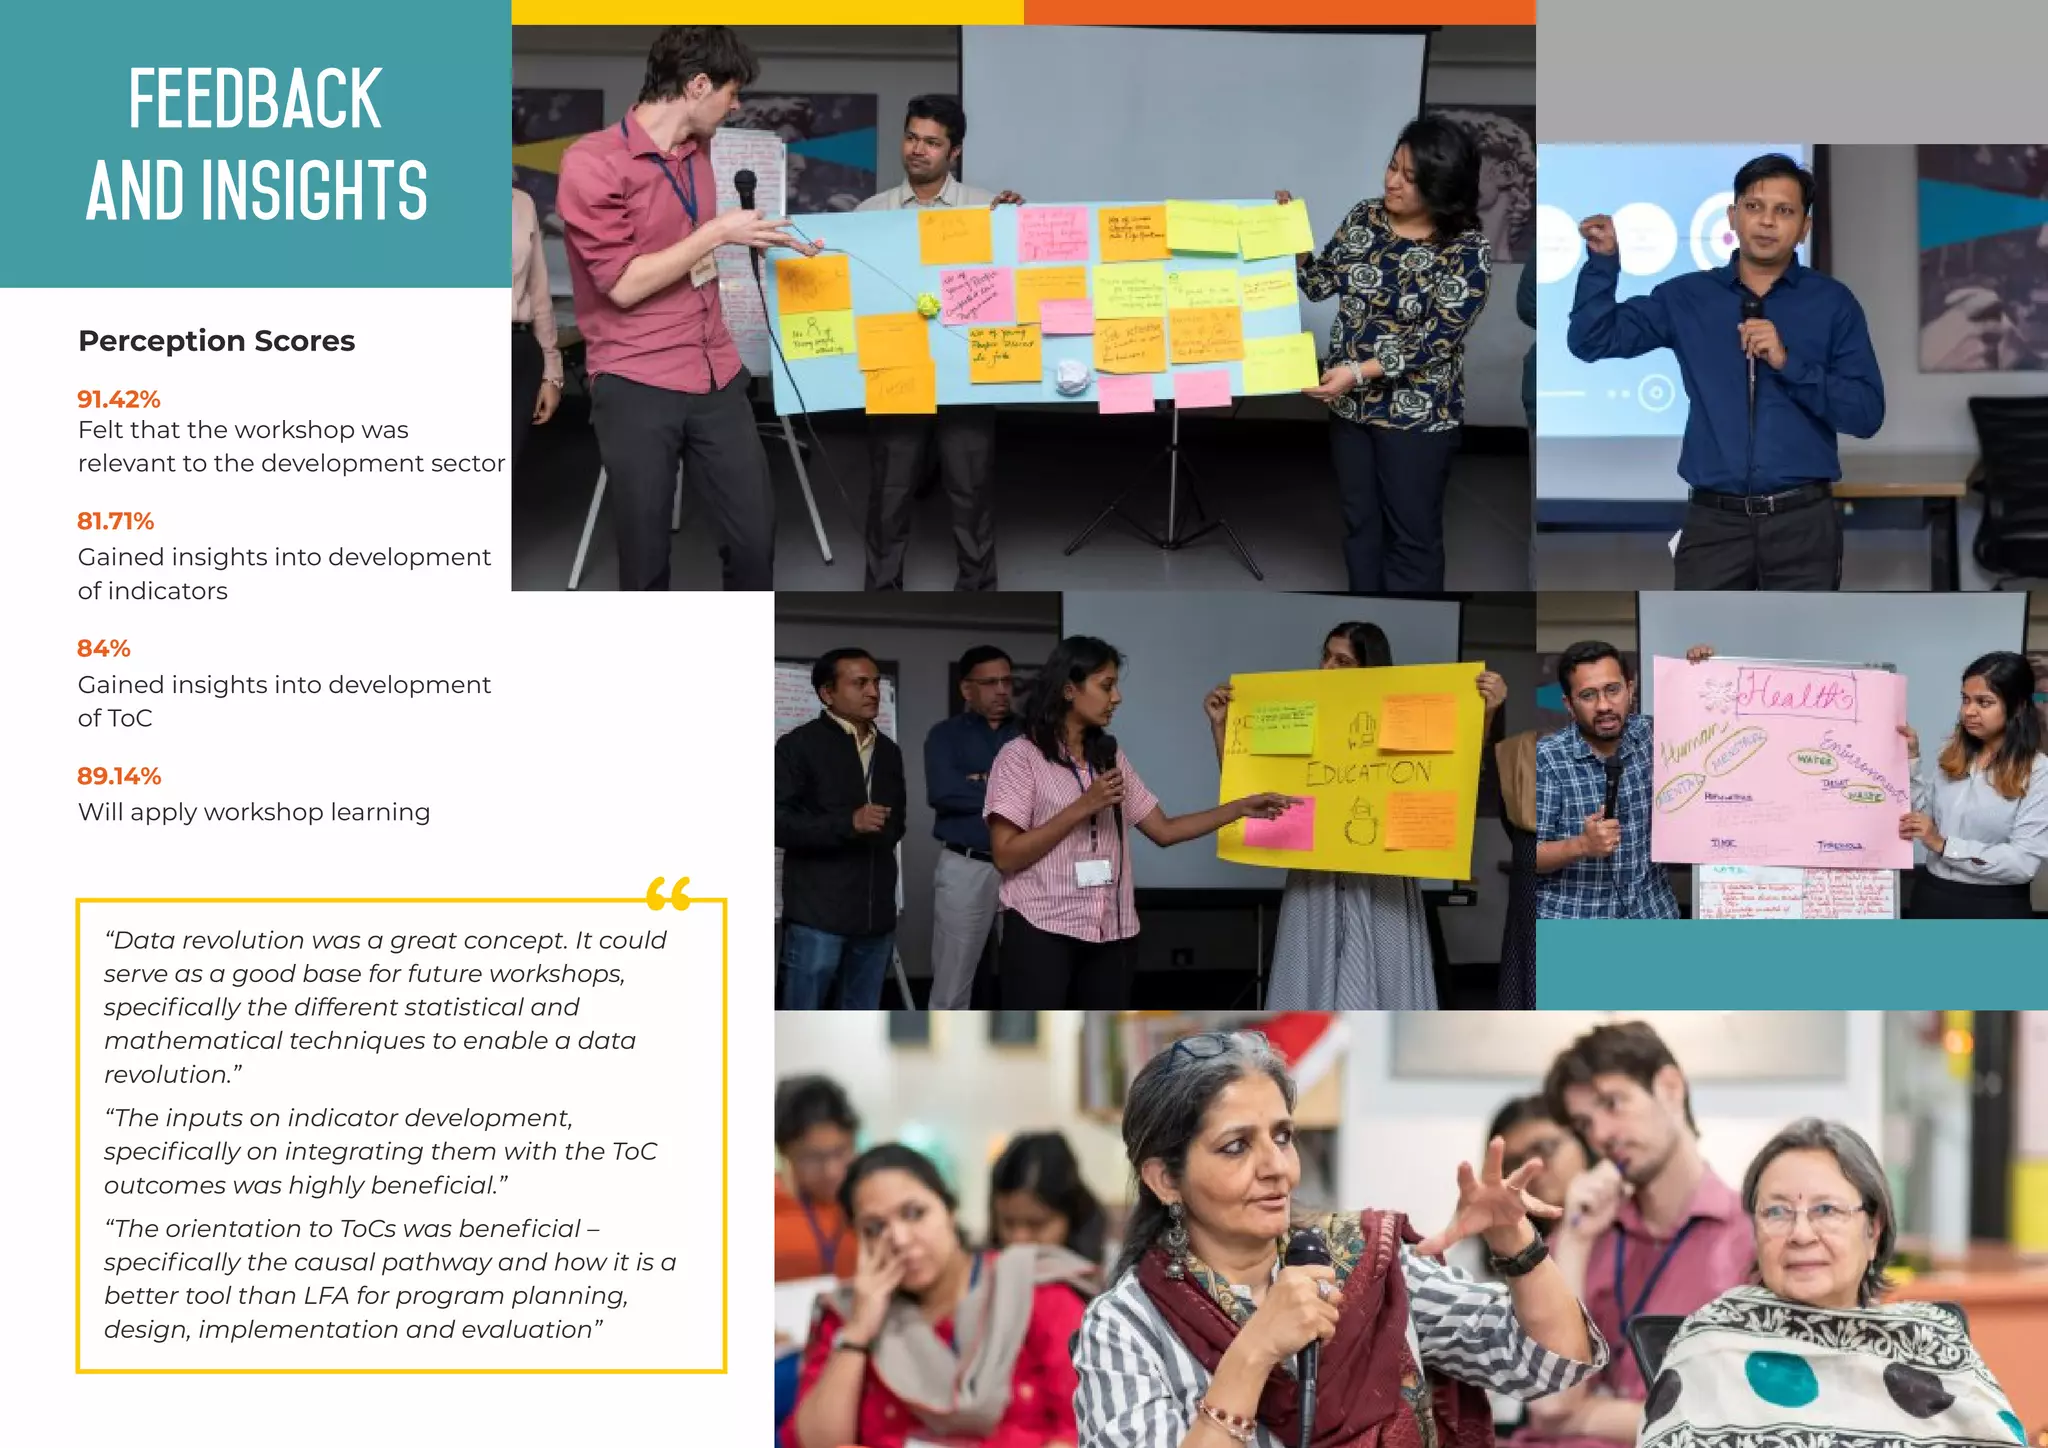
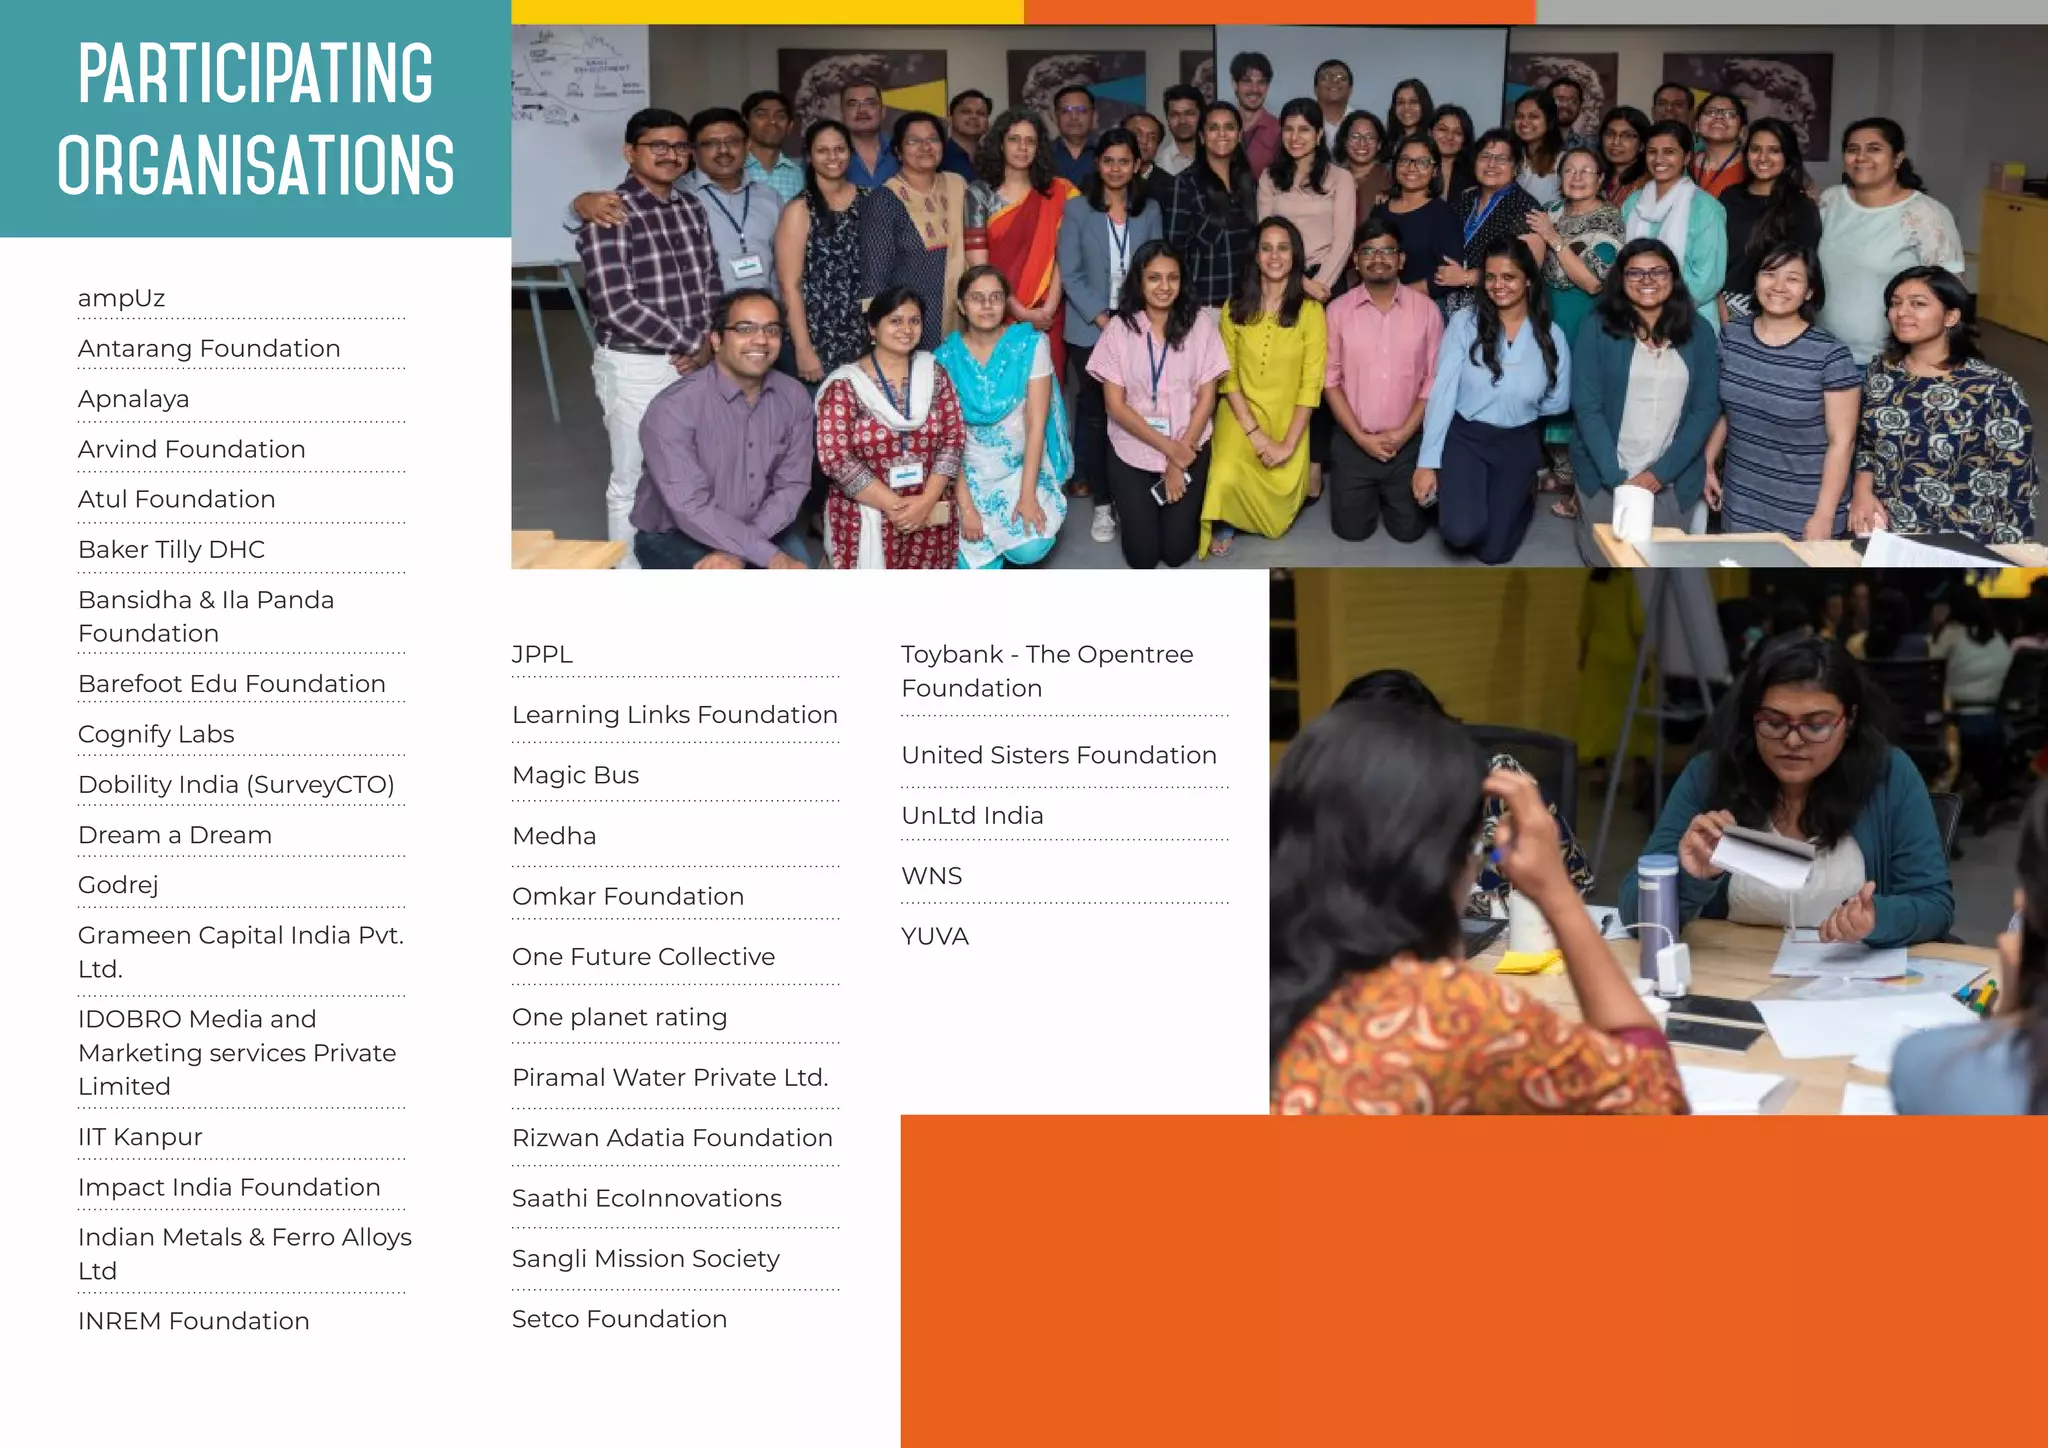

The document details a workshop conducted by 4th Wheel Social Impact and the Swedish Institute aimed at enhancing social program design and evaluation in India by identifying and measuring contextualized indicators for Sustainable Development Goals (SDGs). It discusses the importance of data collection, theory of change (TOC) development, and best practices for indicator identification through practical group exercises. The workshop brought together development practitioners to share experiences and improve capacities in utilizing data and creating effective theories of change to track progress towards achieving global goals.


