More Related Content
Similar to Outcome-Mapping.pdf
Similar to Outcome-Mapping.pdf (20)
Outcome-Mapping.pdf
- 1. © INTRAC 2017
OUTCOME
MAPPING
Outcome Mapping focuses on changes in the behaviour of the people, groups and organisations influenced
by a project or programme. Like the logical framework, it is a planning methodology that has implications
for how monitoring and evaluation is conducted. However, Outcome Mapping is designed to deal with
complexity, and is not based around linear models of change.
Outcome Mapping was originally developed by the
International Development Research Centre in Canada. The
first comprehensive Outcome Mapping manual was
produced in 2001. Outcome Mapping seeks to identify and
assess changes in the behaviour of people, groups and
organisations with which a project or programme works
directly. It does not seek to prove causality or attribution
for those changes, but instead attempts to show logical
linkages between the changes and a project or
programme’s activities, thereby enabling contribution to
change to be understood (Earl et. al. 2001)
Outcome Mapping is a participatory planning methodology,
which has implications for how monitoring and evaluation
is conducted. It is based on the principle of participation,
and purposefully includes those implementing a project or
programme in both design and data collection to
encourage ownership and the use of findings. It was
designed to be a “consciousness-raising, consensus-
building, and empowerment tool for those working within a
development programme” (ibid, p4).
Some people use the complete Outcome Mapping
methodology, whilst others apply only some of its elements
and principles. Outcome Mapping forms part of a portfolio
of tools and methodologies that address complexity, and
increasingly are being seen as alternatives to the more
linear, measurement-based models of the logical
framework and results-based management.
How it works
Outcome Mapping is designed to be used at the beginning
of a programme, after the main focus of that programme
has been decided. There are three key stages to planning
an outcome map.
1. The first stage, Intentional Design, helps a programme
establish consensus on the changes it aims to help bring
about, and plan the strategies it will use. It helps answer
four questions:
• what is the vision to which the project or
programme wants to contribute?
• who are its boundary partners?
• what are the changes that are being sought?
• how will the project or programme contribute to
the change process?
2. The second stage, Outcome and Performance
Monitoring, provides a framework for the ongoing
monitoring of the programme's actions and the
boundary partners' progress toward the achievement of
‘outcomes’. Monitoring is based largely on self-
assessment.
3. The third stage, Evaluation Planning, helps the
programme identify evaluation priorities and develop an
evaluation plan.
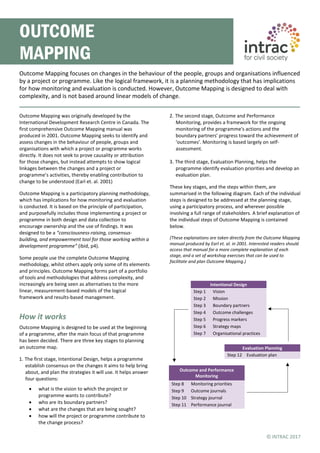
These key stages, and the steps within them, are
summarised in the following diagram. Each of the individual
steps is designed to be addressed at the planning stage,
using a participatory process, and wherever possible
involving a full range of stakeholders. A brief explanation of
the individual steps of Outcome Mapping is contained
below.
(These explanations are taken directly from the Outcome Mapping
manual produced by Earl et. al. in 2001. Interested readers should
access that manual for a more complete explanation of each
stage, and a set of workshop exercises that can be used to
facilitate and plan Outcome Mapping.)
Intentional Design
Step 1 Vision
Step 2 Mission
Step 3 Boundary partners
Step 4 Outcome challenges
Step 5 Progress markers
Step 6 Strategy maps
Step 7 Organisational practices
Evaluation Planning
Step 12 Evaluation plan
Outcome and Performance
Monitoring
Step 8 Monitoring priorities
Step 9 Outcome journals
Step 10 Strategy journal
Step 11 Performance journal
- 2. © INTRAC 2017
Although the steps are all designed to be used at the
planning stage, they also set the scene for how monitoring
and evaluation will be conducted later on. For example,
journals may be developed that will later be used for
ongoing monitoring
Firstly, a vision is developed (STEP 1) that reflects the large-
scale, development-related changes that the programme
hopes to encourage. The vision describes economic,
political, social, or environmental changes that the
programme hopes to help bring about. The programme’s
activities should contribute to the vision, but not be solely
responsible for achieving it.
Next, a mission statement is developed (STEP 2) that
describes how the programme intends to support the
vision. The mission statement states the areas in which the
programme will work towards the vision, but does not list
all the activities which the programme will carry out.
Then boundary partners are identified (STEP 3). These are
the individuals, groups, or organisations with which the
programme interacts directly, and where there will be
opportunities for influence (see diagram below). Boundary
partners may be individual organisations but might also
include multiple individuals, groups, or organisations if a
similar change is being sought across many different groups
(for example, research centres or community groups).
In STEP 4 an outcome challenge statement is developed for
each boundary partner. It describes how the behaviour,
relationships, activities or actions of the individual, group,
or institution will change if the programme is extremely
successful. Outcome challenges are phrased in a way that
emphasises behavioural change.
A set of progress markers are then identified (STEP 5) for
each boundary partner. These are desired visible,
behavioural changes ranging from the minimum one would
expect to see the boundary partners doing as an early
response to the programme, to what it would like to see,
and finally to what it would love to see them doing if the
programme were having a profound influence.
These progress markers represent changes that are easily
measurable, and will show if progress is being made
towards the desired outcomes of the programme. They are
designed to show progress as a group of markers rather
than as individual indicators, which are more common
when working with logical frameworks. An example of a set
of progress markers is shown in the table below.
In STEP 6 a strategy map is developed to help identify the
strategies used by the program to contribute to the
achievement of each outcome challenge. For most
outcome challenges, a mixed set of strategies is used
because it is believed this has a greater potential for
success.
The purpose of STEP 7 is to identify the organisational
practices that the programme will use to be effective.
These organisational practices describe a well-performing
organisation that has the potential to support the boundary
partners and sustain change interventions over time.
Monitoring priorities are then identified (STEP 8) to focus
time and resources on where they are most needed.
Monitoring priorities are divided into three areas:
organisational practices; progress toward the outcomes
being achieved by boundary partners; and the strategies
that the programme is employing to encourage change in
its boundary partners.
STEPS 9-11 consist of the establishment of journals to
monitor progress over time in the three areas described
above. Firstly, an outcome journal is established to record
changes for each boundary partner. It includes the progress
markers set out in step 5; a description of the level of
change as low, medium, or high; and a place to record who
among the boundary partners exhibited the change.
Then, in order to provide the programme with a systematic
way to monitor its actions in support of its boundary
partners, Outcome Mapping provides a strategy journal,
which can be adapted. This journal records data on the
Expect to see
partner ...
• organising staff training to interact with
communities better
• inviting communities to contribute
opinions
• visiting communities in the field on a
regular basis
Like to see
partner ...
• developing policies and protocols for
engaging with communities
• receiving and discussing comments from
community groups
• regularly meeting to consider
communities’ opinions and comments
• making amendments to projects based
on community feedback
Love to see
partner ...
• developing projects and programmes
alongside communities
• inviting community representatives onto
decision-making forums
• being accountable to communities
through regularly reporting on progress
and lessons learned
PROGRAMME
Boundary
Partners
THE REAL WORLD
- 3. © INTRAC 2017
strategies being employed, and is filled in during the
programme's regular monitoring meetings.
A performance journal is also created for the programme
which records data on how it is operating as an
organisation to fulfil its mission. This is also filled in during
regular monitoring meetings.
The final step (STEP 12) is to develop a descriptive plan of a
proposed evaluation for the programme. This outlines the
evaluation issue, the way findings will be used, the
questions, sources and methods to be used, the nature of
the evaluation team, the proposed dates and the
approximate cost. This information is intended to guide the
evaluation design.
Strengths and weaknesses
Unlike some advocates of the logical framework approach
to planning, supporters of Outcome Mapping do not claim
it is appropriate in all situations. This, added to the fact that
Outcome Mapping is rarely forced on organisations as a
condition of funding, means debates surrounding Outcome
Mapping are less intense than those surrounding the logical
framework. But there is still a divergence of opinion; some
who have used Outcome Mapping love it as a
methodology, and some dislike it.
Some of Outcome Mapping’s strengths can be listed as
follows.
It introduces monitoring and evaluation at an early
stage of a programme, and ensures that monitoring and
evaluation is built into programme design.
Outcome Mapping is a participatory tool and therefore
encourages multi-stakeholder dialogue, as well as
learning amongst different participants. It is designed to
contribute to the development process itself.
Because it is based on outcomes of observable
behaviour change, it can be more intuitive for field
workers to grasp than the sometimes more abstract
language of objectives.
It encourages programmes to assess both the outcomes
of programmes – therefore focusing clearly on change –
and the processes through which those outcomes are
generated.
It is much better than linear planning tools at dealing
with complexity. Outcome Mapping does not seek to
show direct attribution for change resulting from a
single source. This means Outcome Mapping may be
more appropriate for the monitoring and evaluation of
programmes with multiple inputs.
Because Outcome Mapping involves the identification
of a spread of possible outcomes (progress markers)
ranging from those stakeholders expect to see to those
they would like or love to see, it avoids the need for
precise predictions about the pace of change at the
beginning of a project or programme. This means it is
particularly useful when the pace of change cannot
easily be predicted.
Because of its focus on boundary partners, Outcome
Mapping is good at dealing with programmes with a
special focus on organisational change. It can therefore
be used to support the monitoring and evaluation of
capacity development – an area which people find
particularly difficult to assess using more linear tools
(see Simister and Smith 2010).
However, Outcome Mapping is not appropriate in all
circumstances. Some of its limitations have been described
as follows.
Because it deals with contribution rather than
attribution it cannot easily be used for processes that
require hard measurement of results, such as cost-
benefit analysis or value for money assessment.
As with any participatory methodology, Outcome
Mapping requires a great deal of time, effort and
patience to do well. Significant resources are required
both in terms of programme staff and the people,
groups and organisations being supported.
Outcome Mapping may be best used at the level of
small programmes or larger projects. It is not a tool that
is necessarily appropriate for handling large, complex
programmes, because it may be difficult to identify who
will change and how. Earl et. al. (2001) point out that to
be effective Outcome Mapping must be sufficiently
specific to enable the identification of key groups who
will be influenced by a programme. Equally, Outcome
Mapping may not be appropriate for small projects
where the investment of time needed would not be
proportional to the likely benefits.
The journaling approach to tracking progress means the
technique generates a lot of data, creating challenges
for data analysis.
Outcome Mapping is good at identifying changes within
supported groups who are part of the process, partly
because it encourages self-reflection and self-
assessment. It may not be so useful for identifying
change for people, organisations or groups that lie
outside a programme, such as the targets of policy
influencing work.
Outcome Mapping does not focus predominantly on
impact assessment. It recognises the need to look at
long-term changes in people’s lives brought about by
development interventions, but regards this as the
responsibility of a programme’s boundary partners. If
donors require in-depth impact assessment then
Outcome Mapping needs to be supplemented by other
tools and methodologies.
In comparison with the logical framework, Outcome
Mapping is less able to provide a short, concise
summary of a project, programme or organisation.
Adaptations
Although Outcome Mapping can be, and frequently is, used
as a methodology in its entirety, it is often adapted, and
can be used in conjunction with other methodologies such
- 4. © INTRAC 2017
as the logical framework. Indeed it is perfectly possible to
embed an Outcome Map within a logical framework, or set
logframe indicators that can be generated by Outcome
Mapping processes.
Individual features of Outcome Mapping – such as the
setting of progress markers at expect to see, like to see and
love to see levels – are often used, even when the entire
methodology is not. Many CSOs have also carried out work
that is based on the principles of Outcome Mapping – such
as participatory planning, understanding of complexity,
valuing contribution rather than attribution – without
necessarily adopting the process in its entirety.
Further reading and resources
The M&E Universe contains other papers dealing with subjects that address complexity within planning, monitoring and
evaluation. These include Theory of Change, scenario planning and most significant change methodology.
The most comprehensive guide to Outcome Mapping is a guide written by Earl et. al. in 2001 (see reference below). This is
available at www.outcomemapping.ca/download/OM_English_final.pdf. There is also an Outcome Mapping community website
at www.outcomemapping.ca which is regularly updated and contains much information on how Outcome Mapping is being used
and applied. Further information, and a more comprehensive reading list for Outcome Mapping, can be found at the Better
Evaluation website at http://betterevaluation.org/
References
Earl, S; Carden, F and Smutylo, T (2001). Outcome Mapping: Building learning and reflection into development programmes.
Evaluation Unit, International Development Research Centre (IDRC), Ottawa, Canada.
Simister, N and Smith, R (2010). Monitoring and Evaluating Capacity Building: Is it really that difficult? Praxis paper no. 23,
INTRAC, January 2010.
Author(s):
Neil MacDonald
and Nigel Simister
INTRAC is a not-for-profit organisation that builds the skills and knowledge of civil society
organisations to be more effective in addressing poverty and inequality. Since 1992 INTRAC has
provided specialist support in monitoring and evaluation, working with people to develop their own
M&E approaches and tools, based on their needs. We encourage appropriate and practical M&E,
based on understanding what works in different contexts.
The logical framework Scenario planning
Theory of Change Most Significant Change
INTRAC Training
We support skills development and learning on a range of
themes through high quality and engaging face-to-face,
online and tailor-made training and coaching.
Email: training@intrac.org Tel: +44 (0)1865 201851
M&E Universe
For more papers in
the M&E Universe
series click the
home button
M&E Training & Consultancy
INTRAC’s team of M&E specialists offer consultancy and
training in all aspects of M&E, from core skills development
through to the design of complex M&E systems.
Email: info@intrac.org Tel: +44 (0)1865 201851
M&E Universe
For more papers in
the M&E Universe
series click the
home button