1) The document describes methods for detecting chemical agents like nerve agents, mustard, and cyanide in water using surface-enhanced Raman spectroscopy (SERS).
2) Two SERS substrates are tested: electrochemically roughened silver foils and silver- or gold-doped sol-gels. Samples of various chemical agents are prepared and their SERS spectra are collected and analyzed.
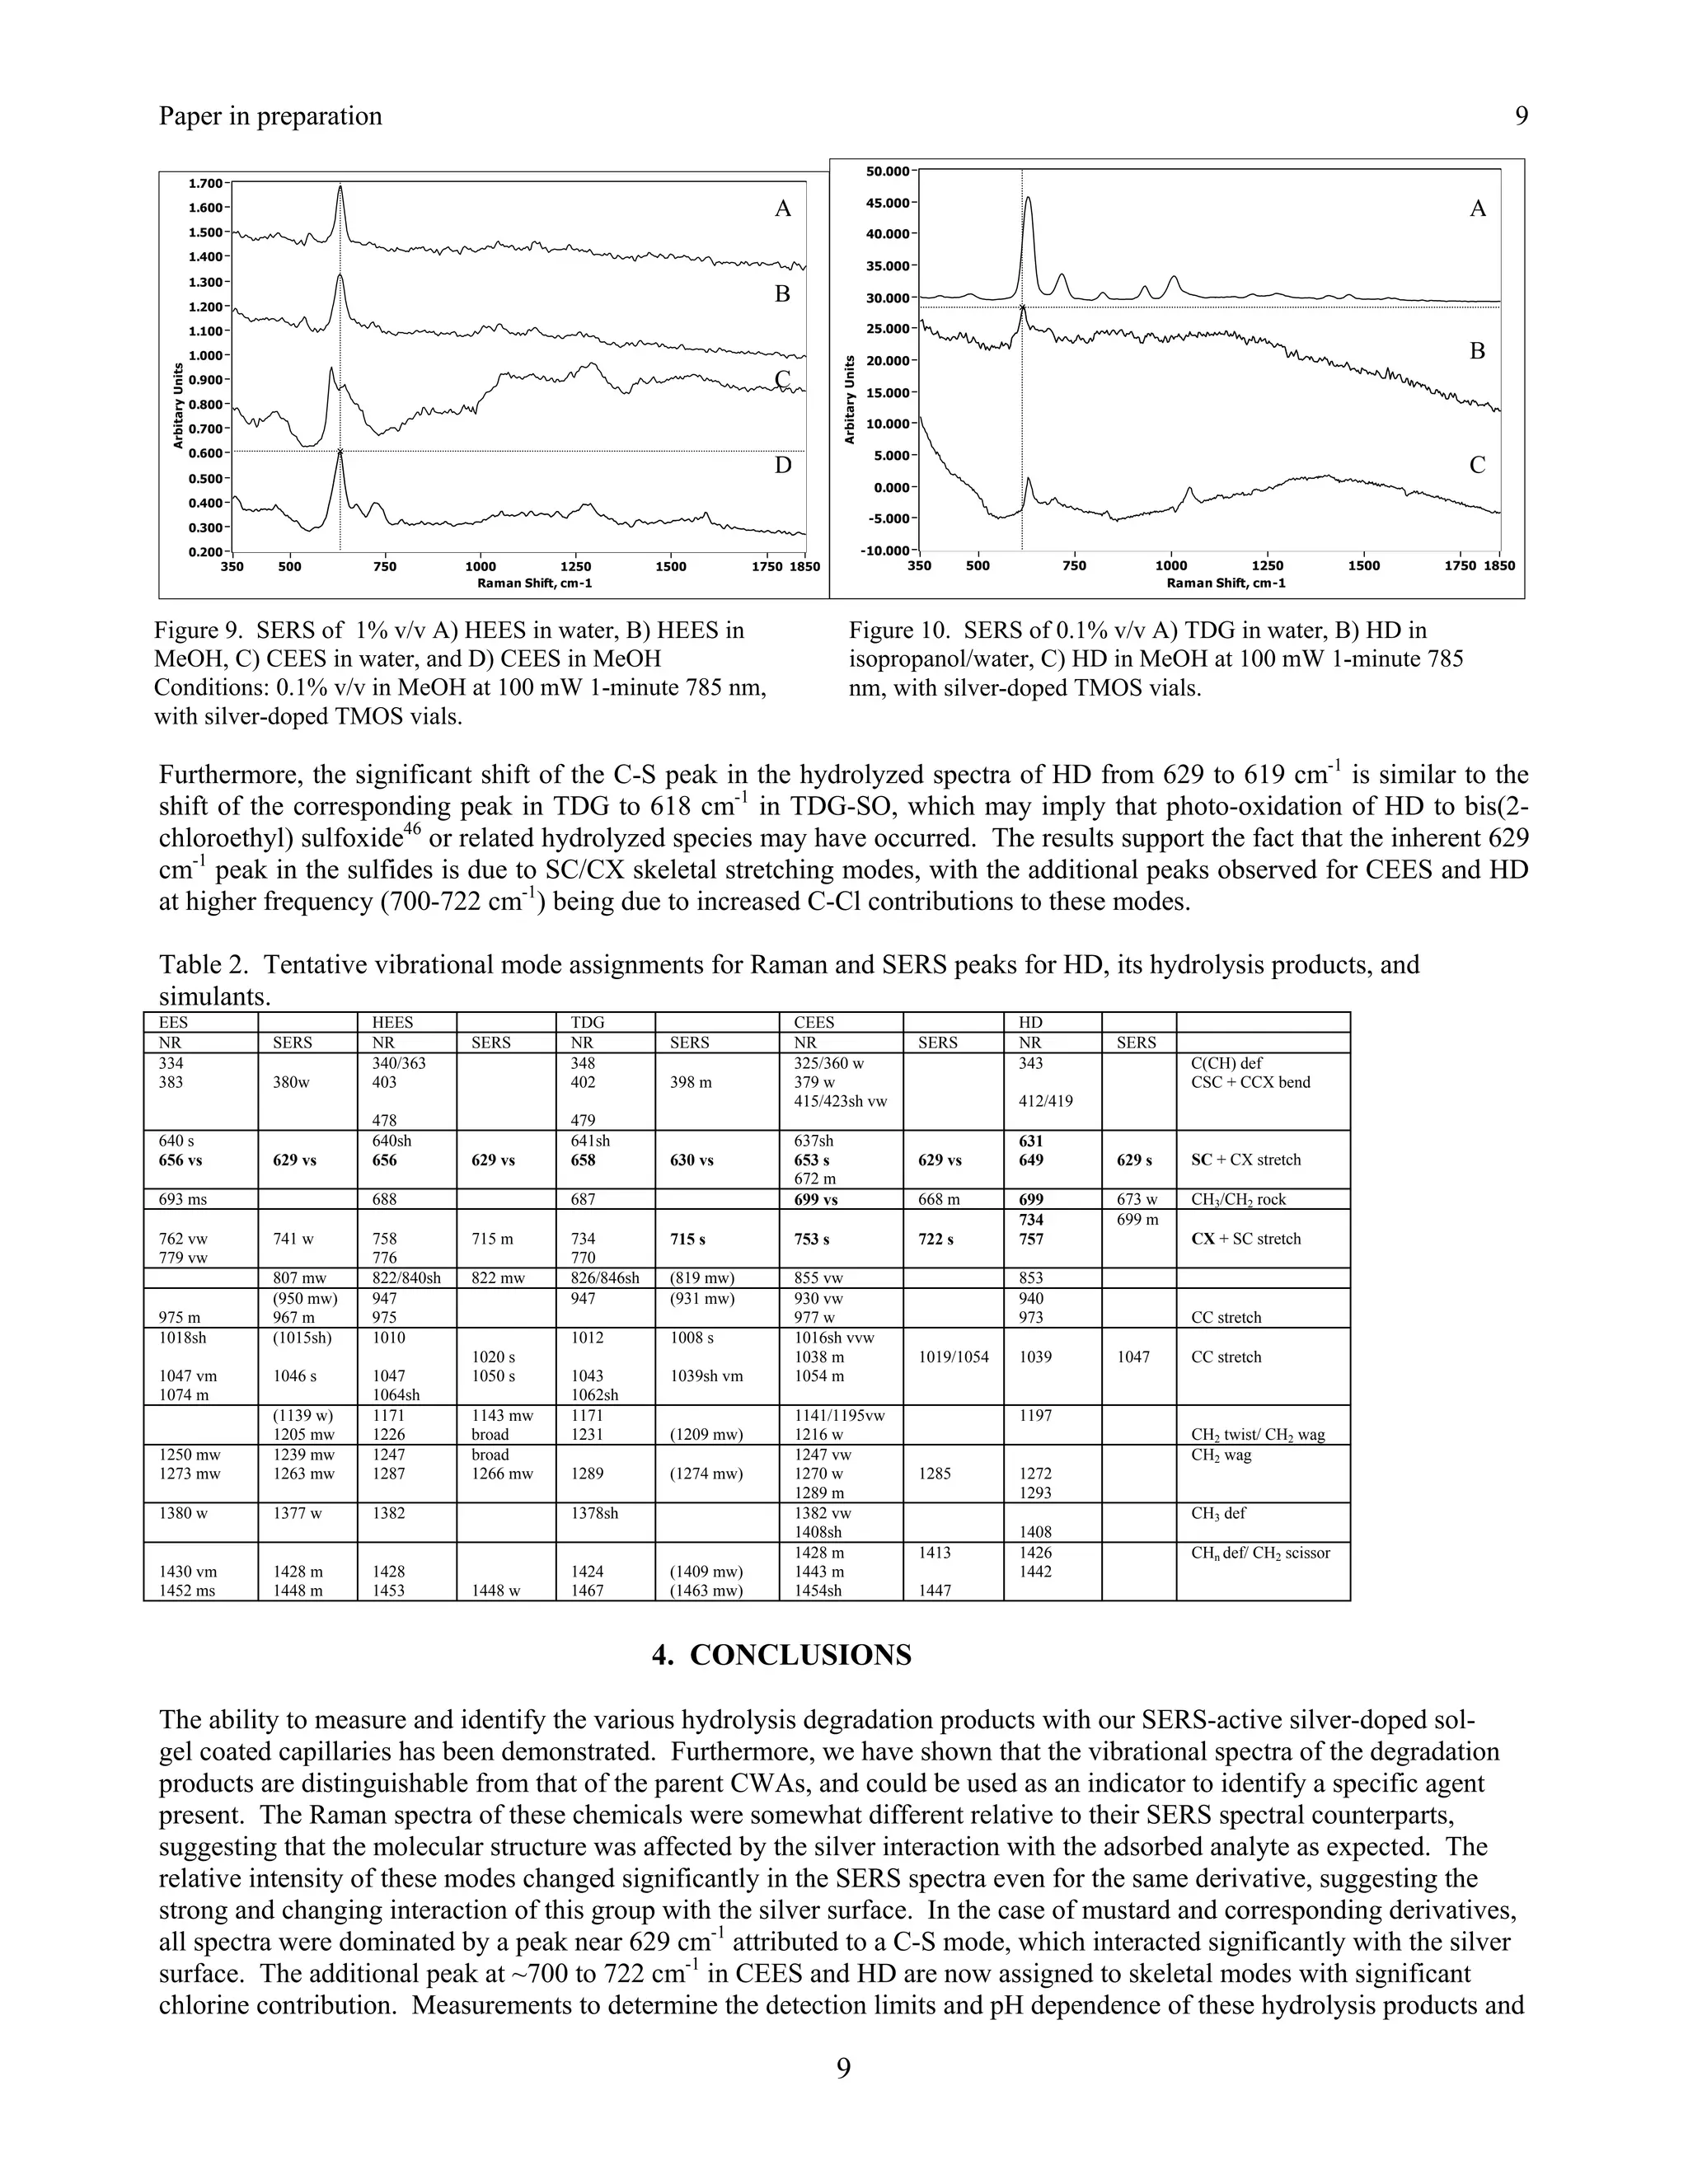
3) For sulfur mustard (HD) detected with both substrates, broad peaks are observed around 600-800 cm-1 assigned to C-S and C-Cl stretching modes, along with additional peaks around 1000-1300 cm-1 assigned to C-C stretching and CH2 bending modes. Peak shifts are consistent
![Springer Book Kneipp Editor Appendix M Draft 1
25. Detecting chemical agents and their hydrolysis products in water
Stuart Farquharson, Frank E. Inscore and Steve Christesen
Real-Time Analyzers, Middletown, CT, 06457
25.1 INTRODUCTION
The use of chemicals as weapons was introduced during World War I. It is estimated that chlorine, phosgene and
sulfur-mustard (HD) resulted in an estimated death of 100,000 soldiers and 1 million injuries [1]. Over the next 20
years, chemicals designed specifically for warfare were developed; this included the substantially more toxic nerve
agents, tabun, sarin, and soman (GA, GB, and GD, respectively). Fortunately, these abhorrent chemicals were not
used in WWII, as world leaders feared reprisal attacks on their cities. During the Iran-Iraq war in the 1980s, the
Iraqis used HD, GA, GB, and GF (cyclo-sarin), and in 1988, Saddam Hussein used mustard and possibly nerve
agents in killing several thousand Kurds [1].
In more recent years, chemical agents have been used by terrorists. In Japan, the Aum Shinrikyo religious cult
released GB within the Tokyo subway system in 1995 [2]. The release of GB in this confined space had devastating
effects resulting in 12 fatalities and hospitalization of thousands. This event and the mailing of anthrax causing
spores through the US Postal System in 2001 demonstrated that deployment of chemical and biological agents do
not require sophisticated delivery systems, and a wide range of attack scenarios must be considered. Among these
scenarios is the deliberate poisoning of drinking water. This includes water supplies used in military operations and
water delivered to major cities from reservoirs and through distribution systems. Countering such an attack requires
detecting poisons in water rapidly, and at very low concentrations.
The required detection sensitivity for each agent depends on several factors, such as toxicity and hydrolysis (Table
25.1). In the case of cyanide (AC) it known that 4 milligrams per liter of water produces detectable changes in
human blood chemistry and 8 mg L-1 causes severe, but reversible symptoms [3]. The military has used this and
other toxilogical data to set a field drinking water standard (FDWS) for cyanide at 2 mg L-1 [4]. The FDWS
represents the maximum allowable concentration that is assumed safe when 15 L of water per day is consumed over
5 days (expected soldier intake in arid climates). Human toxicity data for the other chemical warfare agents in water
have, in general, not been determined. The normal route of exposure for chemical warfare agents is inhalation, and
most of the toxicity data is given as the LCt50s [1], the concentration that is lethal to 50% of an exposed population
as a function of exposure time. In the case of mustard, animal studies along with the inhalation LCt50, the oral lethal
dosage of 0.7 mg per kg of body mass (LD50), and modeling studies [5], have been used to set the FDWS at 0.047
mg L-1. Similar analyses of LCt50s and LD50s for GB and VX have been used to set their FDWS at 0.0046 and
0.0025 mg L-1, respectively. The FDWS concentrations have also been used by the military to set the minimum
detection requirement for poisons in water.
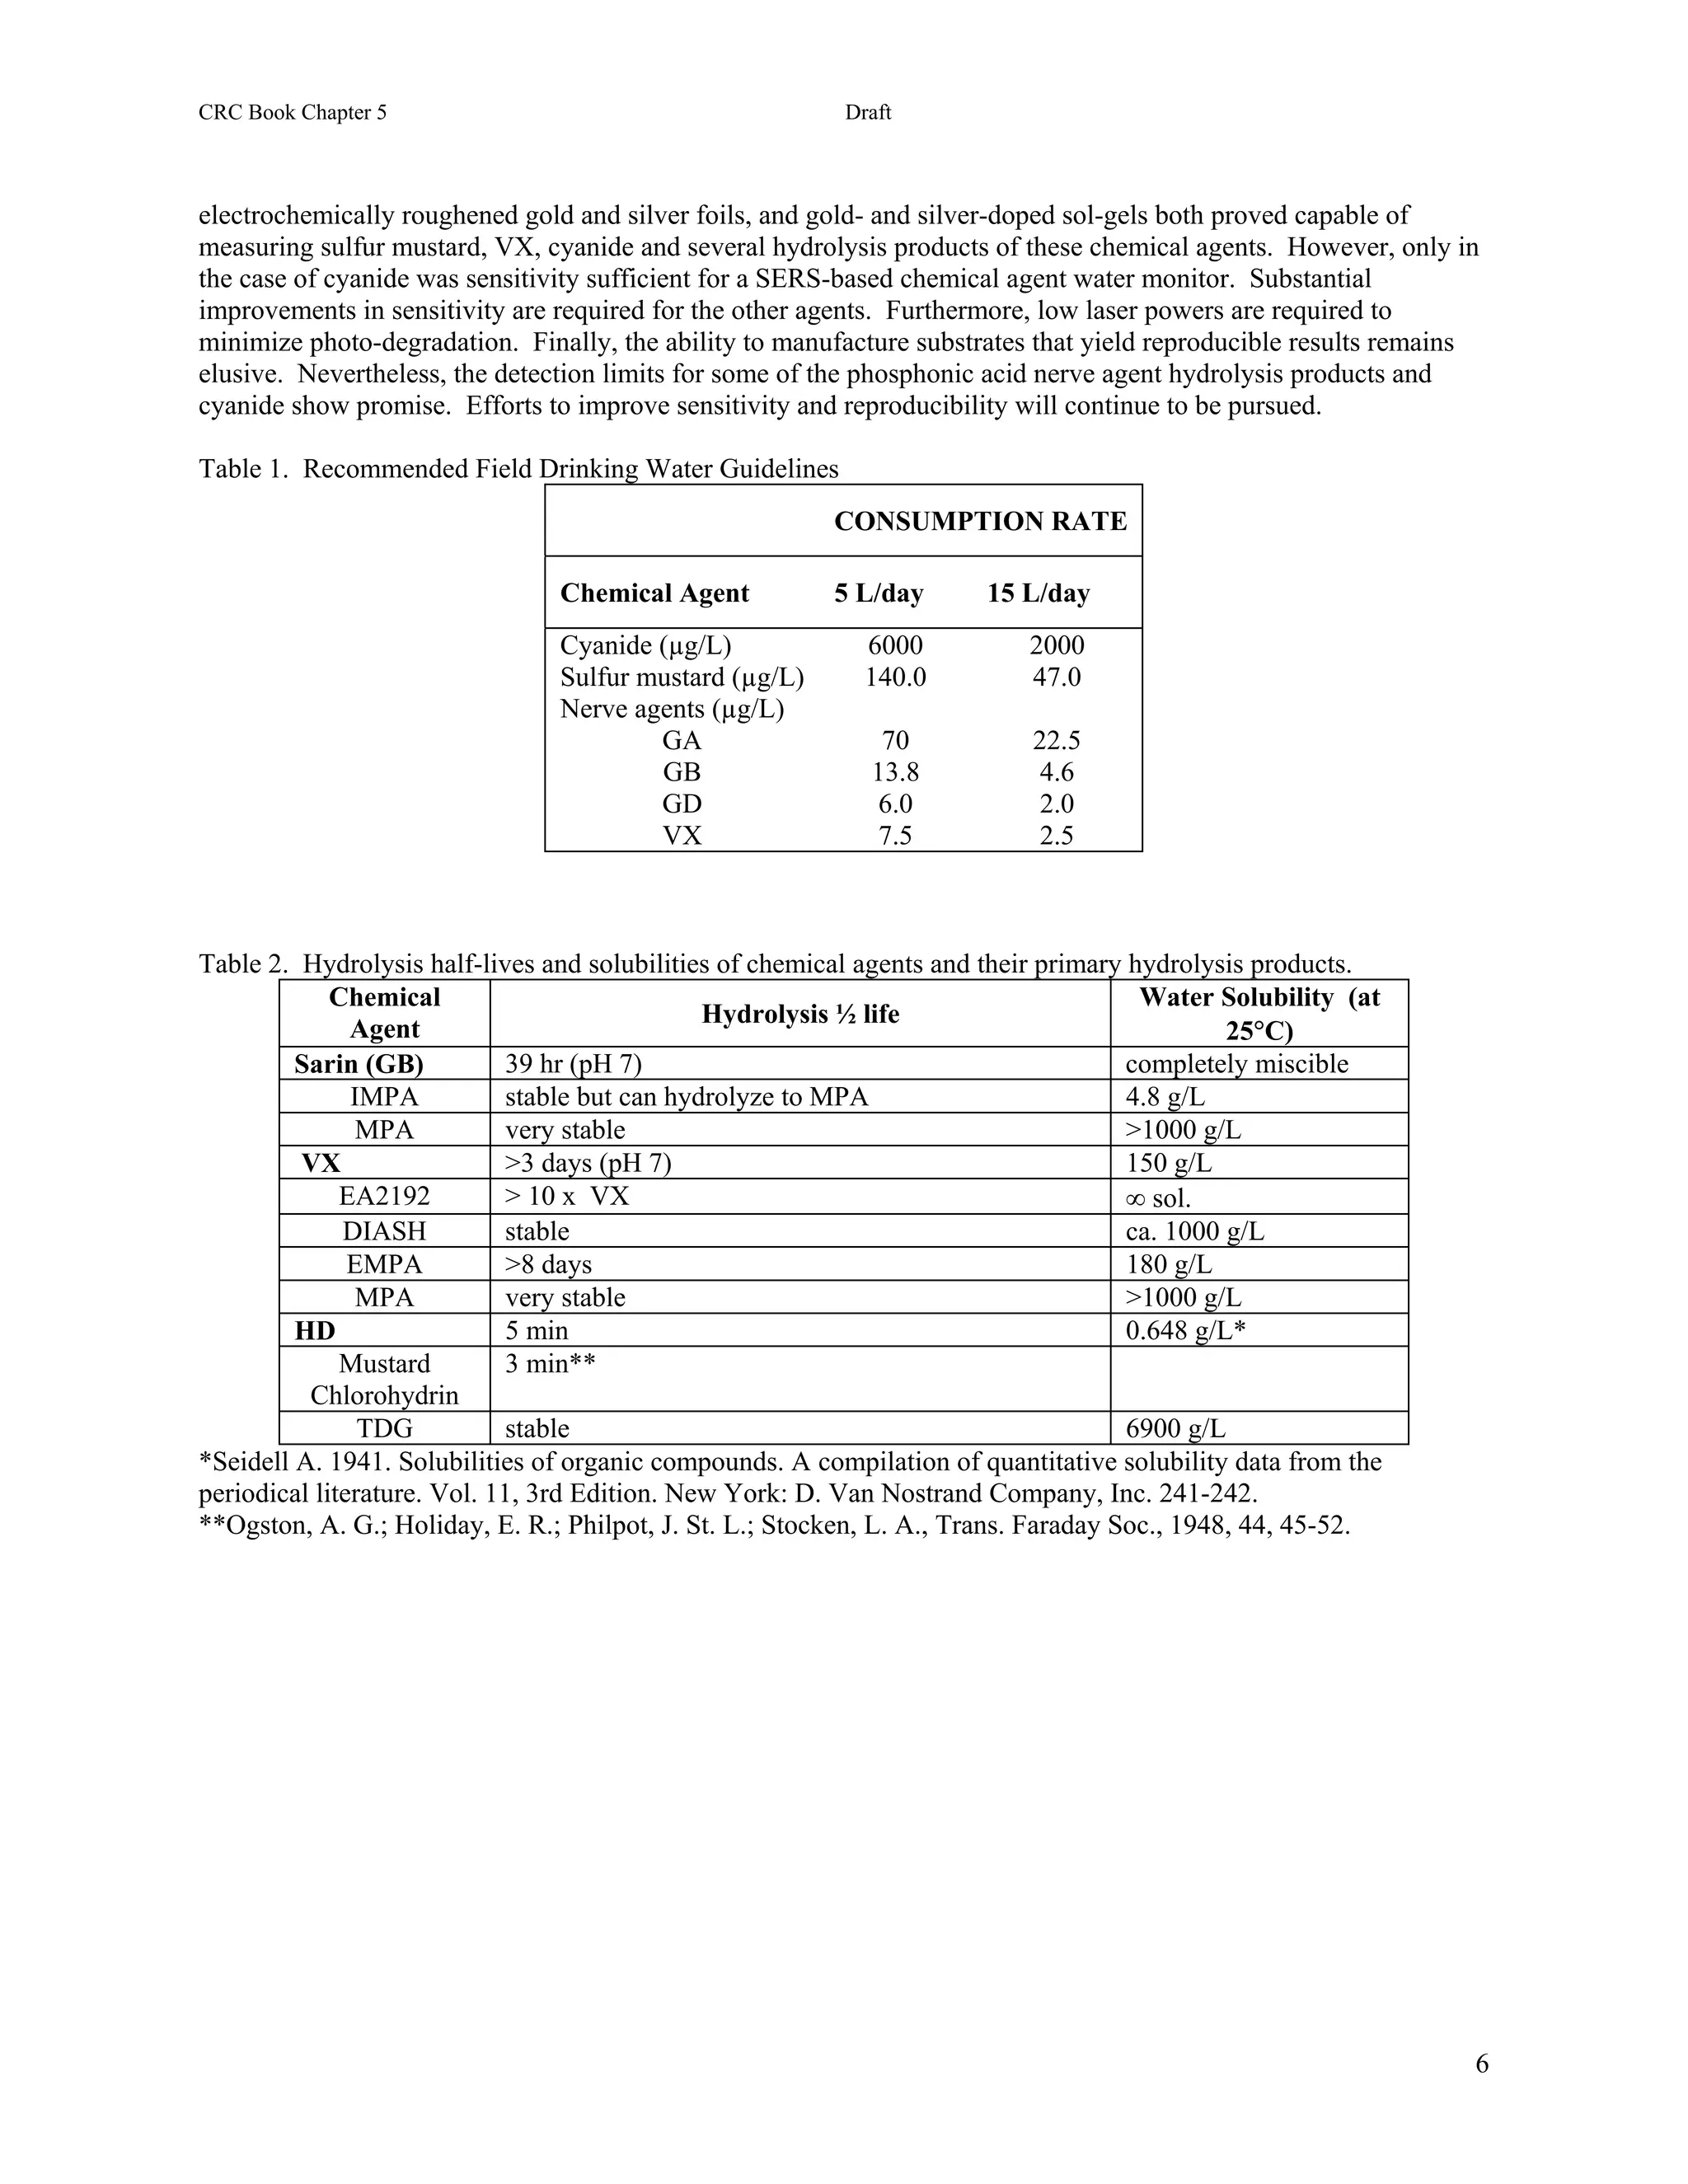
Table 25.1. Military field drinking water standard [4], lethal exposures and dosages [1,3,5], and water properties for
selected chemical warfare agents.
Chemical FDWS LCt50 LD50 Water Hydrolysis Hydrolysis
5-day/15L inhalation oral Solubility Half-Life* Product
(mg L-1) (mg-min m-3) (mg kg-1) at 25°C
HCN (AC) 2 2000 - - CN
NaCN 480 g L-1
Mustard (HD) 0.047 900 0.7 0.92 g L-1 2-30 hours TDG
Sarin (GB) 0.0046 70 2 completely 20-40 hours IMPA, MPA
miscible
VX 0.0025 35 0.07 150 g L-1 82 hours DIASH, EMPA,
EA2192, MPA
In order to detect these poisons in water, their properties in water must also be considered, i.e. the solubility, rate of
hydrolysis, and hydrolysis products formed. In the case of cyanide, as HCN, KCN, or NaCN, all of these chemicals
are extremely soluble in water (completely miscible, 716, and 480 g L-1, respectively) [6]. In solution the cyanide](https://image.slidesharecdn.com/finalreportdaad1302c0015part5applp-13347355530702-phpapp01-120418025822-phpapp01/75/Final-Report-Daad13-02-C-0015-Part5-App-L-P-15-2048.jpg)
![Springer Book Kneipp Editor Draft 2
ion is formed in equilibrium with the conjugate acid, HCN (Figure 25.1A), according to the Ka of 6.15x10⁻¹⁰ [7 ]. In
the case of cyanide then it is important to know the pH, if one form of the chemical is to be detected versus the
other. For example, if 2 mg L-1 of NaCN is added to water (the FDWS), then 1.25 mg L-1 of CN- and 0.75 mg L-1 of
HCN will be present.
A
B
C
D
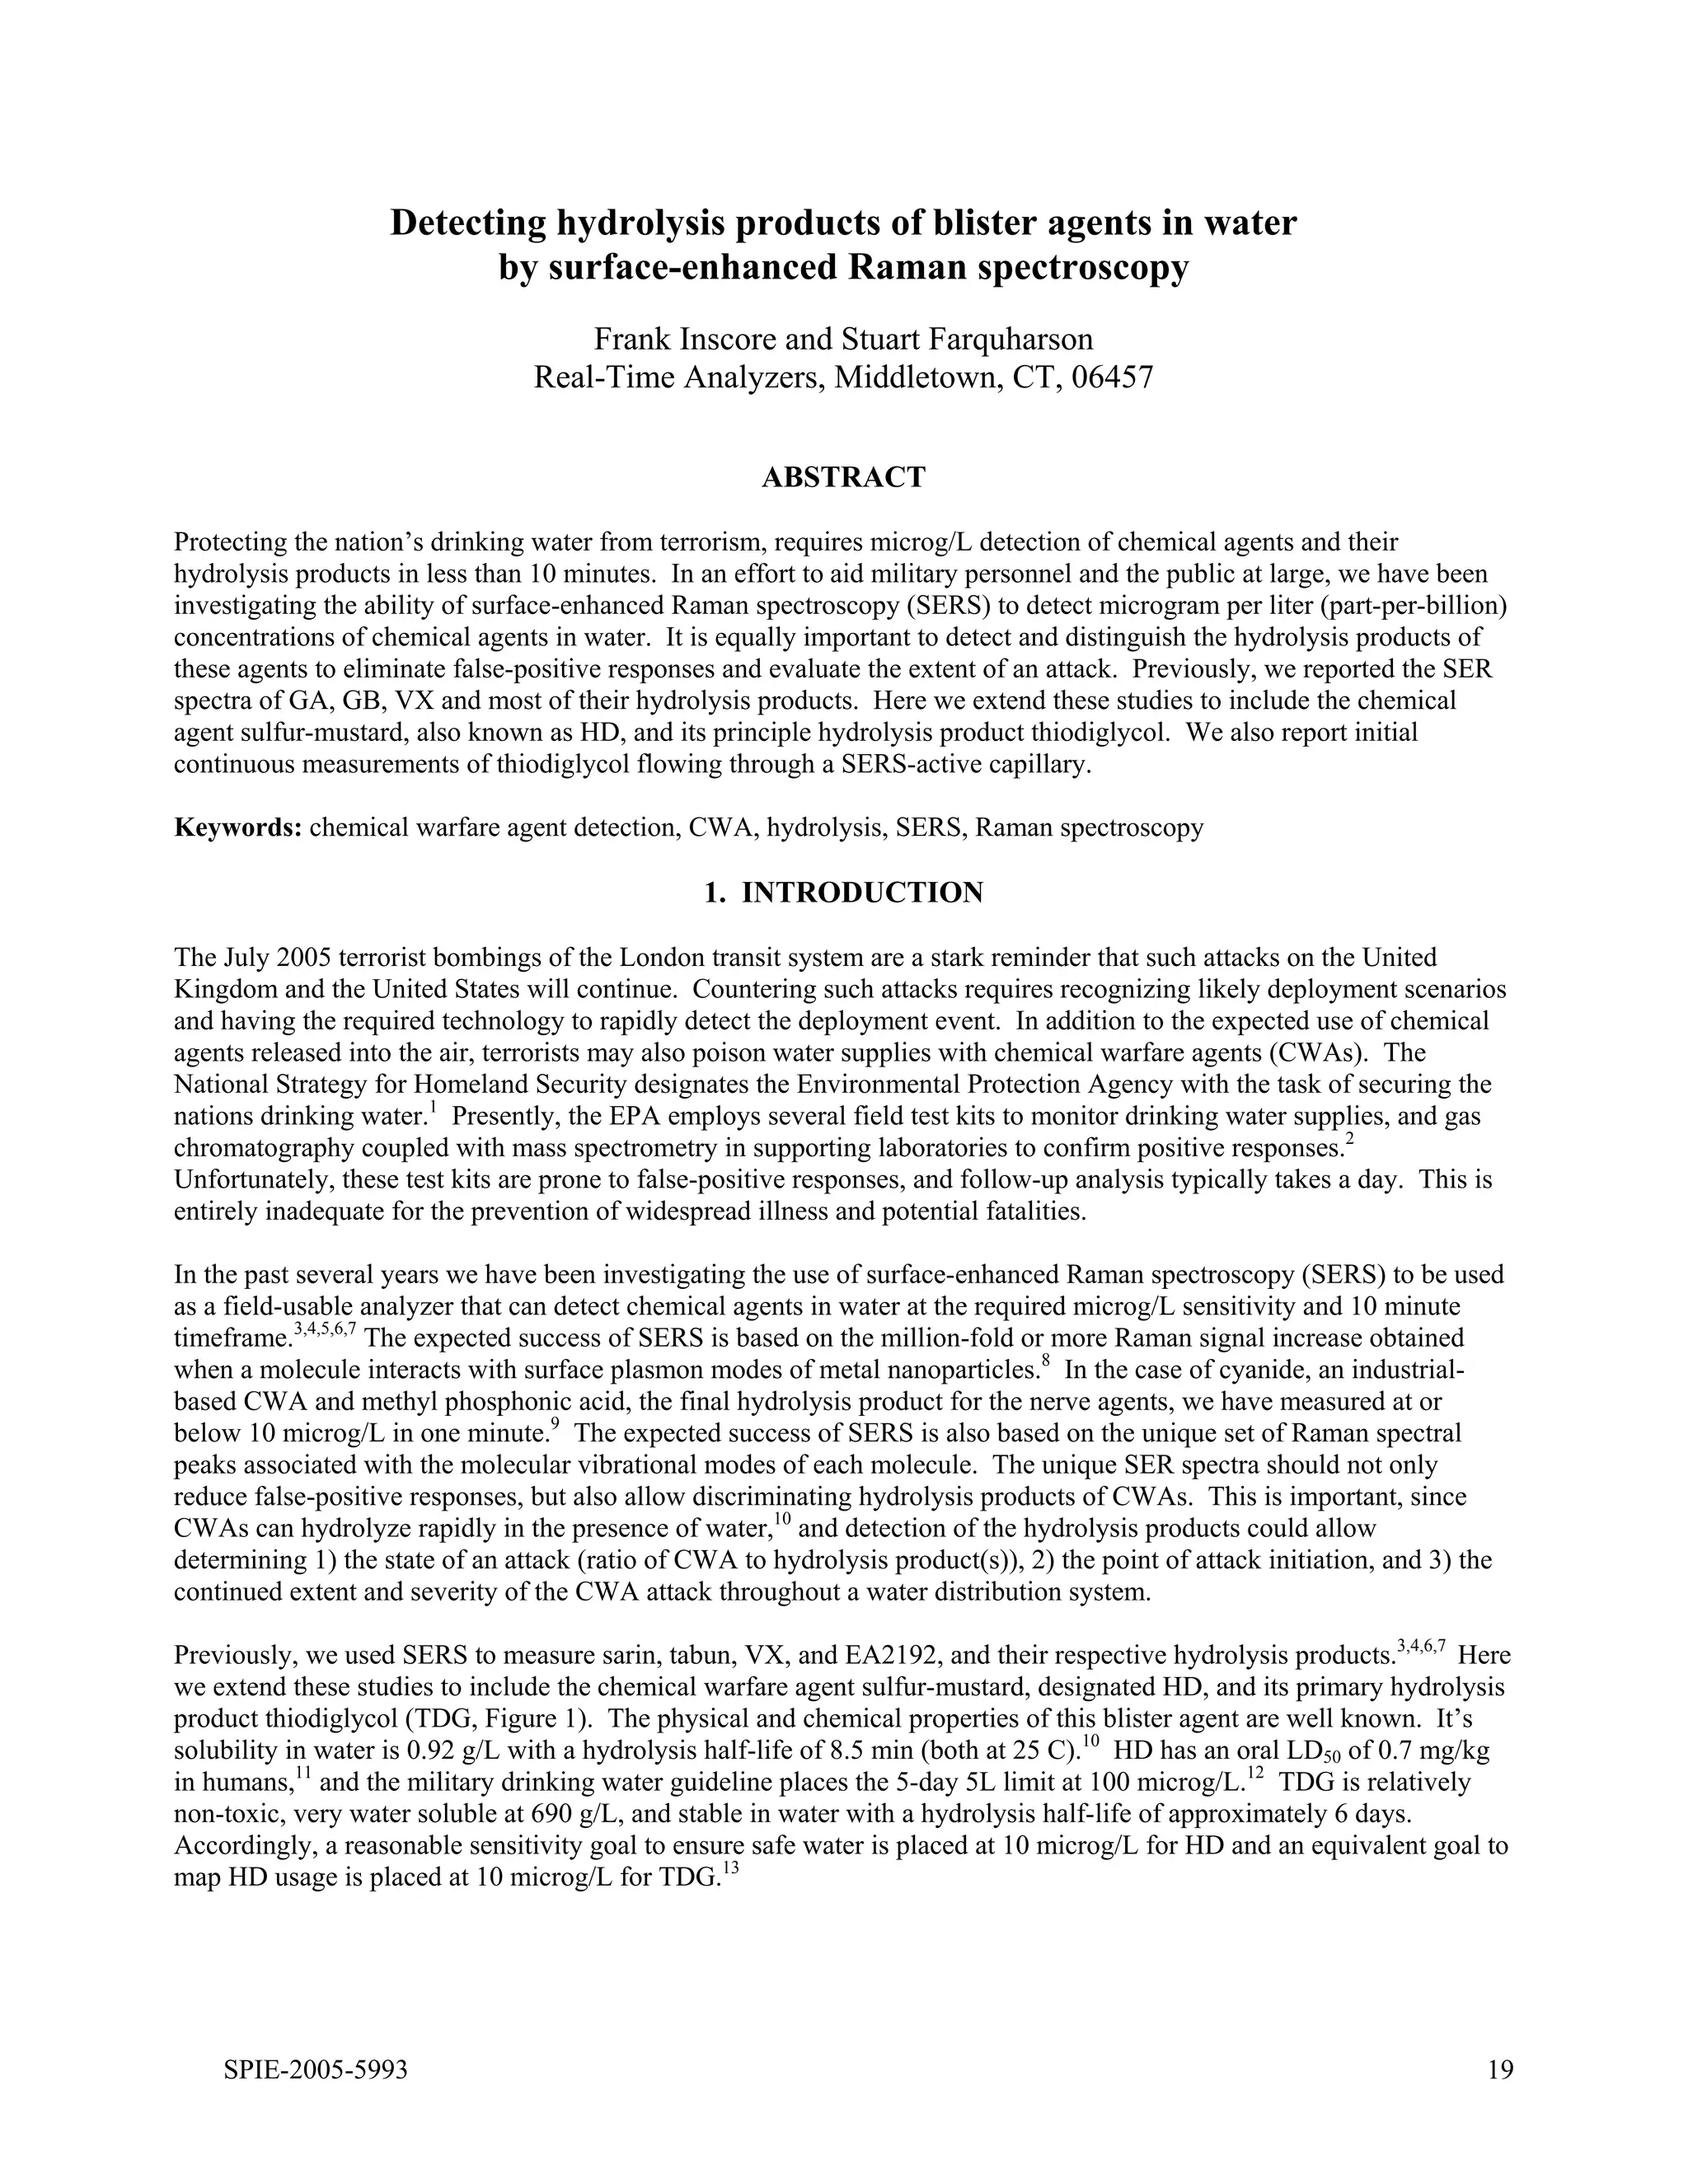
Figure 25.1. Hydrolysis reaction pathways for A) CN, B) HD, C) GB, and D) VX.
In the case of sulfur-mustard, the situation is somewhat more complex. It is marginally soluble in water tending to
form droplets, and hydrolysis occurs at the droplet surface. This property has made measuring the hydrolysis rate
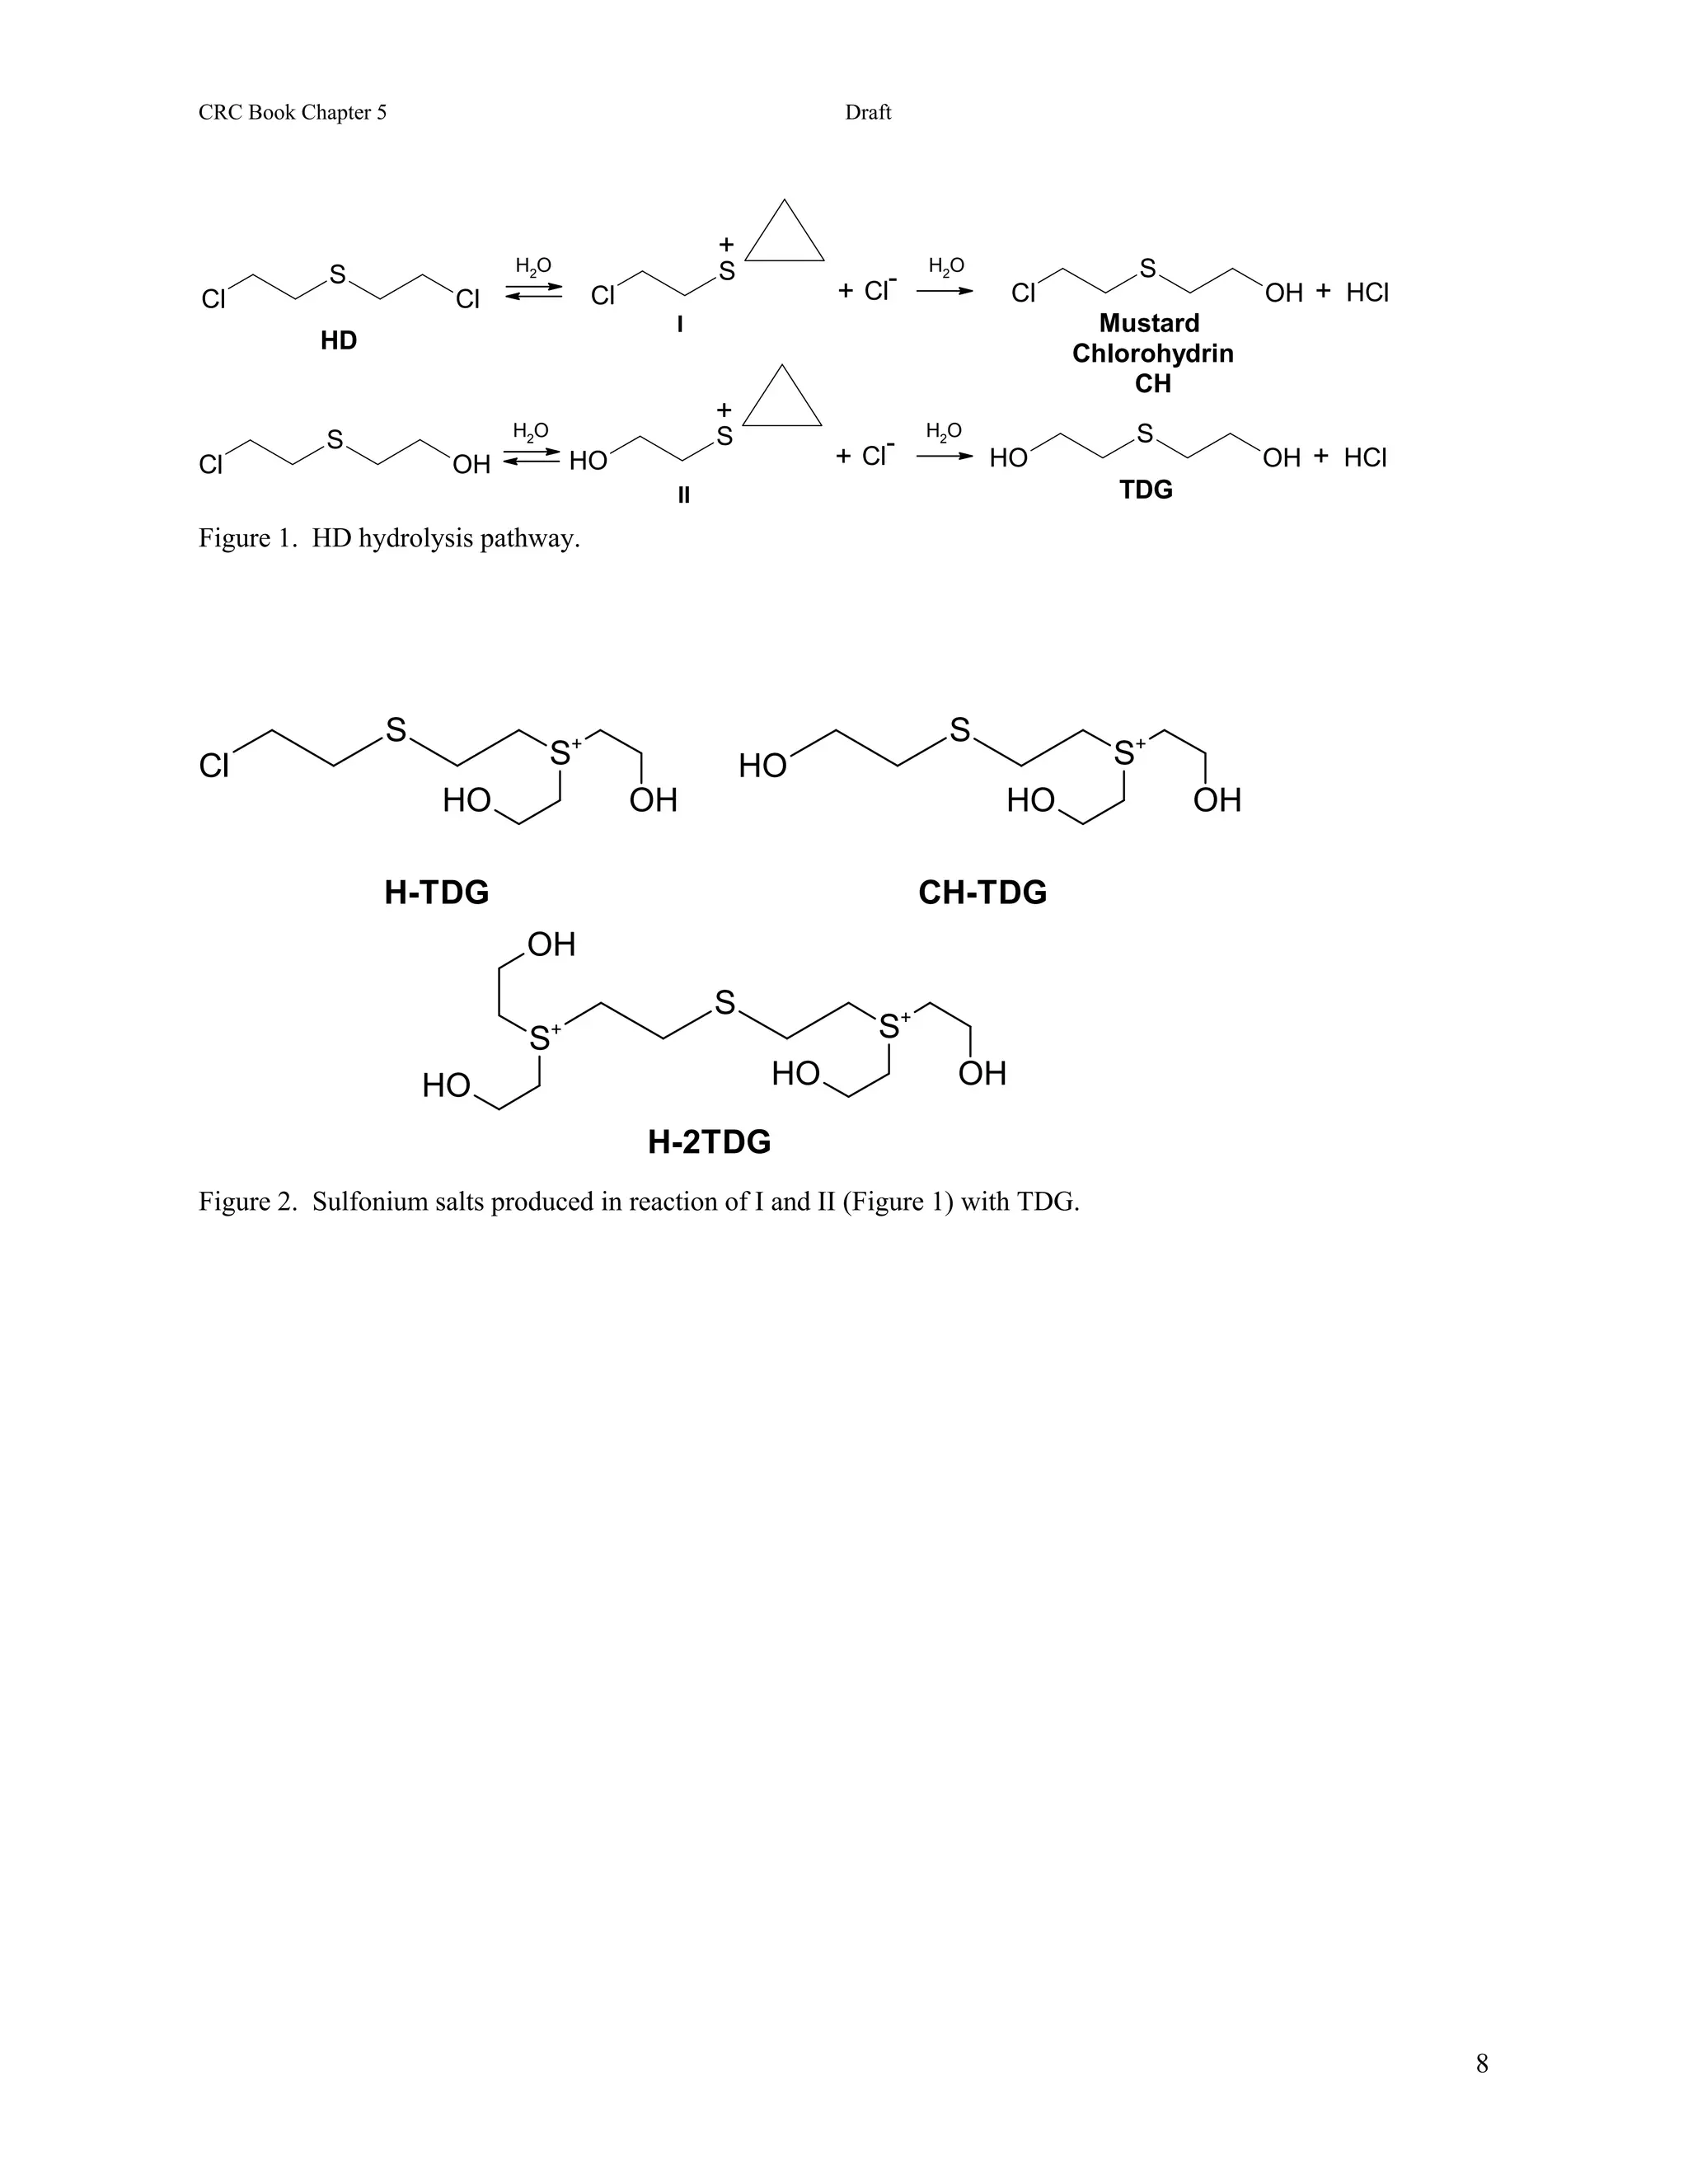
constant difficult, and half-lives anywhere from 2 to 30 hours are reported [8]. Chemically, the hydrolysis of HD
involves the sequential replacement of the chlorine atoms by hydroxyl groups through cyclic sulfonium ion
intermediates to form thiodiglycol (TDG, Figure 25.1B) [9]. If a median hydrolysis rate is assumed, then early
detection of poisoned water will require measuring HD, while post-attack or downstream monitoring will require
measuring TDG. For sarin, the analysis is more straightforward, since it dissolves readily into water and it is stable
for a day or more. In this case, detecting poisoned water will largely require measuring sarin, while monitoring the
attack will require detecting its sequential hydrolysis products, isopropyl methylphosphonic acid (IMPA) and methyl
phosphonic acid (IMPA, MPA, respectively, Figure 25.1C) [8,10,11]. The other hydrolysis products, hydrofluoric
acid and 2-propanol, are too common to provide definitive evidence of water poisoning and their measurement
would be of limited value. VX is reasonably soluble, and like sarin, is fairly persistent with a hydrolysis half-life
greater than 3 days [12]. Unfortunately, one of its hydrolysis products, known as EA2192, is considered just as
toxic as VX, more soluble and more persistent in water [13]. Consequently, detecting the early stages of poisoning
water should focus on measuring VX, while longer term monitoring should focus on EA2192.
The earliest technologies developed for CWA detection were based on electrochemical, ionization, or colorimetric
analysis. Examples of the latter include phosgene, M8 and M9 tape, which change color when in contact with a
sample like pH paper. Although these tapes are easy to use, they are not generally agent specific and suffer from a
high percentage of false-positives [14]. For example, M8 changes color when in contact with common solvents such
as acetonitrile, ethanol, methanol, or common petroleum products such as brake fluid, lighter fluid, or WD-40 [15].
More rigorous laboratory methods have been successfully developed to detect chemical agents with minimum false-
positive responses. More than a decade ago, Black et al. demonstrated the ability of combining gas chromatography](https://image.slidesharecdn.com/finalreportdaad1302c0015part5applp-13347355530702-phpapp01-120418025822-phpapp01/75/Final-Report-Daad13-02-C-0015-Part5-App-L-P-16-2048.jpg)
![Springer Book Kneipp Editor Draft 3
with mass spectrometry detection (GC/MS) to measure sarin and mustard [16]. Sega at al. used GC with a
phosphorous-selective flame ionization detector to analyze nerve agent hydrolysis products in groundwater [17],
while several researchers used capillary electrophoresis (CE) to measure chemical warfare agents and their
hydrolysis products [18,19,20]. The sensitivity of these techniques has improved by two orders of magnitude from 1
mg L-1 to 0.01 mg L-1 in 10 years. A comprehensive development of these techniques was undertaken by Creasy et
al. in analyzing chemical weapon decontamination waste from the Johnston Atoll [11,21]. These researchers used
GC/MS for nerve agents, GC coupled atomic emission detection for arsenic compounds, LC/MS for mustard
compounds, and CE with ultraviolet absorption detection for alkyl phosphonic acids. Detection limits of 0.02 and
0.140 mg L-1 were reported for nerve agents and mustard, respectively. Detection of the alkyl phosphonic acids
have proven more difficult, and Liu, Hu and Xie recently used GC/MS to detect mg L-1 concentrations of these
degradation products [22]. However, they concede that all of these separation methods require extraction,
derivatization, and repeated column calibration, making them labor intensive, time consuming (typically 30 to 60
minutes), and less than desirable for field use. Another variant of these separation/mass detection technologies is ion
mobility spectrometry (IMS) [23]. This technology has been successfully developed to measure explosives in air
samples, and commercial products can be found at most airports [24]. Eiceman et al. have investigated the ability of
IMS to measure organophosphorous compounds in air [25], while Steiner et al. have investigated IMS to measure
chemical agent simulants in water [26]. In the latter case, electrospray ionization was coupled to the sample entry
point of an IMS, and a time-of-flight MS was added as an orthogonal detector. Water samples spiked with 10 mg
L-1 diisopropylmethylphosponate and thiodiglycol could be measured in 1-min, once sample pretreatment was
accomplished. It is worth noting that with proper care these MS-based technologies are likely to detect chemical
agents with virtually no false-positives, but detection limits are still insufficient by 1 to 2 orders of magnitude in the
case of nerve agents and their hydrolysis products.
More rapid analysis of agents in the solid, liquid and gas phase has been demonstrated by vibrational spectroscopy
[27-31]. Hoffland et al. reported infrared absorbance spectra and absolute Raman cross sections for several
chemical agents [27], while Christesen measured Raman cross sections for sarin, tabun, mustard gas, and VX [28].
Again, however these technologies also have limitations. Raman spectroscopy is simply not a very sensitive
technique, and detection limits are typically 0.1% (1000 ppm). And infrared spectroscopy would have limited value
in analyzing poisoned water, since the very strong infrared absorption of water would obscure most other chemicals
present. Nevertheless, efforts to overcome these limitations have been demonstrated. Braue and Pannella quantified
the G-series nerve agents (tabun, sarin, and soman) in terms of infrared attenuated total reflectance using a circle-
cell [29].
Enormous improvements in sensitivity for Raman spectroscopy can be achieved through surface-enhancement [32].
The interaction of surface plasmon modes of metal particles with target analytes can increase scattering efficiency
by as much 14-orders of magnitude, although 6-orders of magnitude are more common. The details of surface-
enhanced Raman spectroscopy (SERS) can be found in the beginning of this book. The utility of SERS to measure
chemical agents was first demonstrated by Alak and Vo-Dinh by measuring several organophosphonates as
simulants of nerve agents on a silver-coated microsphere substrate [33]. Spencer, et al. used SERS to measure
cyanide, MPA, HD and EA2192 on electrochemically roughed gold or silver foils [34,35,36]. However, in all of
these measurements, the sample needed to be dried on the substrates to obtain the best sensitivity (e.g. 0.05 mg L-1
for MPA). More recently, Tessier et al. obtained SERS of 0.04 mg L-1 cyanide in a stream flowing over a substrate
formed by a templated self-assembly of gold nanoparticles [37]. However, optimum sensitivity required
introduction of an acid wash and the measurements were irreversible.
In the past few years, we have also been investigating the ability of SERS to measure chemical agents at 0.001 mg
L-1 in water and with sufficient spectral uniqueness to distinguish the agent and its hydrolysis products [38-43]. In
our work, we have developed silver-doped sol-gels as the SERS-active medium. These sol-gels can be coated on the
inside walls of glass vials, such that water samples can be added to perform point-analysis, or they can be
incorporated into glass capillaries, such that flowing measurements can be performed [44]. Here, both sampling
devices were used to measure and compare SER spectra of AC, HD, VX and several of their hydrolysis products,
TDG, EA2192, EMPA, and MPA. In addition, a field-usable Raman analyzer was used to measure 0.01 mg L-1
cyanide flowing in water with a detection time of less than 1-min.](https://image.slidesharecdn.com/finalreportdaad1302c0015part5applp-13347355530702-phpapp01-120418025822-phpapp01/75/Final-Report-Daad13-02-C-0015-Part5-App-L-P-17-2048.jpg)
![Springer Book Kneipp Editor Draft 4
25.2 EXPERIMENTAL
Sodium cyanide, 2-hydroxyethylethyl sulfide (HEES), 2-chloroethylethyl sulfide (CEES) and methylphosphonic
acid (MPA) were purchased from Sigma-Aldrich (St. Louis, MO) and used as received. Ethyl methylphosphonic
acid (EMPA), isopropyl methylphosphonic acid (IMPA), 2-(diisopropylamino) ethanethiol (DIASH), and
thiodiglycol (TDG, bis(2-hydroxyethyl)sulfide) were purchased from Cerilliant (Round Rock, TX). Highly distilled
sulfur mustard (HD, bis(2-chloroethyl)sulfide), isopropyl methylphosphonofluoridate (GB), ethyl S-2-
diisopropylamino ethyl methylphosphonothioate (VX), and ethyl S-2-diisopropylamino methylphosphonothioate
(EA2192) were obtained at the U.S. Army’s Edgewood Chemical Biological Center (Aberdeen, MD) and measured
on-site. All samples were initially prepared in a chemical hood as 1000 parts-per-million (1 g L-1 or 0.1% by
volume, Environmental Protection Agency definition) in HPLC grade water (Fischer Scientific, Fair Lawn, NJ) or in
some cases methanol or ethanol (Sigma-Aldrich) to minimize hydrolysis.
Once prepared, the samples were transferred into 2-ml glass vials internally coated with a silver-doped sol-gel
(Simple SERS Sample Vials, Real-Time Analyzers, Middletown, CT) or drawn by syringe or pump into 1-mm
diameter glass capillaries filled with the same SERS-active material [45,46,47]. In the case of flow measurements, a
peristaltic pump (variable flow mini-pump, Control Co., Friendswood, TX) was used to flow the various cyanide
solutions through a SERS-active capillary at 1 mL min-1. The vials or capillaries were placed on aluminum plates
machined to hold the vials or capillaries on a standard XY positioning stage (Conix Research, Springfield, OR),
such that the focal point of an f/0.7 aspheric lens was positioned just inside the glass wall. The probe optics and
fiber optic interface have been described previously [40]. SER spectra were collected using a Fourier transform
Raman spectrometer equipped with a 785 nm diode laser and a silicon photo-avalanche detector (IRA-785, Real-
Time Analyzers). All spectra were nominally collected using 100 mW, 8 cm-1 resolution, and 1-min acquisition
time, unless otherwise noted. Complete experimental details can be found in Reference 48. For added safety, all
samples were measured in a chemical hood. In the case of actual agents measured at Edgewood, the FT-Raman
instrument was placed outside the laboratory and 30 foot fiber optic and electrical cables were used to allow remote
SERS measurements and plate manipulation.
25.3 RESULTS AND DISCUSSION
25.3.1 Cyanide. Sodium cyanide completely dissolves in water forming the ions in equilibrium with the conjugate
acid, HCN as described above. Concentrations of 1.0, 0.1, and 0.01 mg L-1 result in CN- concentrations of 0.52,
0.016, and 0.00021 mg L-1 as the corresponding pH decreases from just above the pKa of 9.21 at 9.24 to 8.48 and
7.54. This is significant in that only CN- appears to interact sufficiently with silver to produce a SER spectrum, and
no spectral signal is observed below pH 7 (except on electrodes at specific potential conditions [49]). The SER
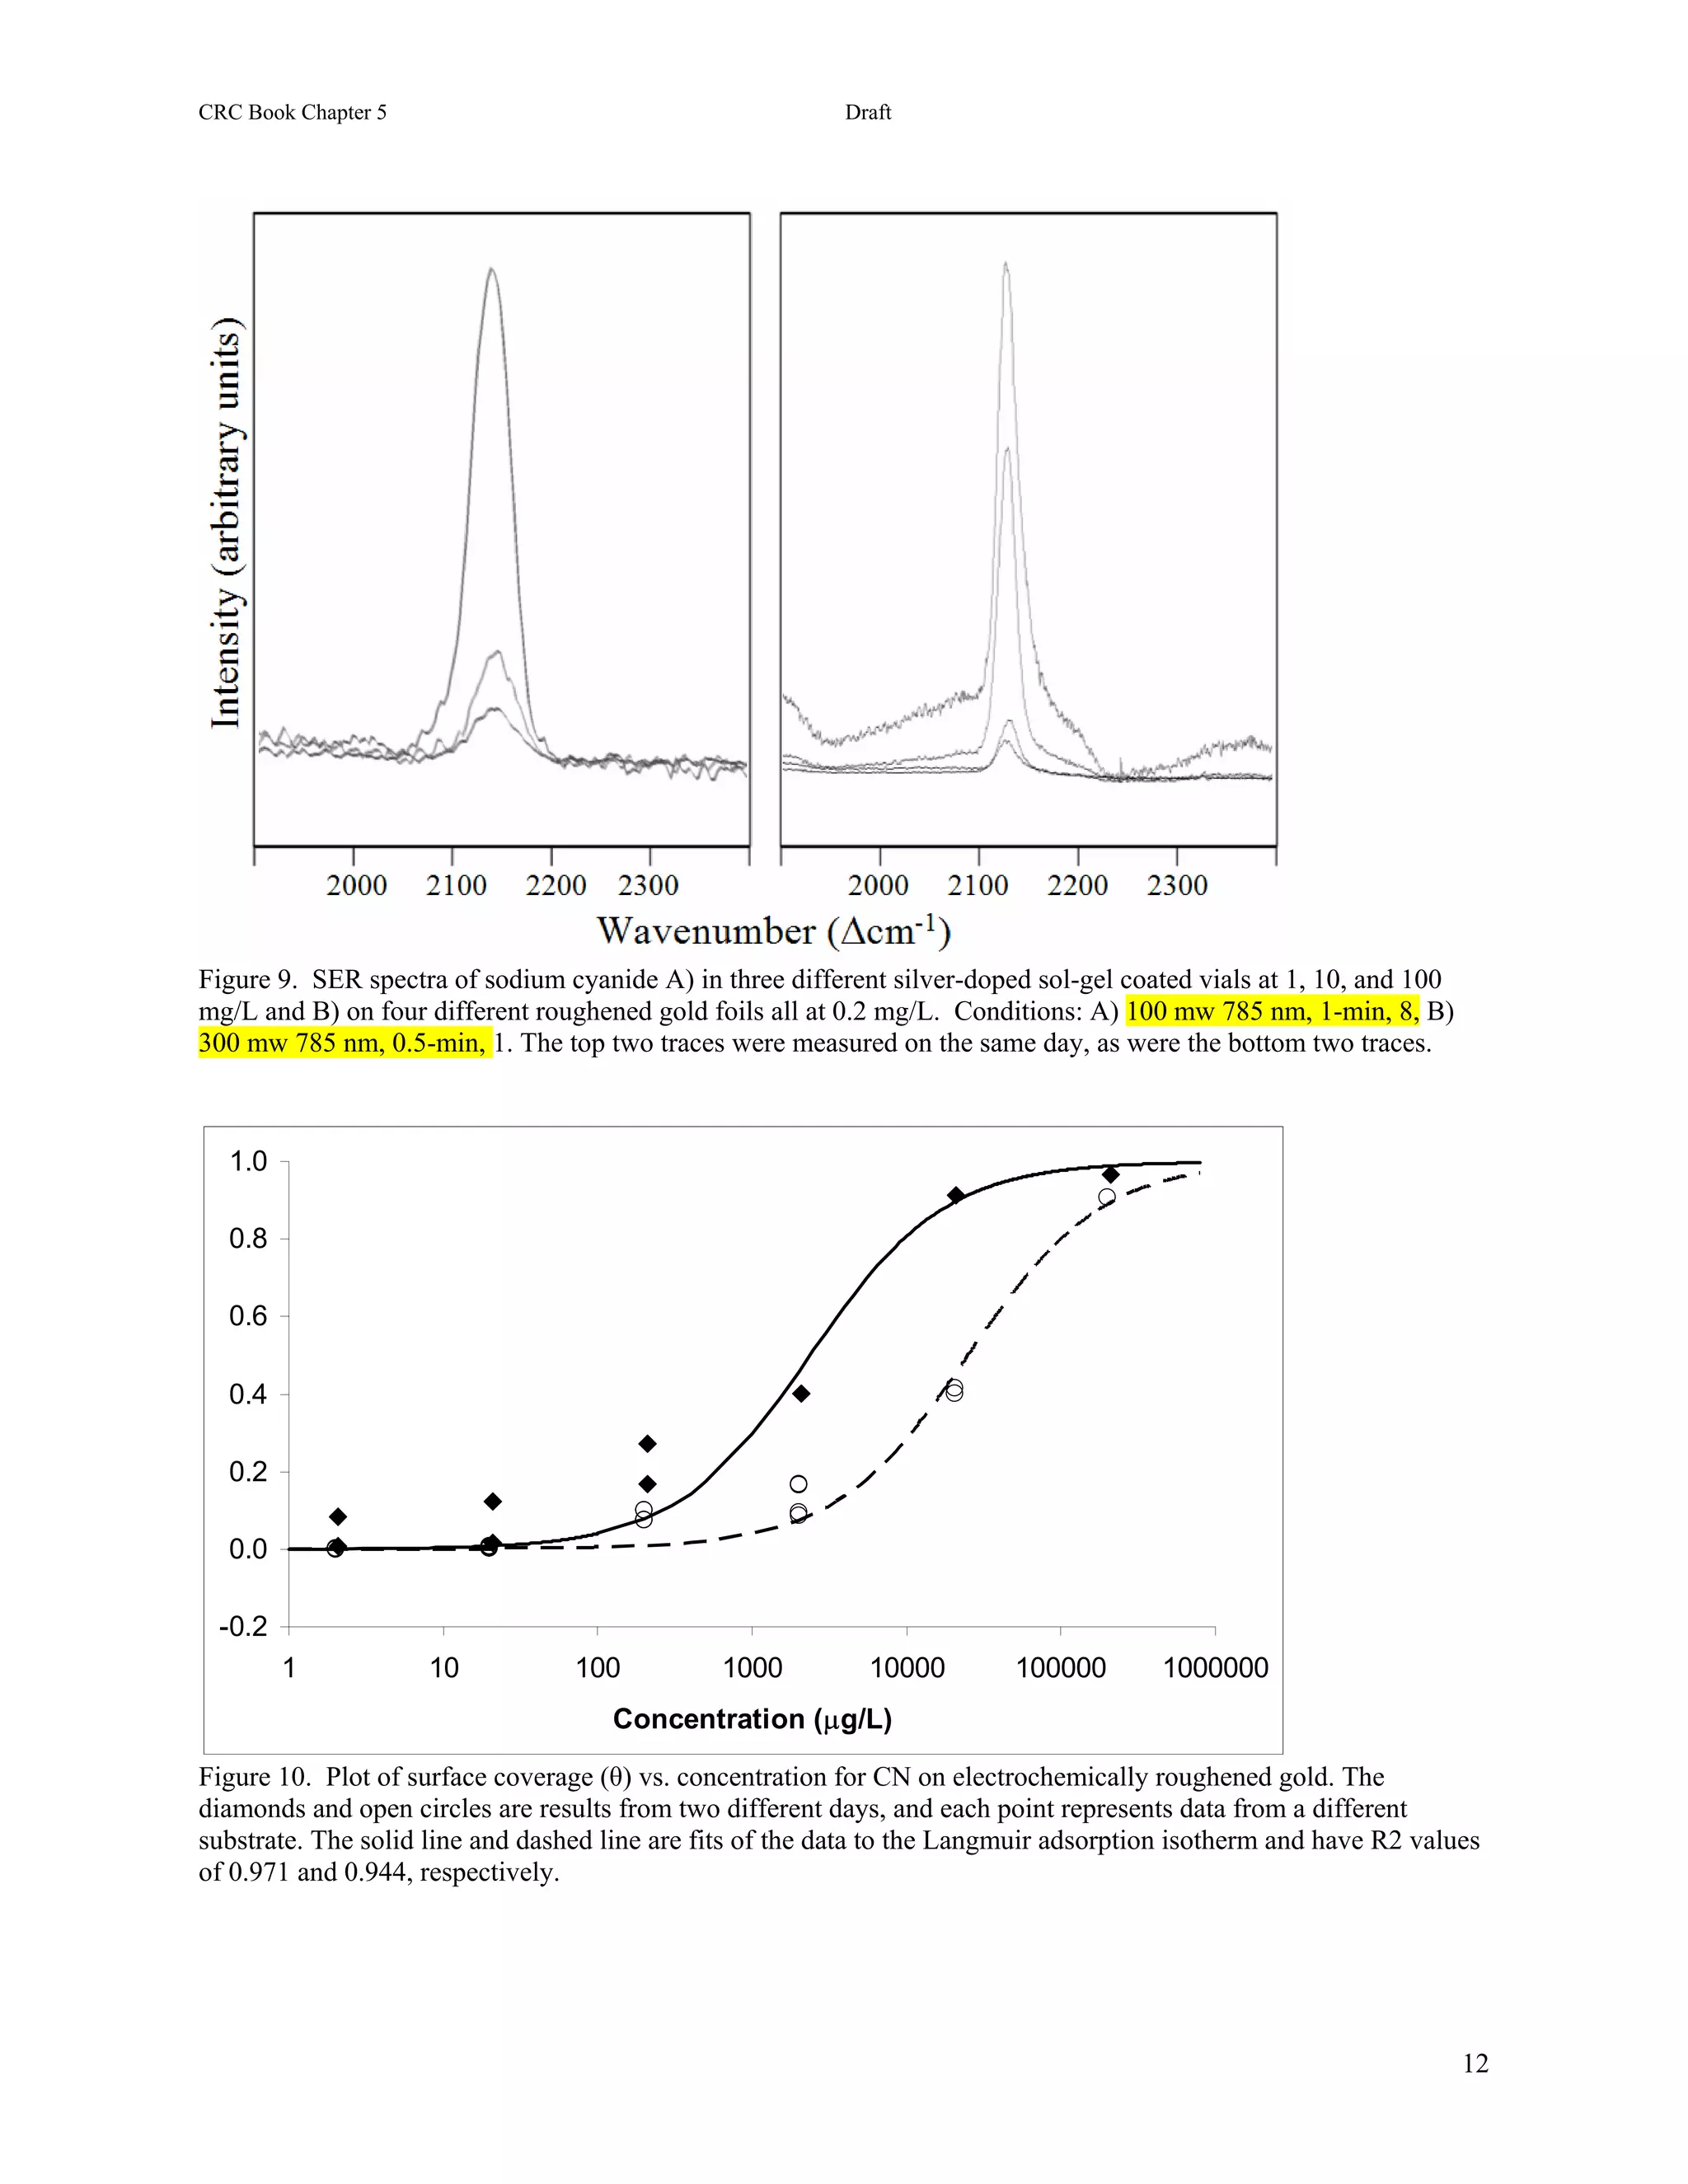
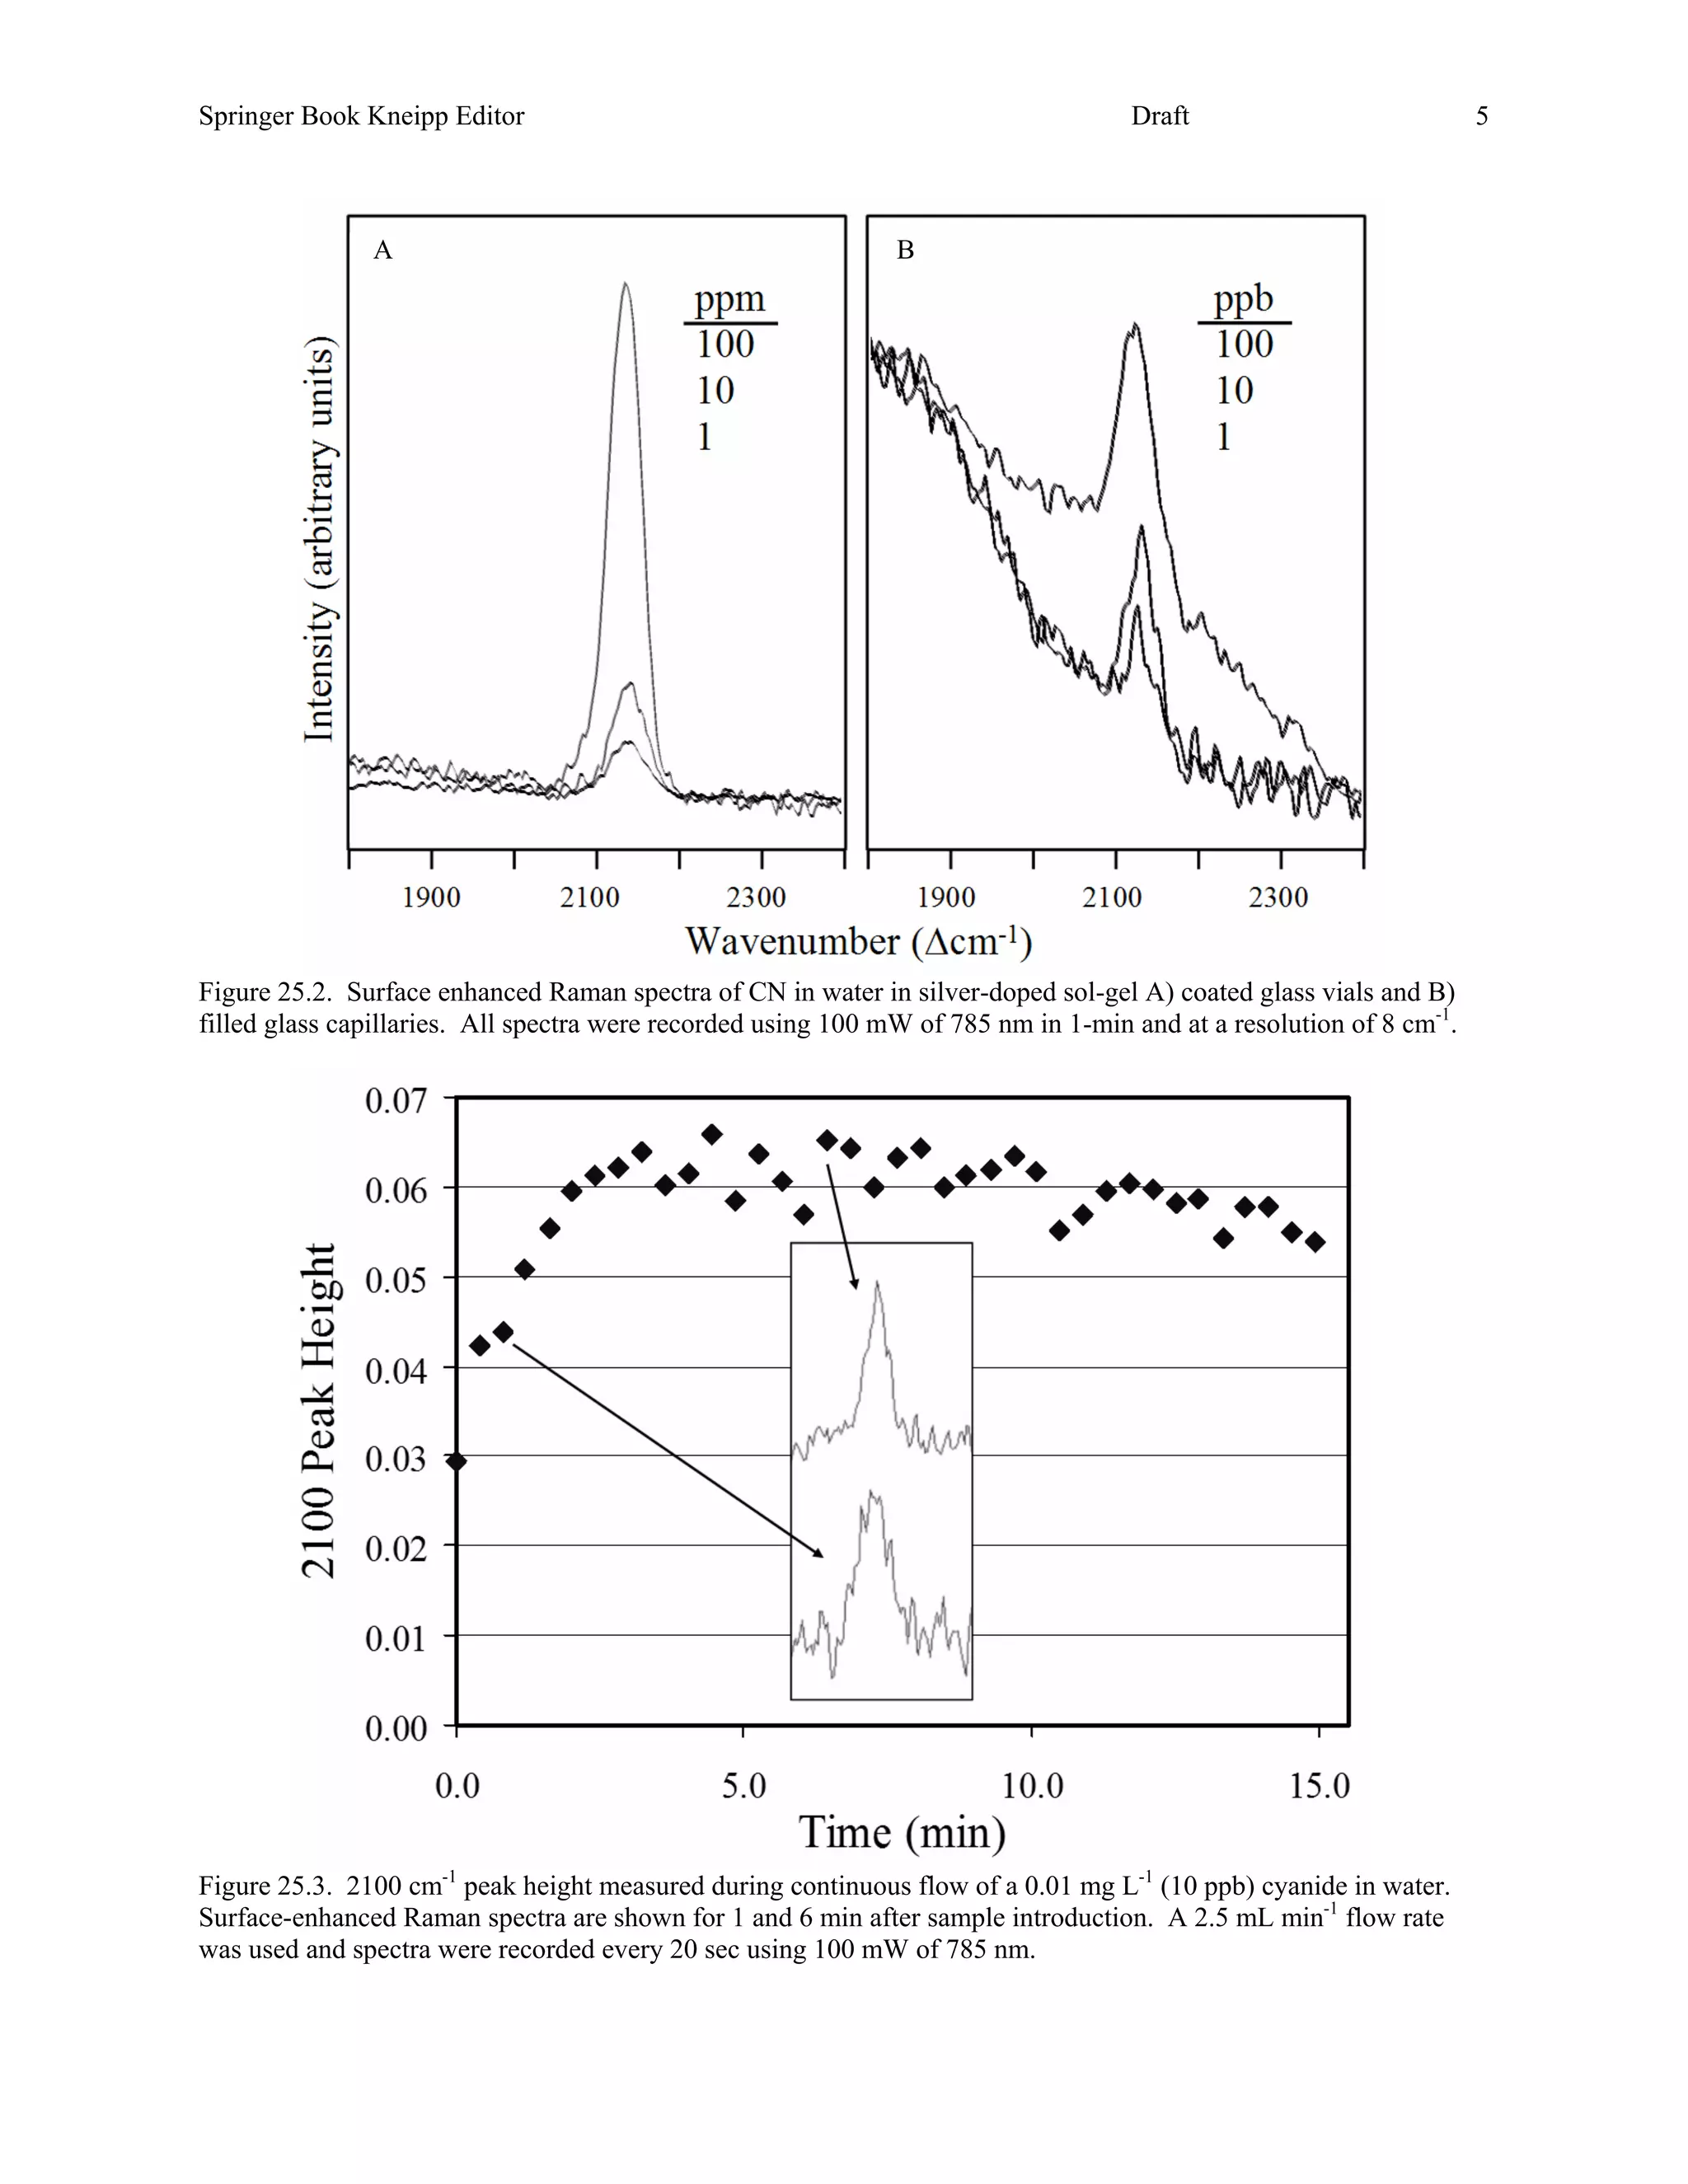
spectra of cyanide are dominated by an intense, broad peak at 2100 cm-1 attributed to the C≡N stretch (Figure 25.2).
This mode occurs at 2080 cm-1 in Raman spectra of solutions, and the frequency shift in SER spectra is attributed to
a strong surface interaction, which is supported by the appearance of a low frequency peak at 135 cm-1 due to a Ag-
CN stretch (not shown). It is also observed that as the concentration decreases, the CN peak shifts to 2140 cm-1.
This shift has been attribute to the formation of a tetrahedral Ag(CN)32- surface structure [50], as well as to CN
adsorbed to two different surface sites [51]. Alternatively, it has also been suggested that at concentrations near and
above monolayer coverage, the CN- species is forced to adsorb end-on due to crowding, and at lower concentrations
the molecule can reorient to lie flat. This suggests that the 2100 and 2140 cm-1 peaks correspond to the end-on and
flat orientations, respectively. However, a previous concentration study of cyanide on a silver electrode observed
the reverse trend, i.e. greater intensity was observed for the 2100 cm-1 peak at low concentration [49].
Repeated measurements of cyanide in the SERS-active vials consistently allowed measuring 1 mg L-1 (1 ppm), but
rarely below this concentration (Figure 25.2A). Nevertheless, this sensitivity is in general sufficient for point
sampling of water supplies. In the case of continuous monitoring of water, the capillaries are a more appropriate
sampling format, and they also allowed routine measurements at 0.01 mg L-1 and repeatable measurements at 0.001
mg L-1 (1 ppb, Figure 25.2B). Employing this format, a 50 mL volume of 0.01 mg L-1 cyanide solution was flowed
at 2.5 mL min-1 through a SERS-active capillary, and spectra were recorded every 20 seconds. As Figure 25.3
shows, the cyanide peak was easily discerned as soon as the solution entered the capillary and remained relatively
stable over the course of the experiment. It is worth noting, as indicated above, that the SERS peak in Figure 25.3 is
in fact due to 210 ng L-1!](https://image.slidesharecdn.com/finalreportdaad1302c0015part5applp-13347355530702-phpapp01-120418025822-phpapp01/75/Final-Report-Daad13-02-C-0015-Part5-App-L-P-18-2048.jpg)
![Springer Book Kneipp Editor Draft 6
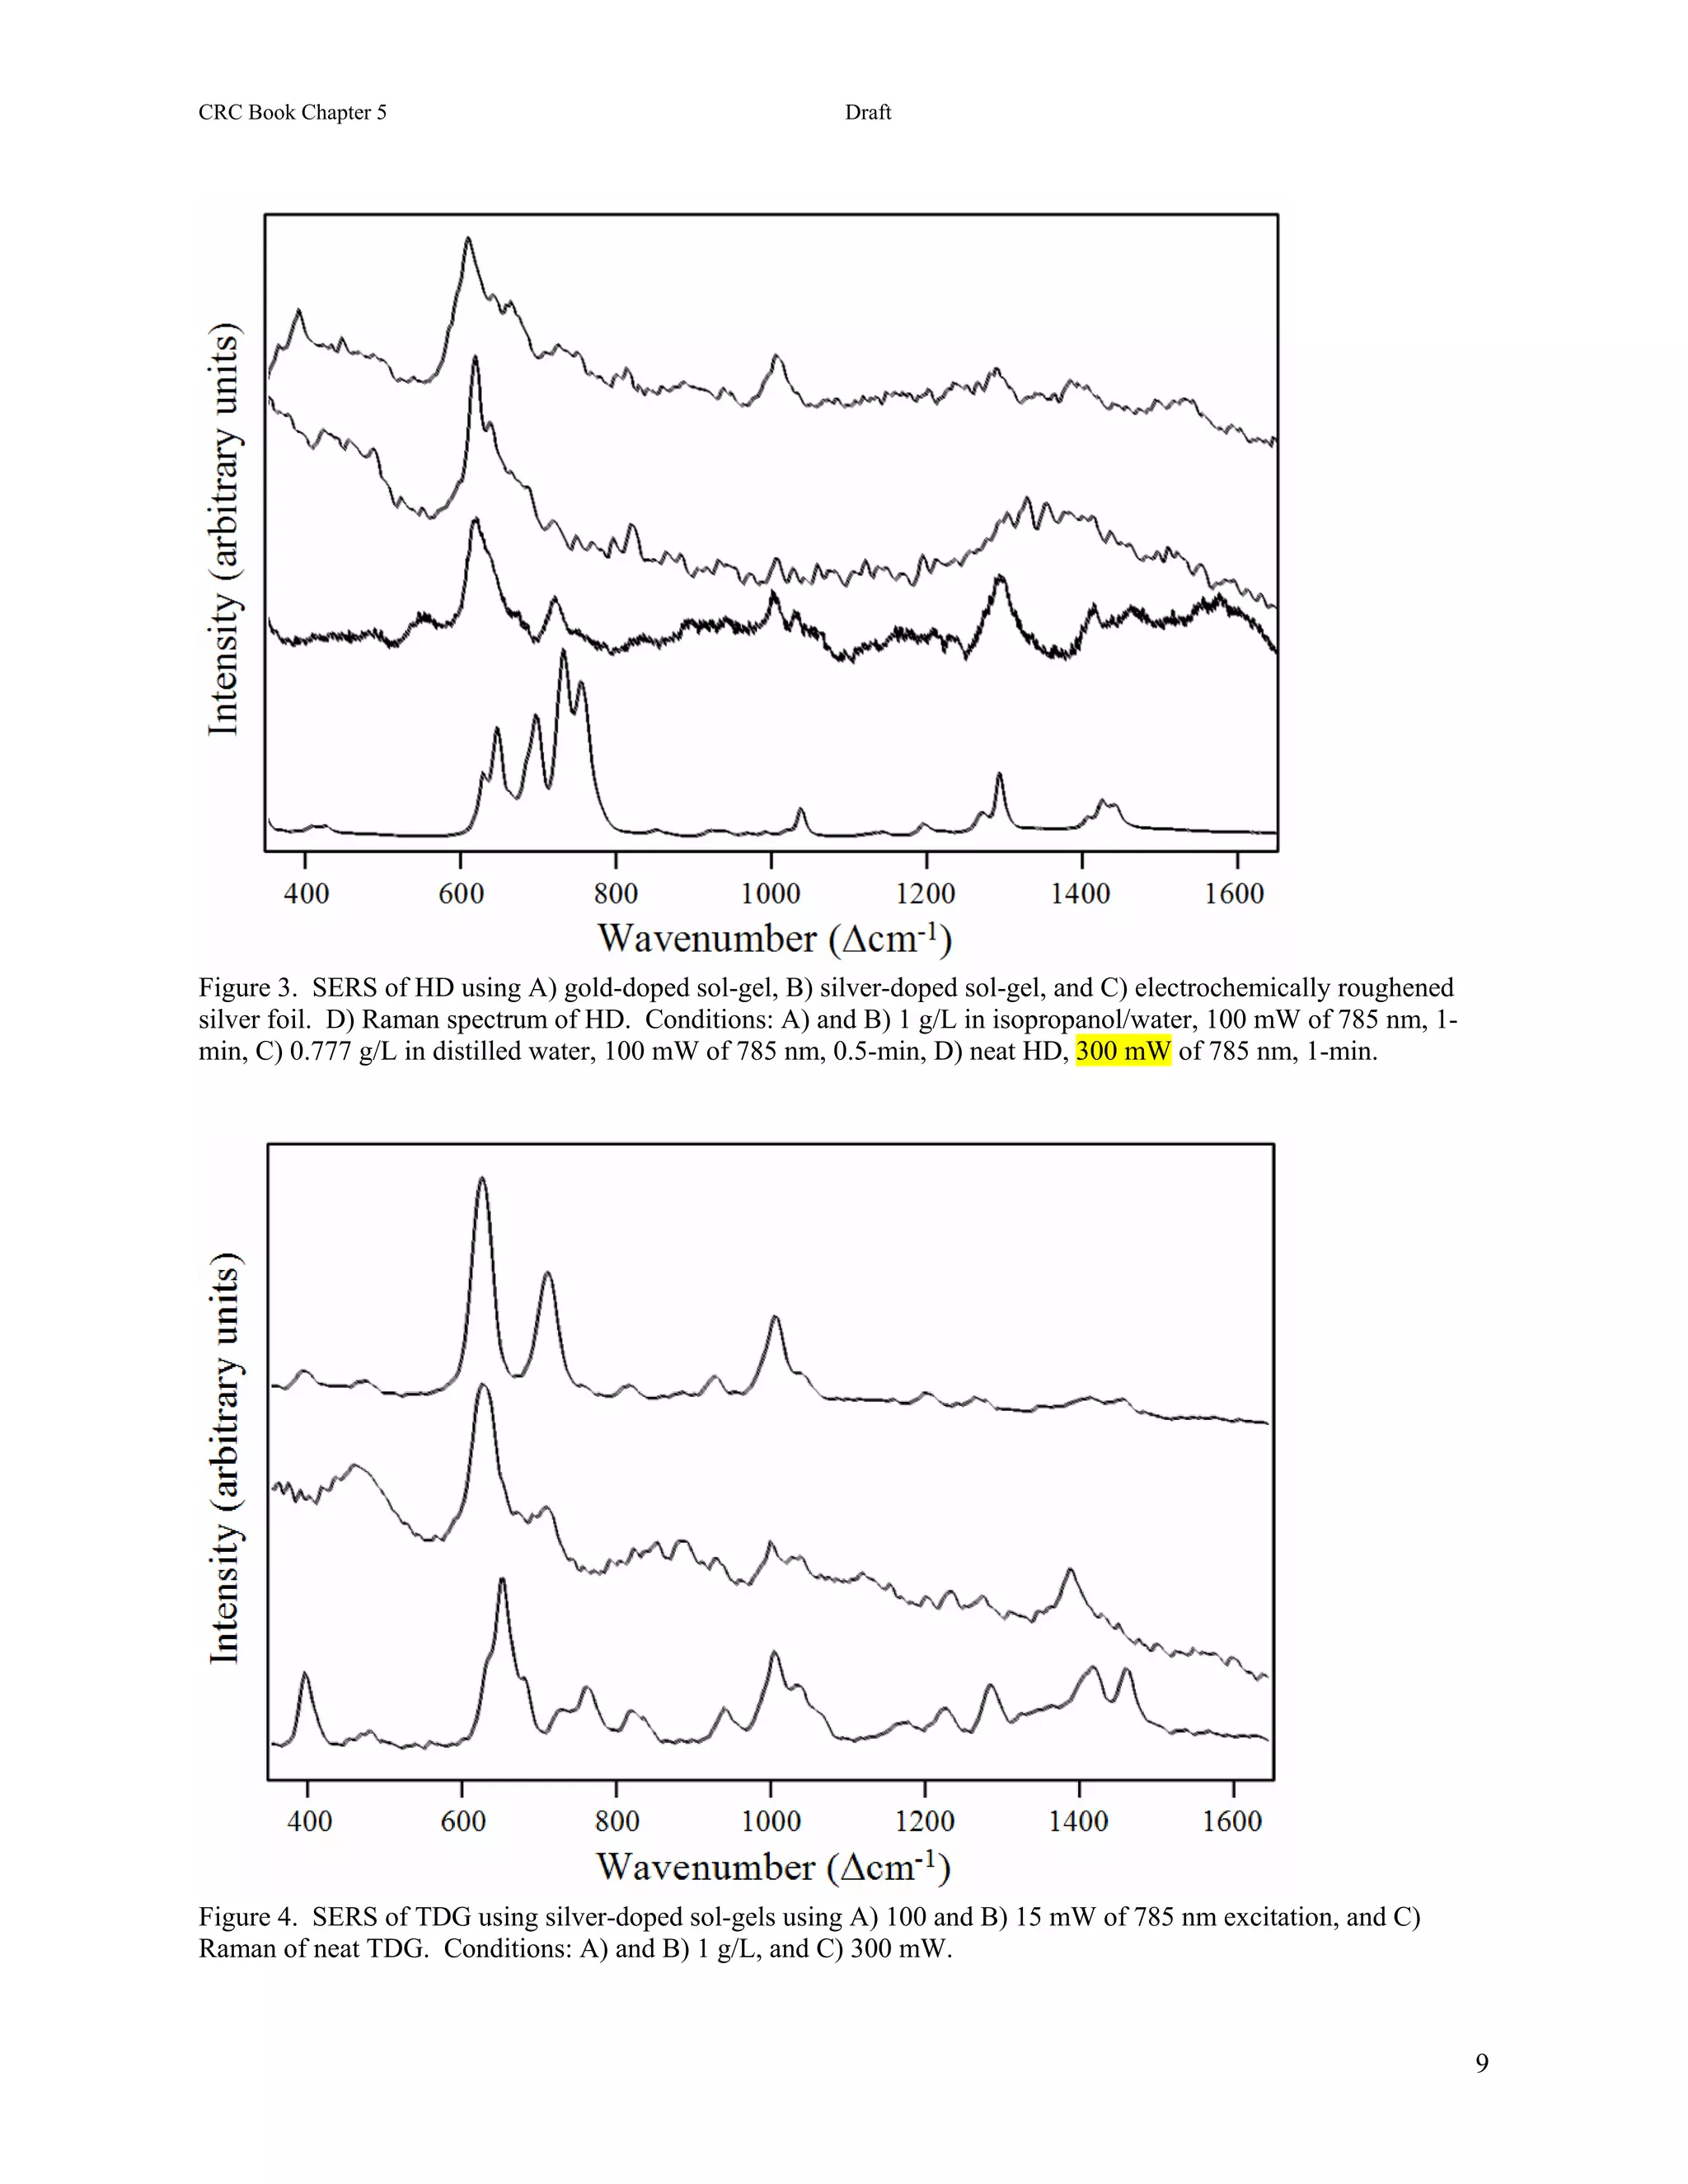
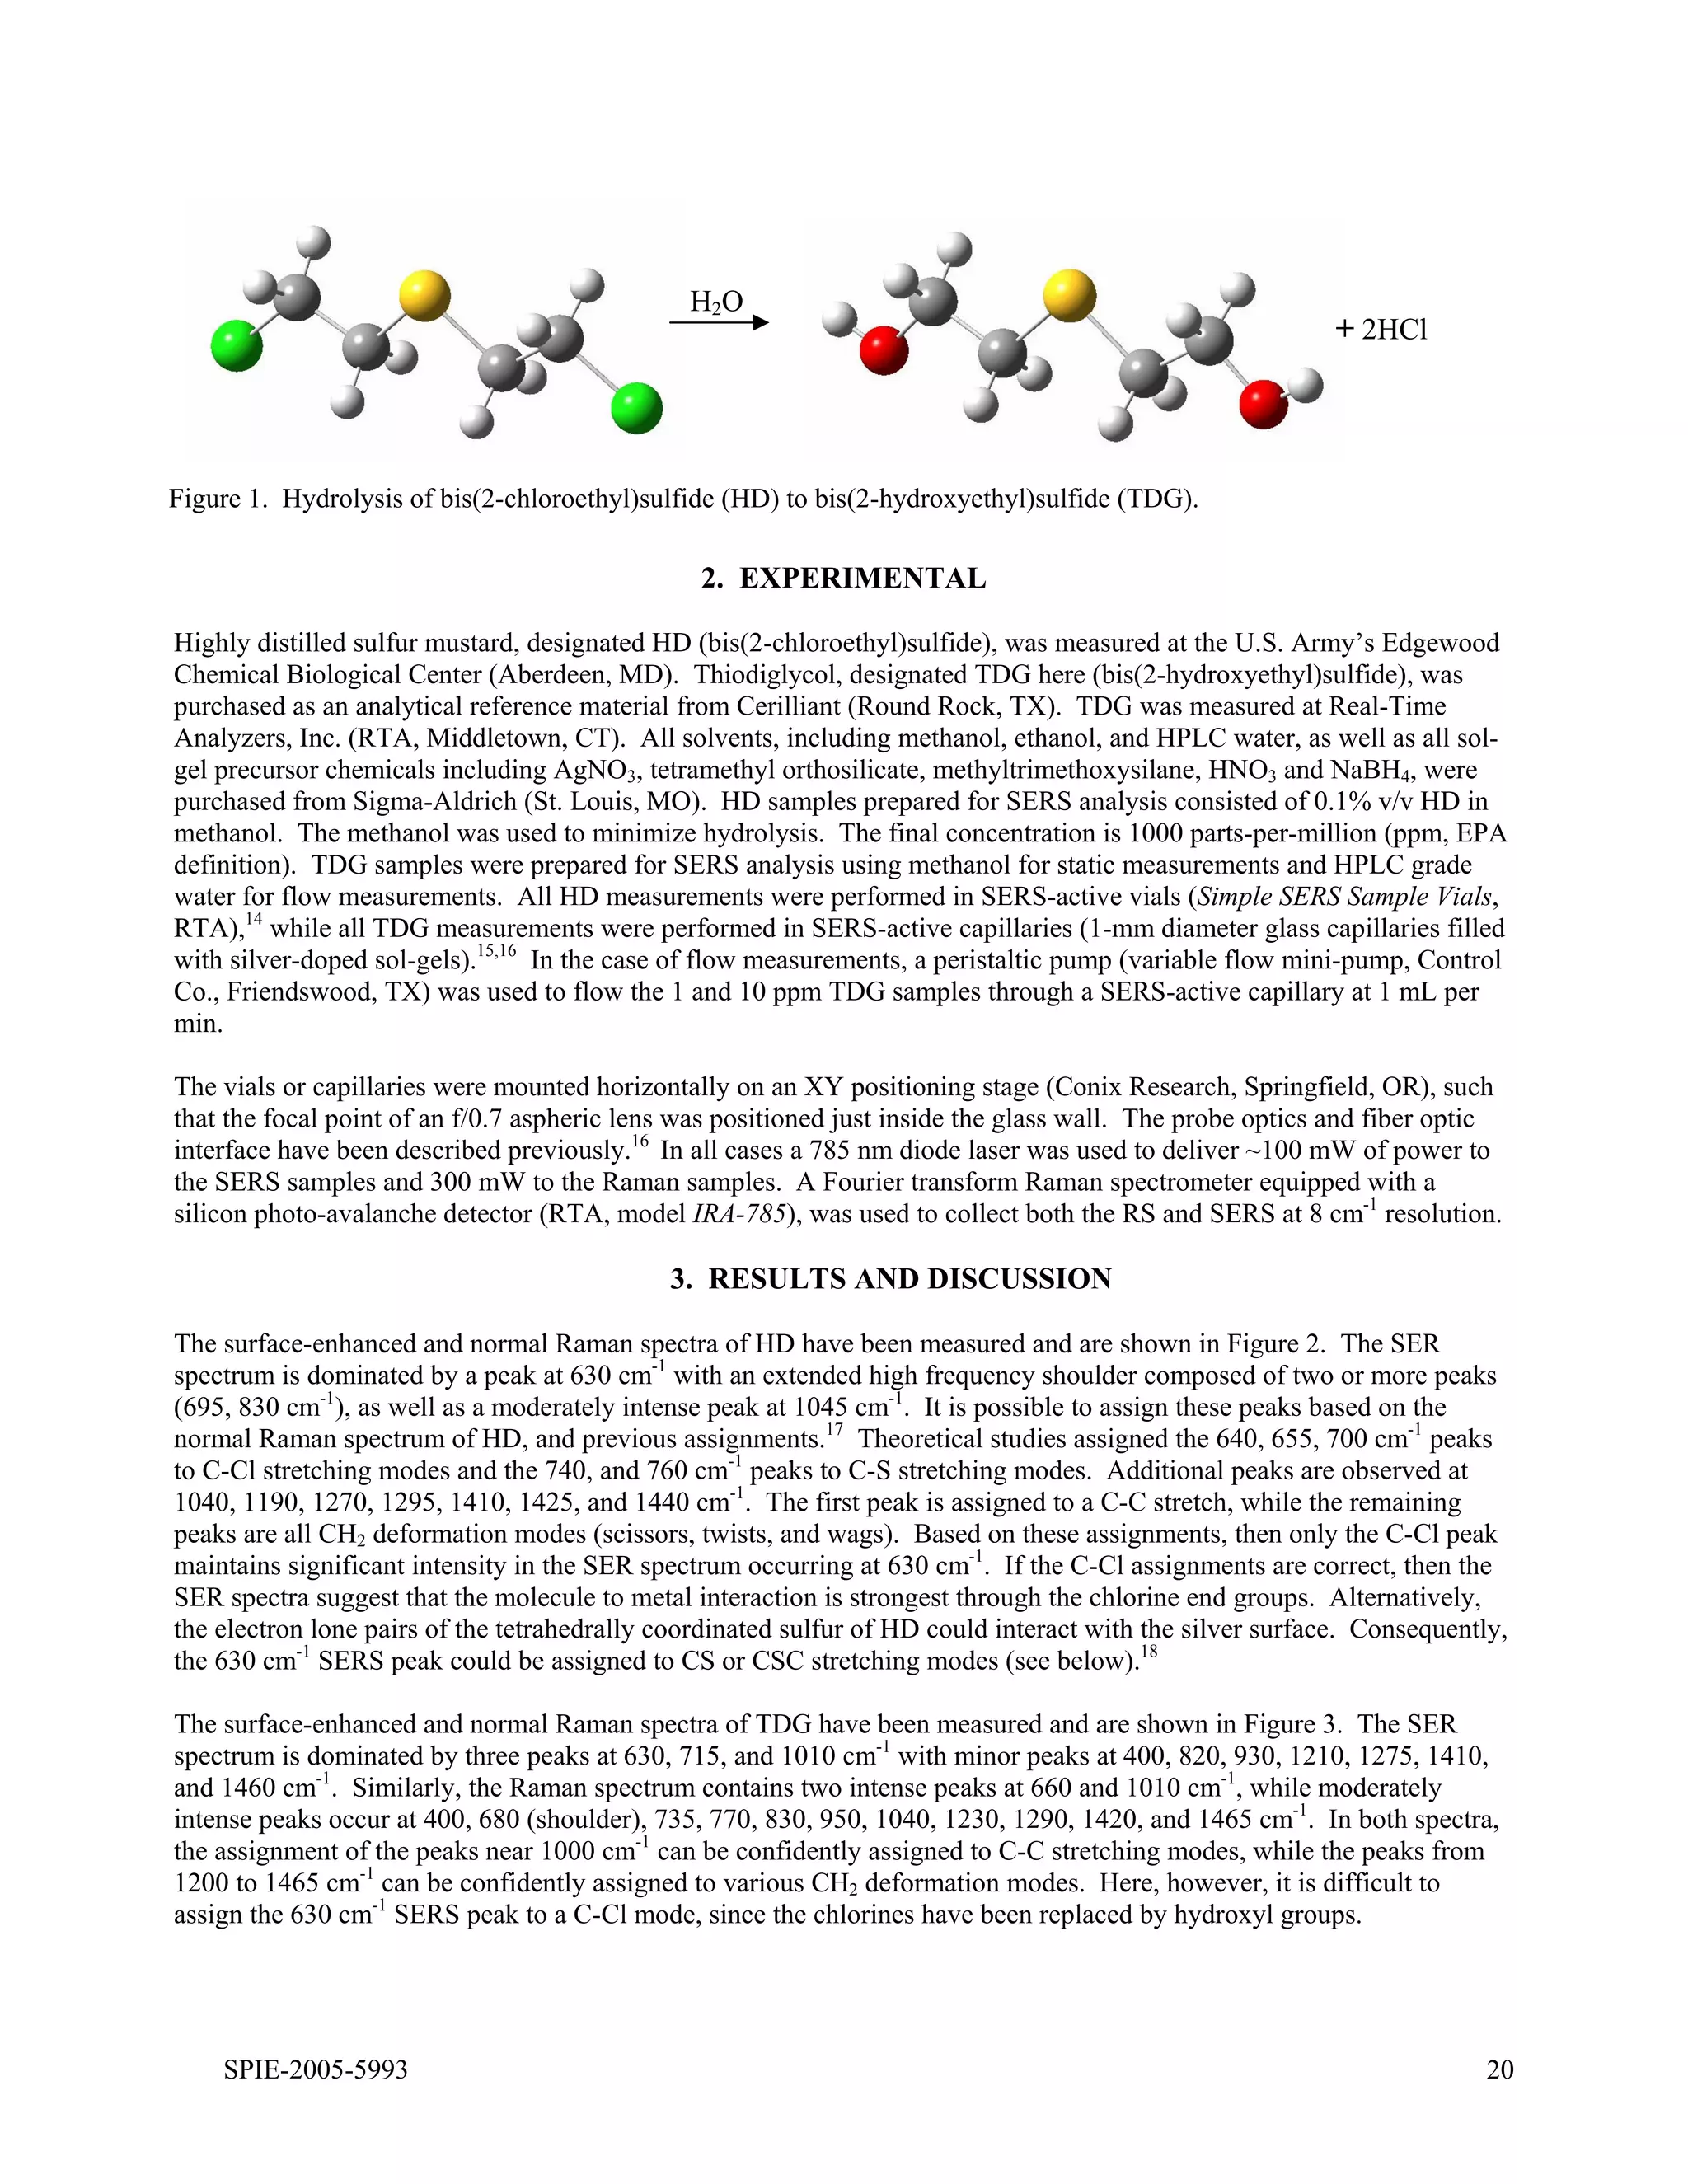
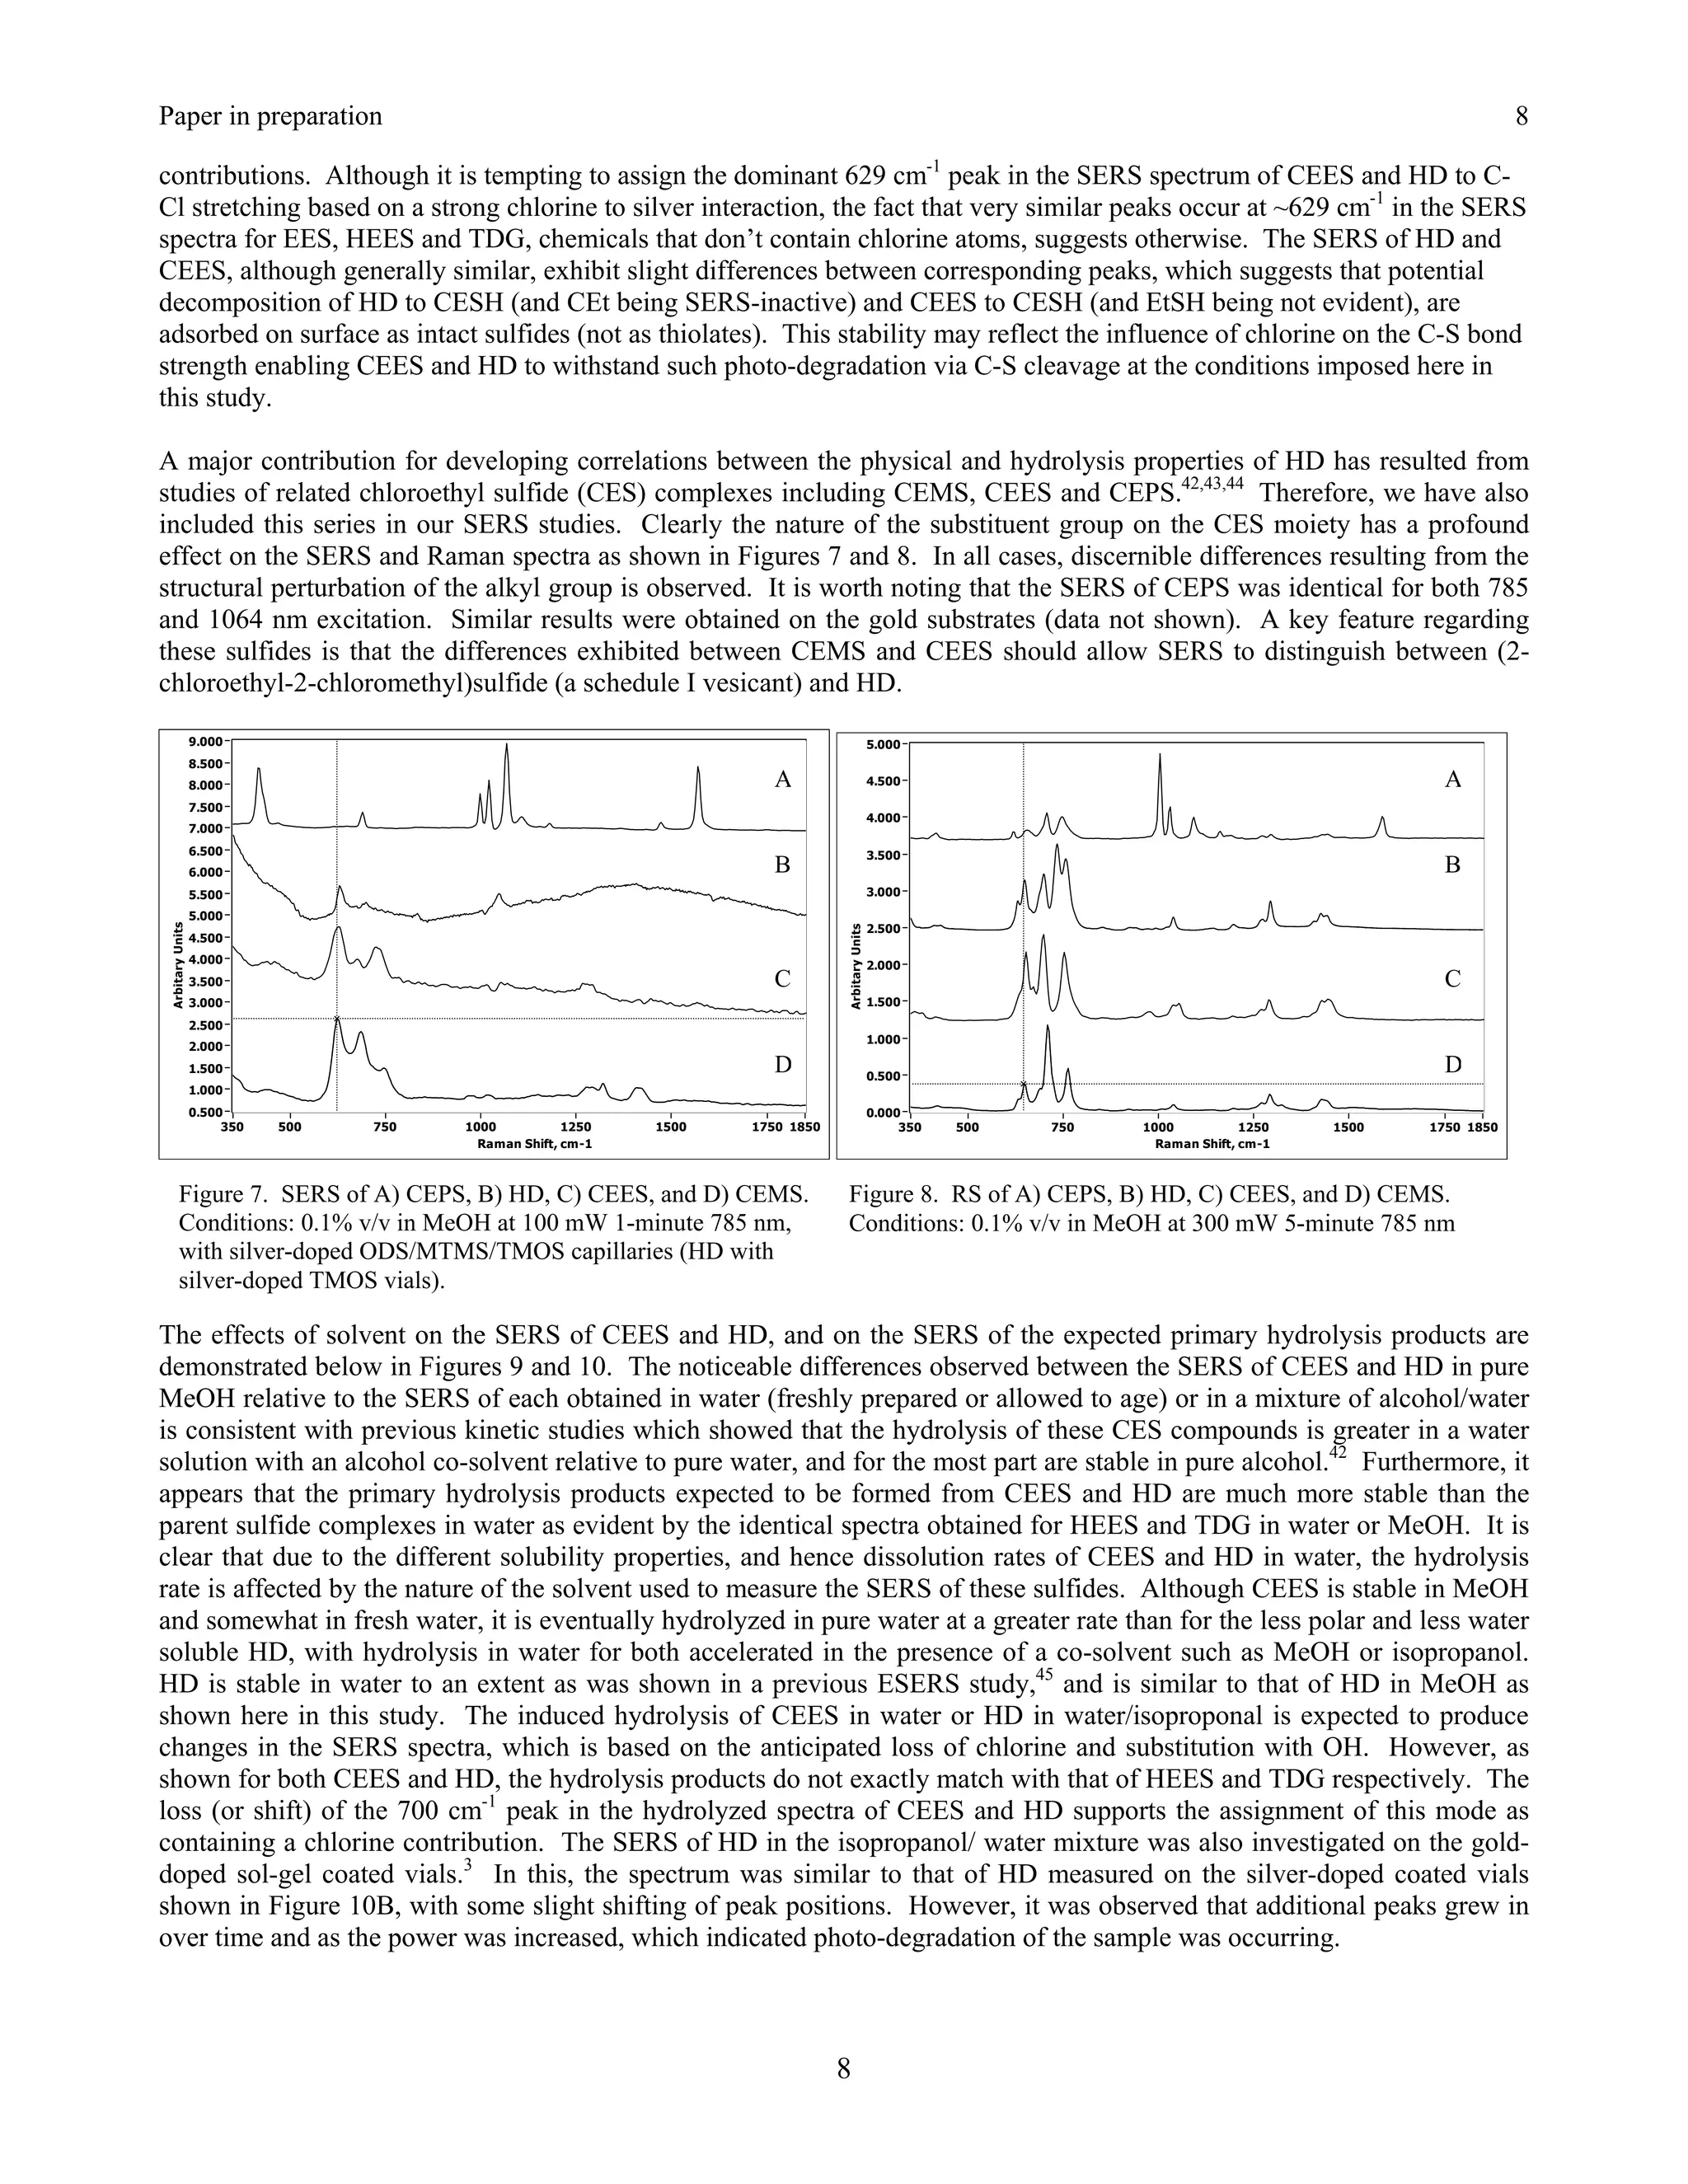
25.3.2 HD and CEES. The surface-enhanced Raman spectrum of HD is dominated by a peak at 630 cm-1 with an
extended high frequency shoulder composed of at least two peaks evident at 695 and 830 cm-1, as well as a
moderately intense peak at 1045 cm-1 (Figure 25.4A). The latter peak is assigned to a CC stretching mode, based on
the assignment for a peak at 1040 cm-1 in the Raman spectrum of HD [52]. The assignment of the 630 cm-1 peak is
less straightforward, since the Raman spectrum of HD contains five peaks in this region at 640, 655, 700, 740, and
760 cm-1 [40,52]. Theoretical calculations for the Raman spectrum of HD indicate that the first three peaks are due
to CCl stretching modes, and the latter two peaks to CS stretching modes [53]. Based on these calculations, and the
expected interaction between the chlorine atoms and the silver surface, it is reasonable to assign the 630 cm-1 SERS
peak to a CCl mode [40]. However, recent SERS measurements of diethyl sulfide produced a very simple spectrum
with an intense peak at 630 cm-1 [54,55], strongly suggesting CS or CSC stretching modes as the appropriate
assignment for this peak [56]. The authors of the theoretical treatment concede that the CCl and CS assignments
could be reversed [53]. The CS assignment also indicates that HD interacts with the silver surface through the sulfur
electron lone pairs. But, interaction between chlorine and silver is still possible and may be responsible for the 695
cm-1 peak. The 830 cm-1 peak is left unassigned.
A
B
Figure 25.4. Surface-enhanced Raman spectra of A) HD in methanol and B) TDG in water. Spectral conditions as
in Fig. 25.2, samples were 1 g L-1.
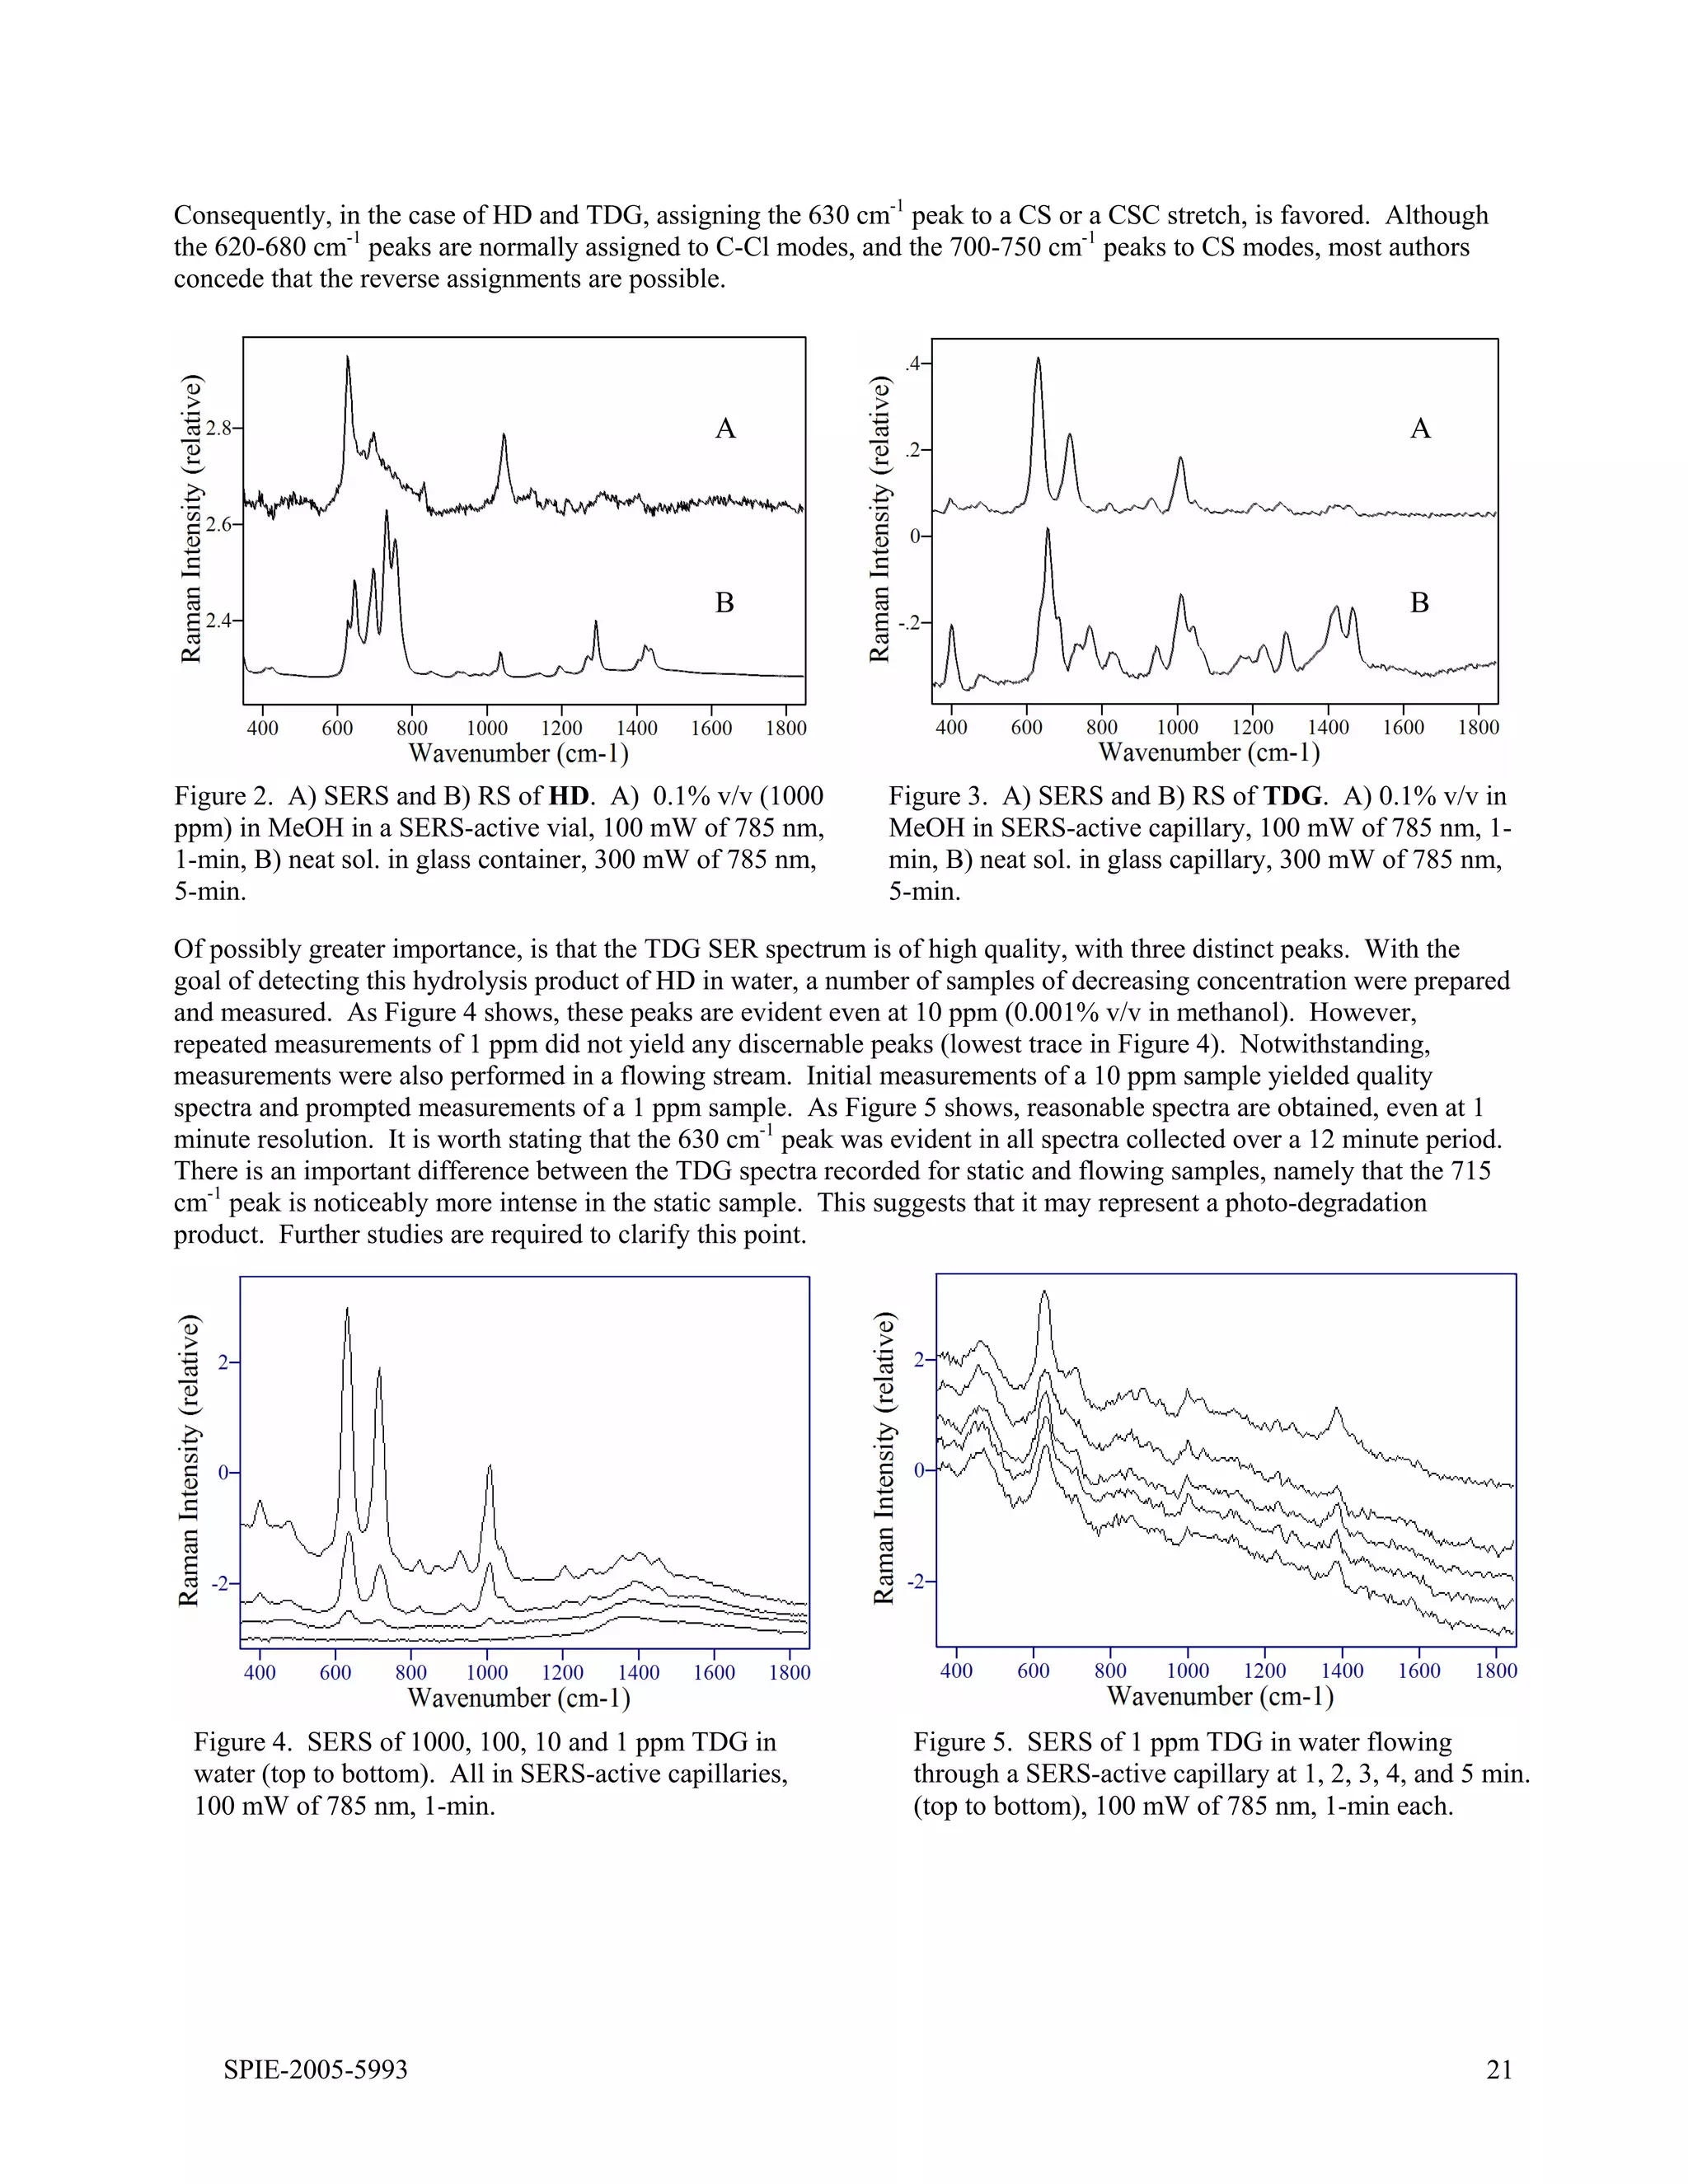
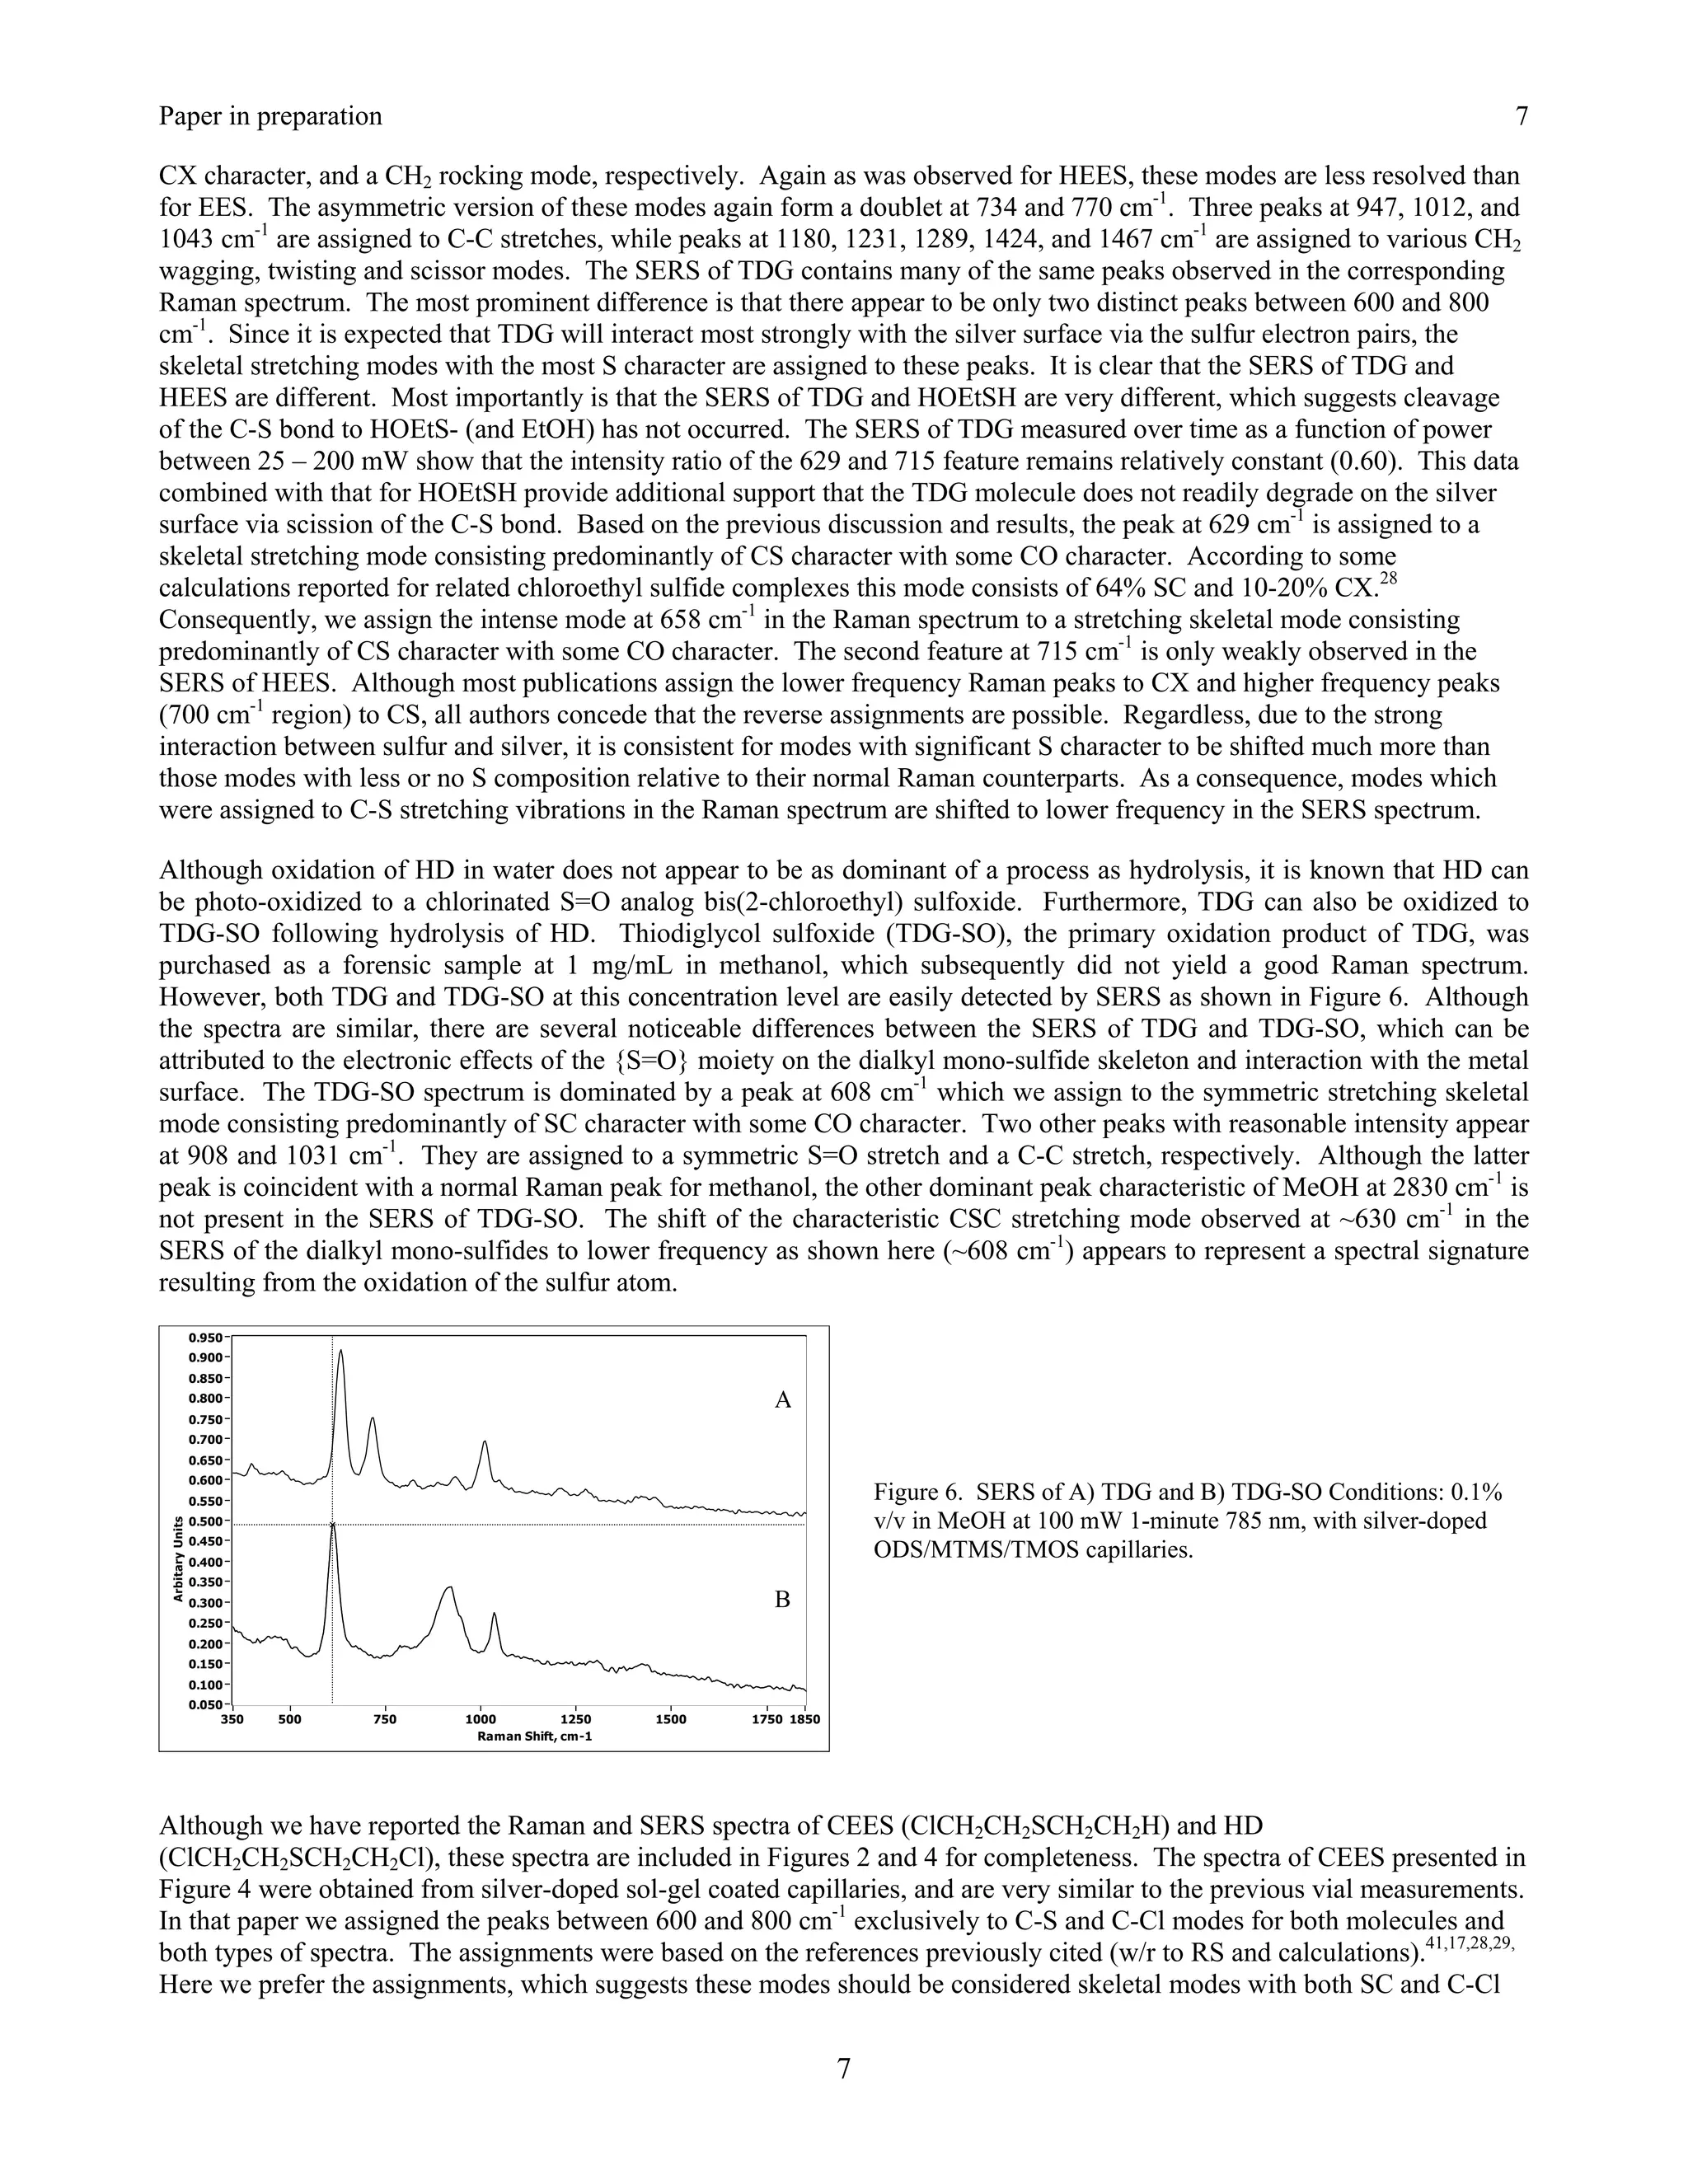
The surface-enhanced Raman spectrum of TDG is also dominated by a peak at 630 cm-1 with minor peaks at 820,
930, 1210, and 1275 cm-1 (Figure 25.4B). Again, the 630 cm-1 peak is preferably assigned to a CSC stretching mode
versus a CCl mode, especially since the chlorines have been replaced by hydroxyl groups. Furthermore, the lack of
a 695 cm-1 peak in the TDG spectrum supports the assignment of this peak in the HD spectrum to a CCl mode. The
930, 1210 and 1275 cm-1 SERS peaks are assigned to a CC stretch with CO contribution, and two CH2 deformation
modes (twist, scissors, or wag) based on the assignments for the corresponding peaks at 940, 1230 and 1290 cm-1 in
the Raman spectrum of TDG [52,54 ]. It is worth noting that irradiation at high laser powers or for extended periods
produces peaks at 715 and 1010 cm-1, which are attributed to a degradation product, such as 2-hydroxy ethanethiol
[54].
The SERS of CEES is very similar to HD, dominated by a peak at 630 cm-1 that is accordingly assigned to a CS or
CSC stretching mode (Figure 25.5A). This peak also has a high frequency shoulder centered at 690 cm-1, and a third
peak appears at 720 cm-1 in this region. Again, these can be assigned to CCl or CS modes. The quality of this
spectrum also reveals weak peaks at 1035, 1285, 1410, and 1445 cm-1. Peaks at 1035, 1285, 1425, and 1440 cm-1](https://image.slidesharecdn.com/finalreportdaad1302c0015part5applp-13347355530702-phpapp01-120418025822-phpapp01/75/Final-Report-Daad13-02-C-0015-Part5-App-L-P-20-2048.jpg)
![Springer Book Kneipp Editor Draft 7
appear in the Raman spectrum of CEES, and the previous peak assignments are used here [52], i.e. the first peak is
assigned to a CC stretch, while the remaining peaks are assigned to various CH2 deformation modes.
A
B
Figure 25.5. Surface-enhanced Raman spectra of A) CEES and B) HEES. Spectral conditions as in Fig. 25.2,
samples were 1 g L-1 in methanol.
Replacing the chlorine atom of CEES by a hydroxyl group in forming HEES produces SER spectral changes
analogous to those cited above for HD and TDG. Again, the SER spectrum is dominated by an intense peak at 630
cm-1 attributed to a CS or CSC stretching mode, and the other CEES peaks in this region, specifically the 720 cm-1
peak, disappear (Figure 25.5B). Peaks with modest intensity at 1050 and 1145 cm-1 are assigned to a CC stretching
mode and CH2 deformation, respectively. A new peak at 550 cm-1 is likely due to a skeletal bending mode, such as
CSC, SCC, or CCO. Finally, it is worth stating that HD, TDG, CEES, and HEES all produce moderately intense
peaks at 2865 and 2925 cm-1 (not shown), that can be assigned to symmetric and asymmetric CH2 stretching modes.
Only a limited number of measurements of HD were performed to evaluate sensitivity, due to the safety
requirements. HD was repeatedly observed at 1 g L-1 and usually observed at 0.1 g L-1 (100 ppm) in the SERS-
active vials [40] But even at the latter concentration, substantial improvements in sensitivity are required to
approach the required 0.05 mg L-1 (50 ppb) sensitivity. More extensive experiments were performed on HD’s
hydrolysis product, TDG since this chemical is safely handled in a regular chemical lab. Flowing TDG through
SERS-active capillaries allowed repeatable measurements at 10 mg L-1, and routine measurements at 1 mg L-1 (1
ppm) [55]. These SERS measurements of TDG suggest that the required HD sensitivity may be achievable using
this technique. Similar flowing measurements in capillaries for HD, CEES, and HEES have not been performed.
25.3.3 Sarin. SERS measurements of GB have not been made, but its primary hydrolysis products, IMPA and
MPA, have been measured using the SERS-active vials. The SERS of IMPA is very similar to its Raman spectrum
[42], which in turn is very similar to the Raman spectrum of sarin [28]. The SER spectrum is dominated by a peak
at 715 cm-1 (Figure 25.6A), which is assigned to a PC or PO plus skeletal stretching mode, as is a weak peak at 770
cm-1. These assignments are also consistent with a theoretical treatment of the Raman spectrum for sarin [57].
Similarly, a modest peak at 510 cm-1 can be assigned to a PC or PO plus skeletal bending mode. Other SERS peaks
of modest intensity occur at 875, 1055, 1415, and 1450 cm-1, and based on the spectral analysis of sarin and the
Raman spectrum of IMPA with peaks at 880, 1420, and 1455 cm-1, are assigned to a CCC bend, a PO3 stretch, a CH3
bend, and a CH2 rock, respectively.](https://image.slidesharecdn.com/finalreportdaad1302c0015part5applp-13347355530702-phpapp01-120418025822-phpapp01/75/Final-Report-Daad13-02-C-0015-Part5-App-L-P-21-2048.jpg)
![Springer Book Kneipp Editor Draft 8
A
B
C
Figure 25.6. Surface-enhanced Raman spectra of A) IMPA, B) MPA, and C) EMPA. Spectral conditions as in Fig.
25.2, samples were 1 g L-1 in water.
MPA has been well characterized by infrared and Raman spectroscopy [58,59], as well as normal coordinate
analysis [60], and the literature assignments are used here for the SERS of MPA. The SER spectrum is dominated
by a peak at 755 cm-1, which is assigned to the PC symmetric stretch (Figure 25.6B). In comparison to IMPA, it is
clear that removing the isopropyl group shifts this frequency substantially (40 cm-1), as the mode becomes a purer
PC stretch. Additional peaks with comparatively little intensity occur at 470, 520, 960, 1040, 1300, and 1420 cm-1,
and are assigned to a PO3 bending mode, a C-PO3 bending mode, a PO3 stretching mode, another PO3 bending
mode, and two CH3 deformation modes (twisting and rocking).
SERS-active vials allowed repeatable measurements of MPA at 10 mg L-1 and routine measurements at 1 mg L-1,
and repeatable measurements of IMPA at 100 mg L-1 and routine measurements at 10 mg L-1. Again, however,
substantial improvements in sensitivity are required to achieve the minimum requirement of 0.004 mg L-1.
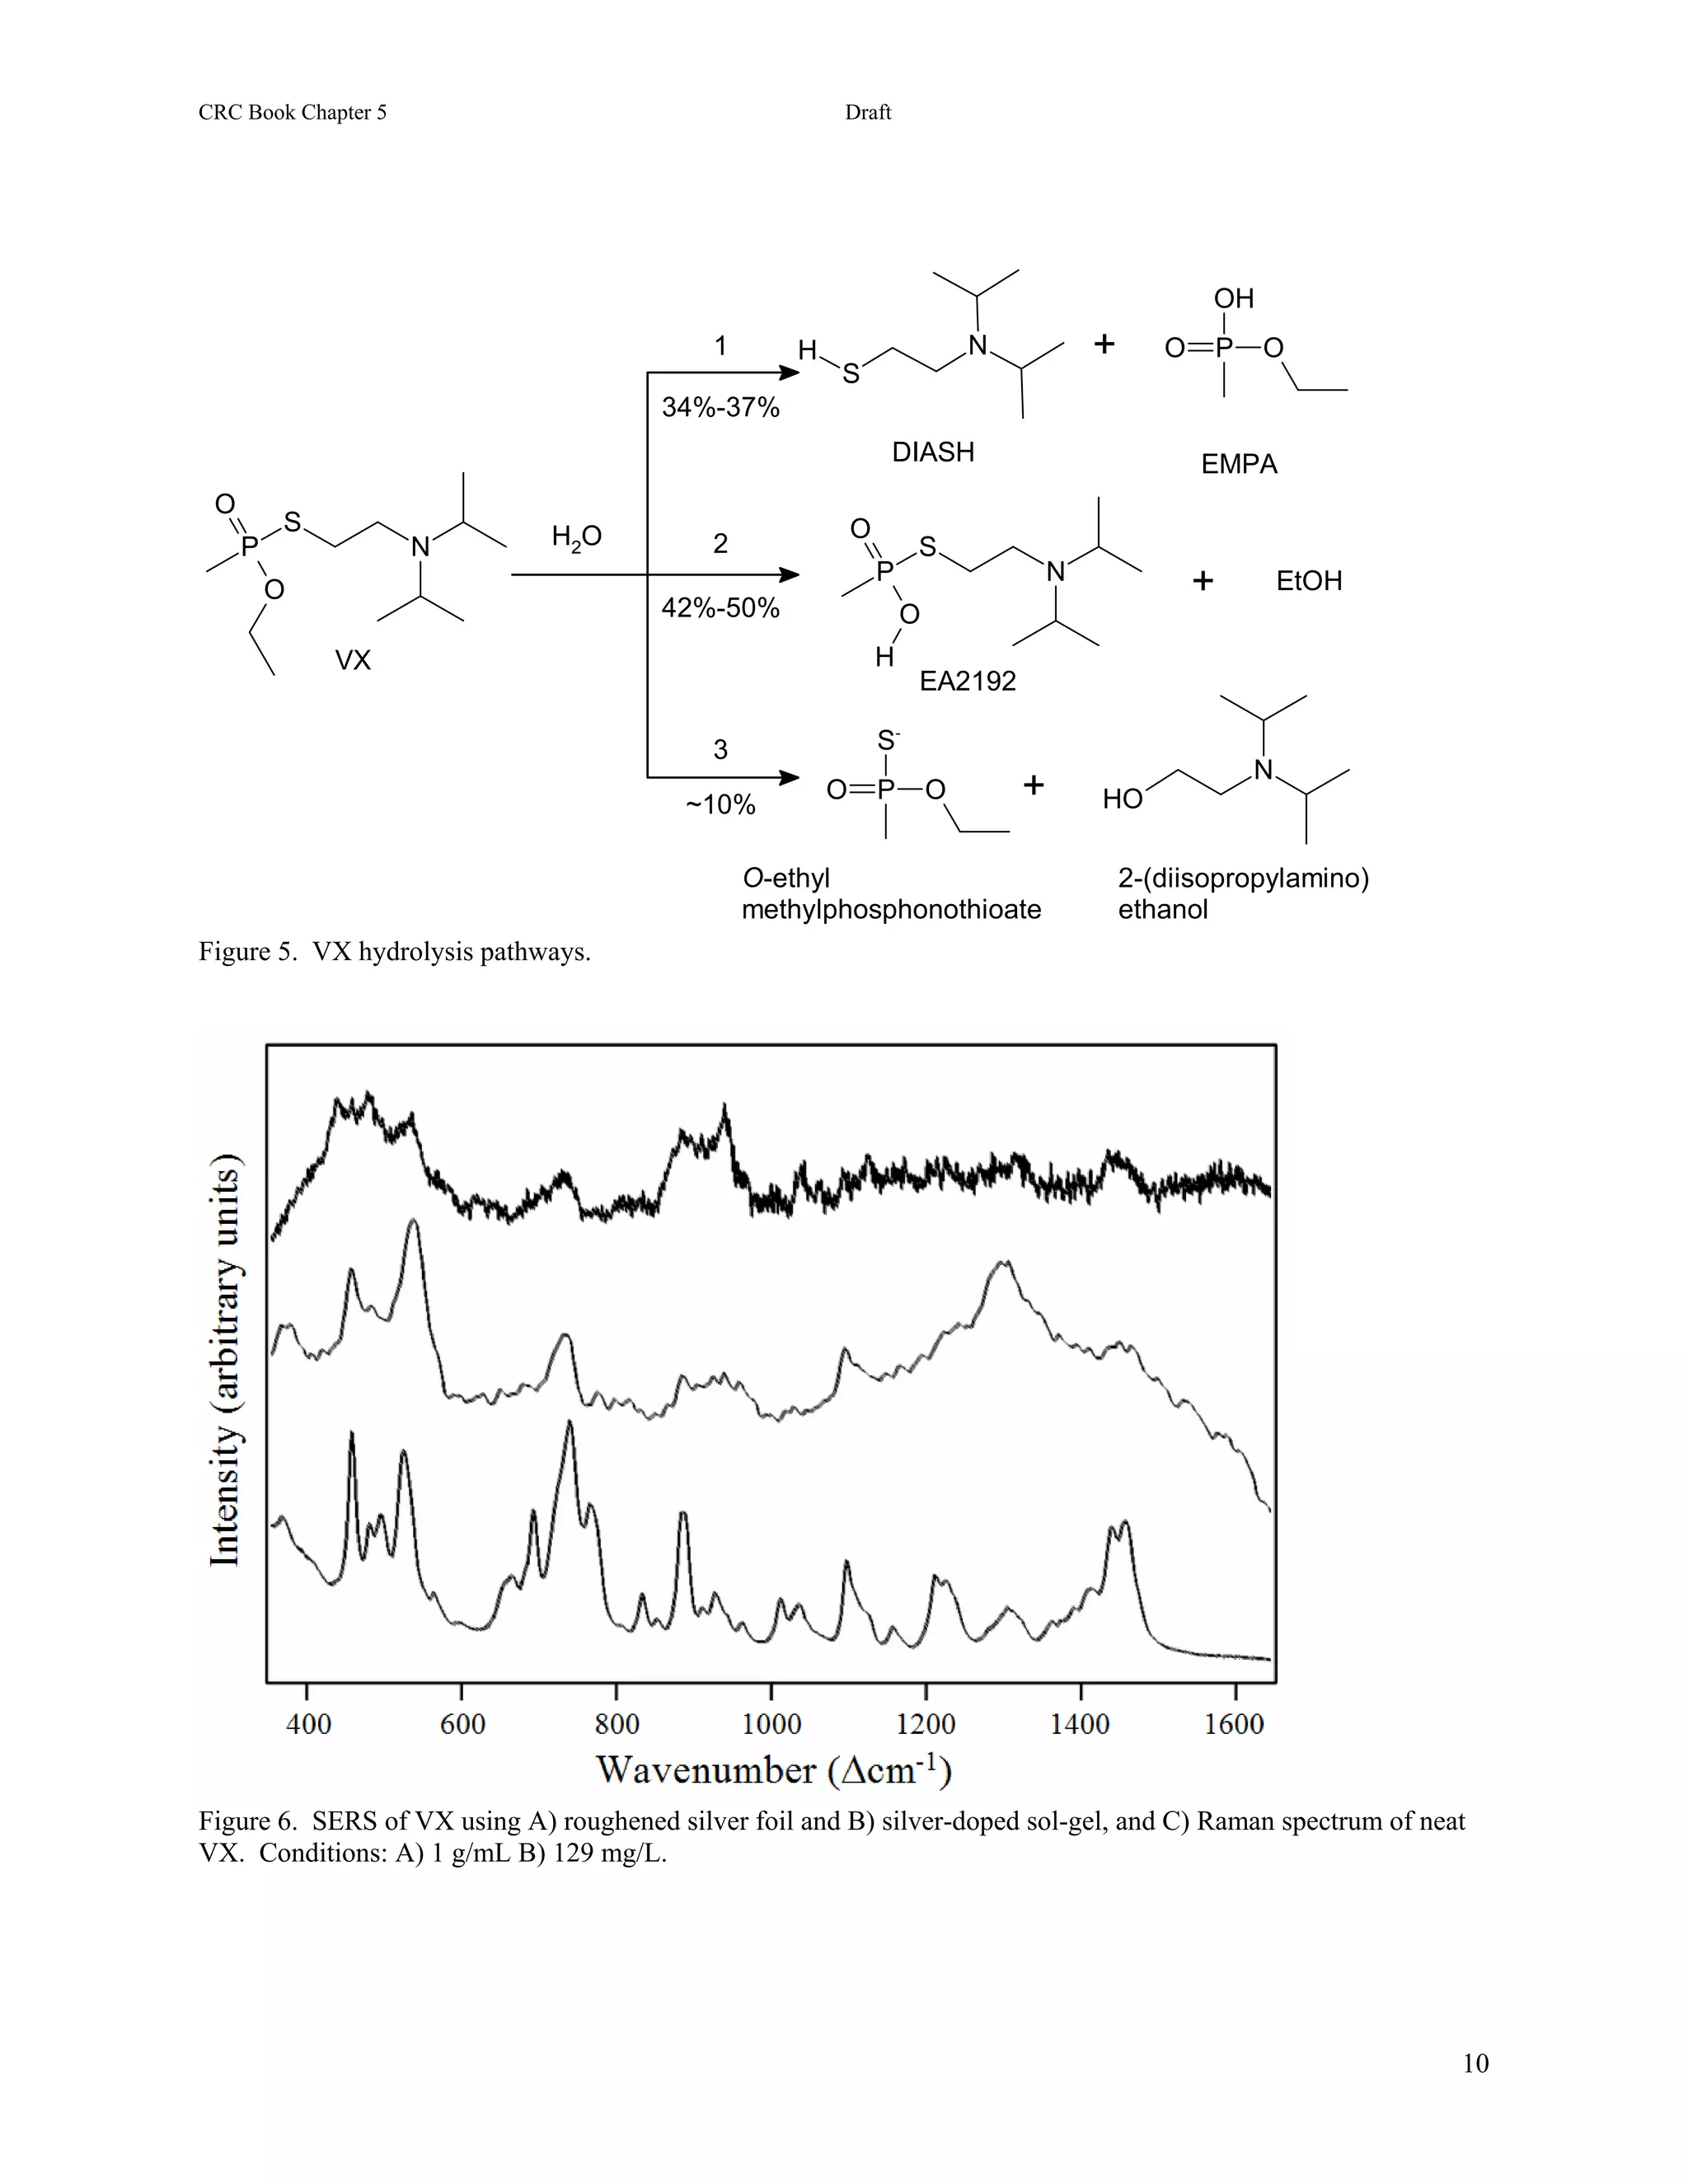
25.3.4 VX. The hydrolysis of VX can occur along two pathways (Figure 25.1D) [11,22], either being converted to
DIASH and EMPA or EA2192 and ethanol with the former pathway favored four to one. These products also
hydrolyze, and EMPA forms MPA and ethanol, while EA2192 forms DIASH and MPA. Here the SER spectra of
VX, EA2192 and DIASH are compared, while EMPA is compared to IMPA and MPA.
The SER spectrum of VX is similar to its Raman spectrum with corresponding peaks at 375, 460, 540, 730, 1095,
1300, 1440, and 1460 cm-1 (Figure 25.7A). Since a computer predicted Raman spectrum contains most of the
measured Raman spectral peaks [43,61], it is used to assign the above SERS peaks respectively to an SPO bend, a
CH3-P=O bend, a PO2CS wag, an OPC stretch, a CC stretch, and three CHn bends. As previously described for
CEES and HD, the 730 cm-1 peak could alternatively be assigned to a CS stretch, but the SER spectra of these
chemicals suggest otherwise.
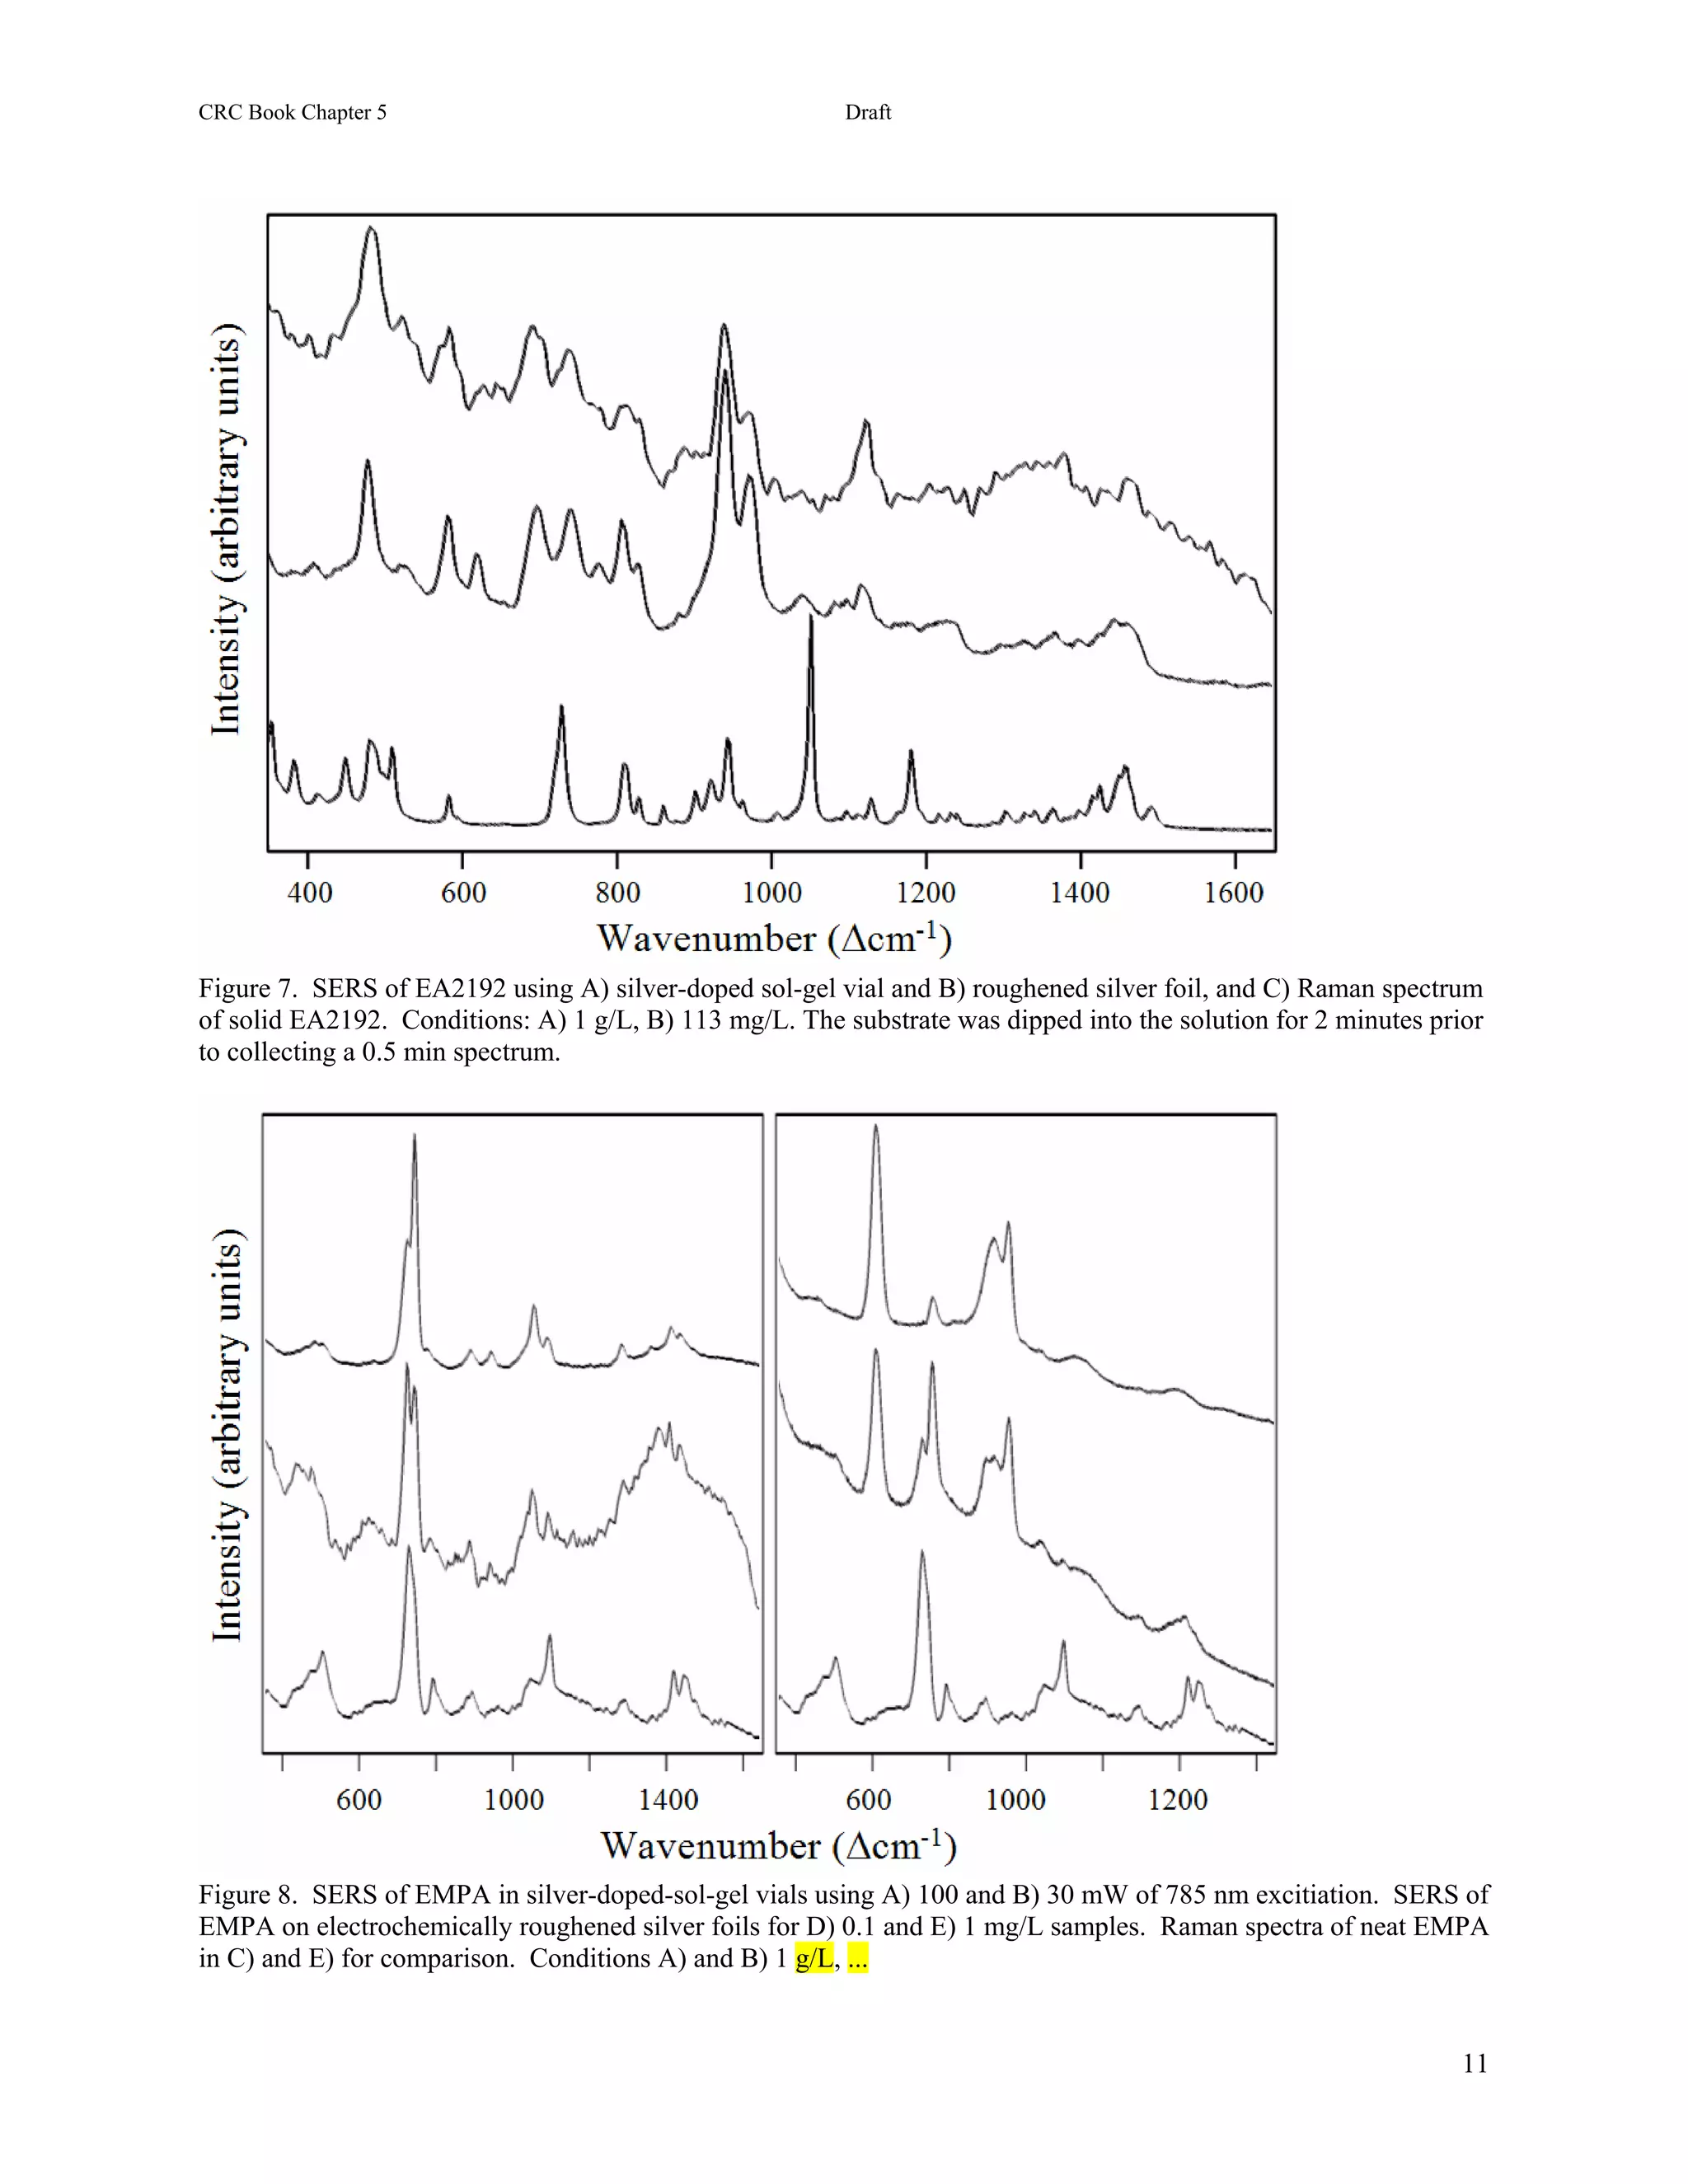
The SER spectrum of EA2192 is somewhat different than VX with the PO modes having limited intensity and the
NC3 modes having significant intensity (Figure 25.7B). Specifically, the EA2192 spectrum has moderately intense
peaks at 480, 585, 940, and 1125 cm-1 that can be assigned to an NC3 breathing mode, an NCC bending mode,
another NC3 stretching mode, and a NCC stretching mode. Two additional peaks with significant intensity at 695](https://image.slidesharecdn.com/finalreportdaad1302c0015part5applp-13347355530702-phpapp01-120418025822-phpapp01/75/Final-Report-Daad13-02-C-0015-Part5-App-L-P-22-2048.jpg)
![Springer Book Kneipp Editor Draft 9
and 735 cm-1 are assigned to a CS stretching mode and an OPC stretching mode, respectively. Two peaks of modest
intensity at 525 and 970 cm-1 are attributed to a PO2S bending mode and a PO2 stretching mode.
A
B
C
Figure 25.7. Surface-enhanced Raman spectra of A) VX, B) EA2192, and C) DIASH. Spectral conditions as in Fig.
25.2, samples were 1 g L-1 in water.
The SER spectrum of DIASH contains most of the NC3 modes cited previously for EA2192 (Figure 25.7C),
specifically peaks appear at 480, 585, 940, and 1120 cm-1, and can be assigned as above. Additional peaks at 740,
810, and 1030 cm-1, are assigned to CH bending, a combination of SC stretching and NC3 bending, and SCCN
bending modes, based on the Raman spectrum of DIASH [43]. A broad peak centered at 695 cm-1 also occurs that
has previously been assigned to an SC stretch, but the frequency and intensity of this mode in the HD and CEES
spectra above, makes this assignment less certain.
It is worth noting the similarity between the EA2192 and DIASH SER spectra, the principle difference being the
addition of the SCCN bending mode at 1030 cm-1 for the latter. This may simply be due to the fact that both
molecules interact through the sulfur with the metal surface to similar extents resulting in similar spectra. However,
it is also possible that the EA2192 spectrum is of DIASH formed either by hydrolysis or photo-degradation. Since
the sample was measured within one hour of preparation, and the hydrolysis half-life is on the order of weeks [12],
the former explanation seems unlikely. Since the peak intensities did not change during these measurements, photo-
degradation catalyzed by silver also seems unlikely. Further experiments are required to clarify this point.
The SER spectrum of the other hydrolysis product formed from VX, EMPA, is shown in Figure 25.6. It is included
with MPA and IMPA, the hydrolysis products of GB, for convenient spectral comparison of these structurally
similar chemicals. The spectrum is dominated by a peak at 745 cm-1 with a substantial low frequency shoulder at
725 cm-1. Both are assigned, similarly to IMPA, to PC or PO plus skeletal stretching modes. In fact, virtually all of
the peaks in the SER spectrum correspond to peaks of similar frequency in the SER spectrum of IMPA, and are
assigned as follows: the peaks at 480 and 500 cm-1 to PC or PO plus skeletal bends; 890, 1415, and 1440 cm-1 to
CHn deformations; 945 and 1060 cm-1 to POn stretches; and 1095 to a CO or CC stretch. A peak at 1285 cm-1 is
assigned to a CHn deformation based on the MPA spectral assignment for a peak at 1300 cm-1.
In this series of chemicals VX and EA2192 were routinely measured at 100 mg L-1, and on occasion at 10 mg L-1
using the SERS-active vials. Again, however, only a limited number of measurements were attempted. More](https://image.slidesharecdn.com/finalreportdaad1302c0015part5applp-13347355530702-phpapp01-120418025822-phpapp01/75/Final-Report-Daad13-02-C-0015-Part5-App-L-P-23-2048.jpg)
![Paper in preparation 2
O
H 2O [Ox] TDG-SO
TDG
HD 2 HCl + S
S S
HO OH HO OH
Cl Cl
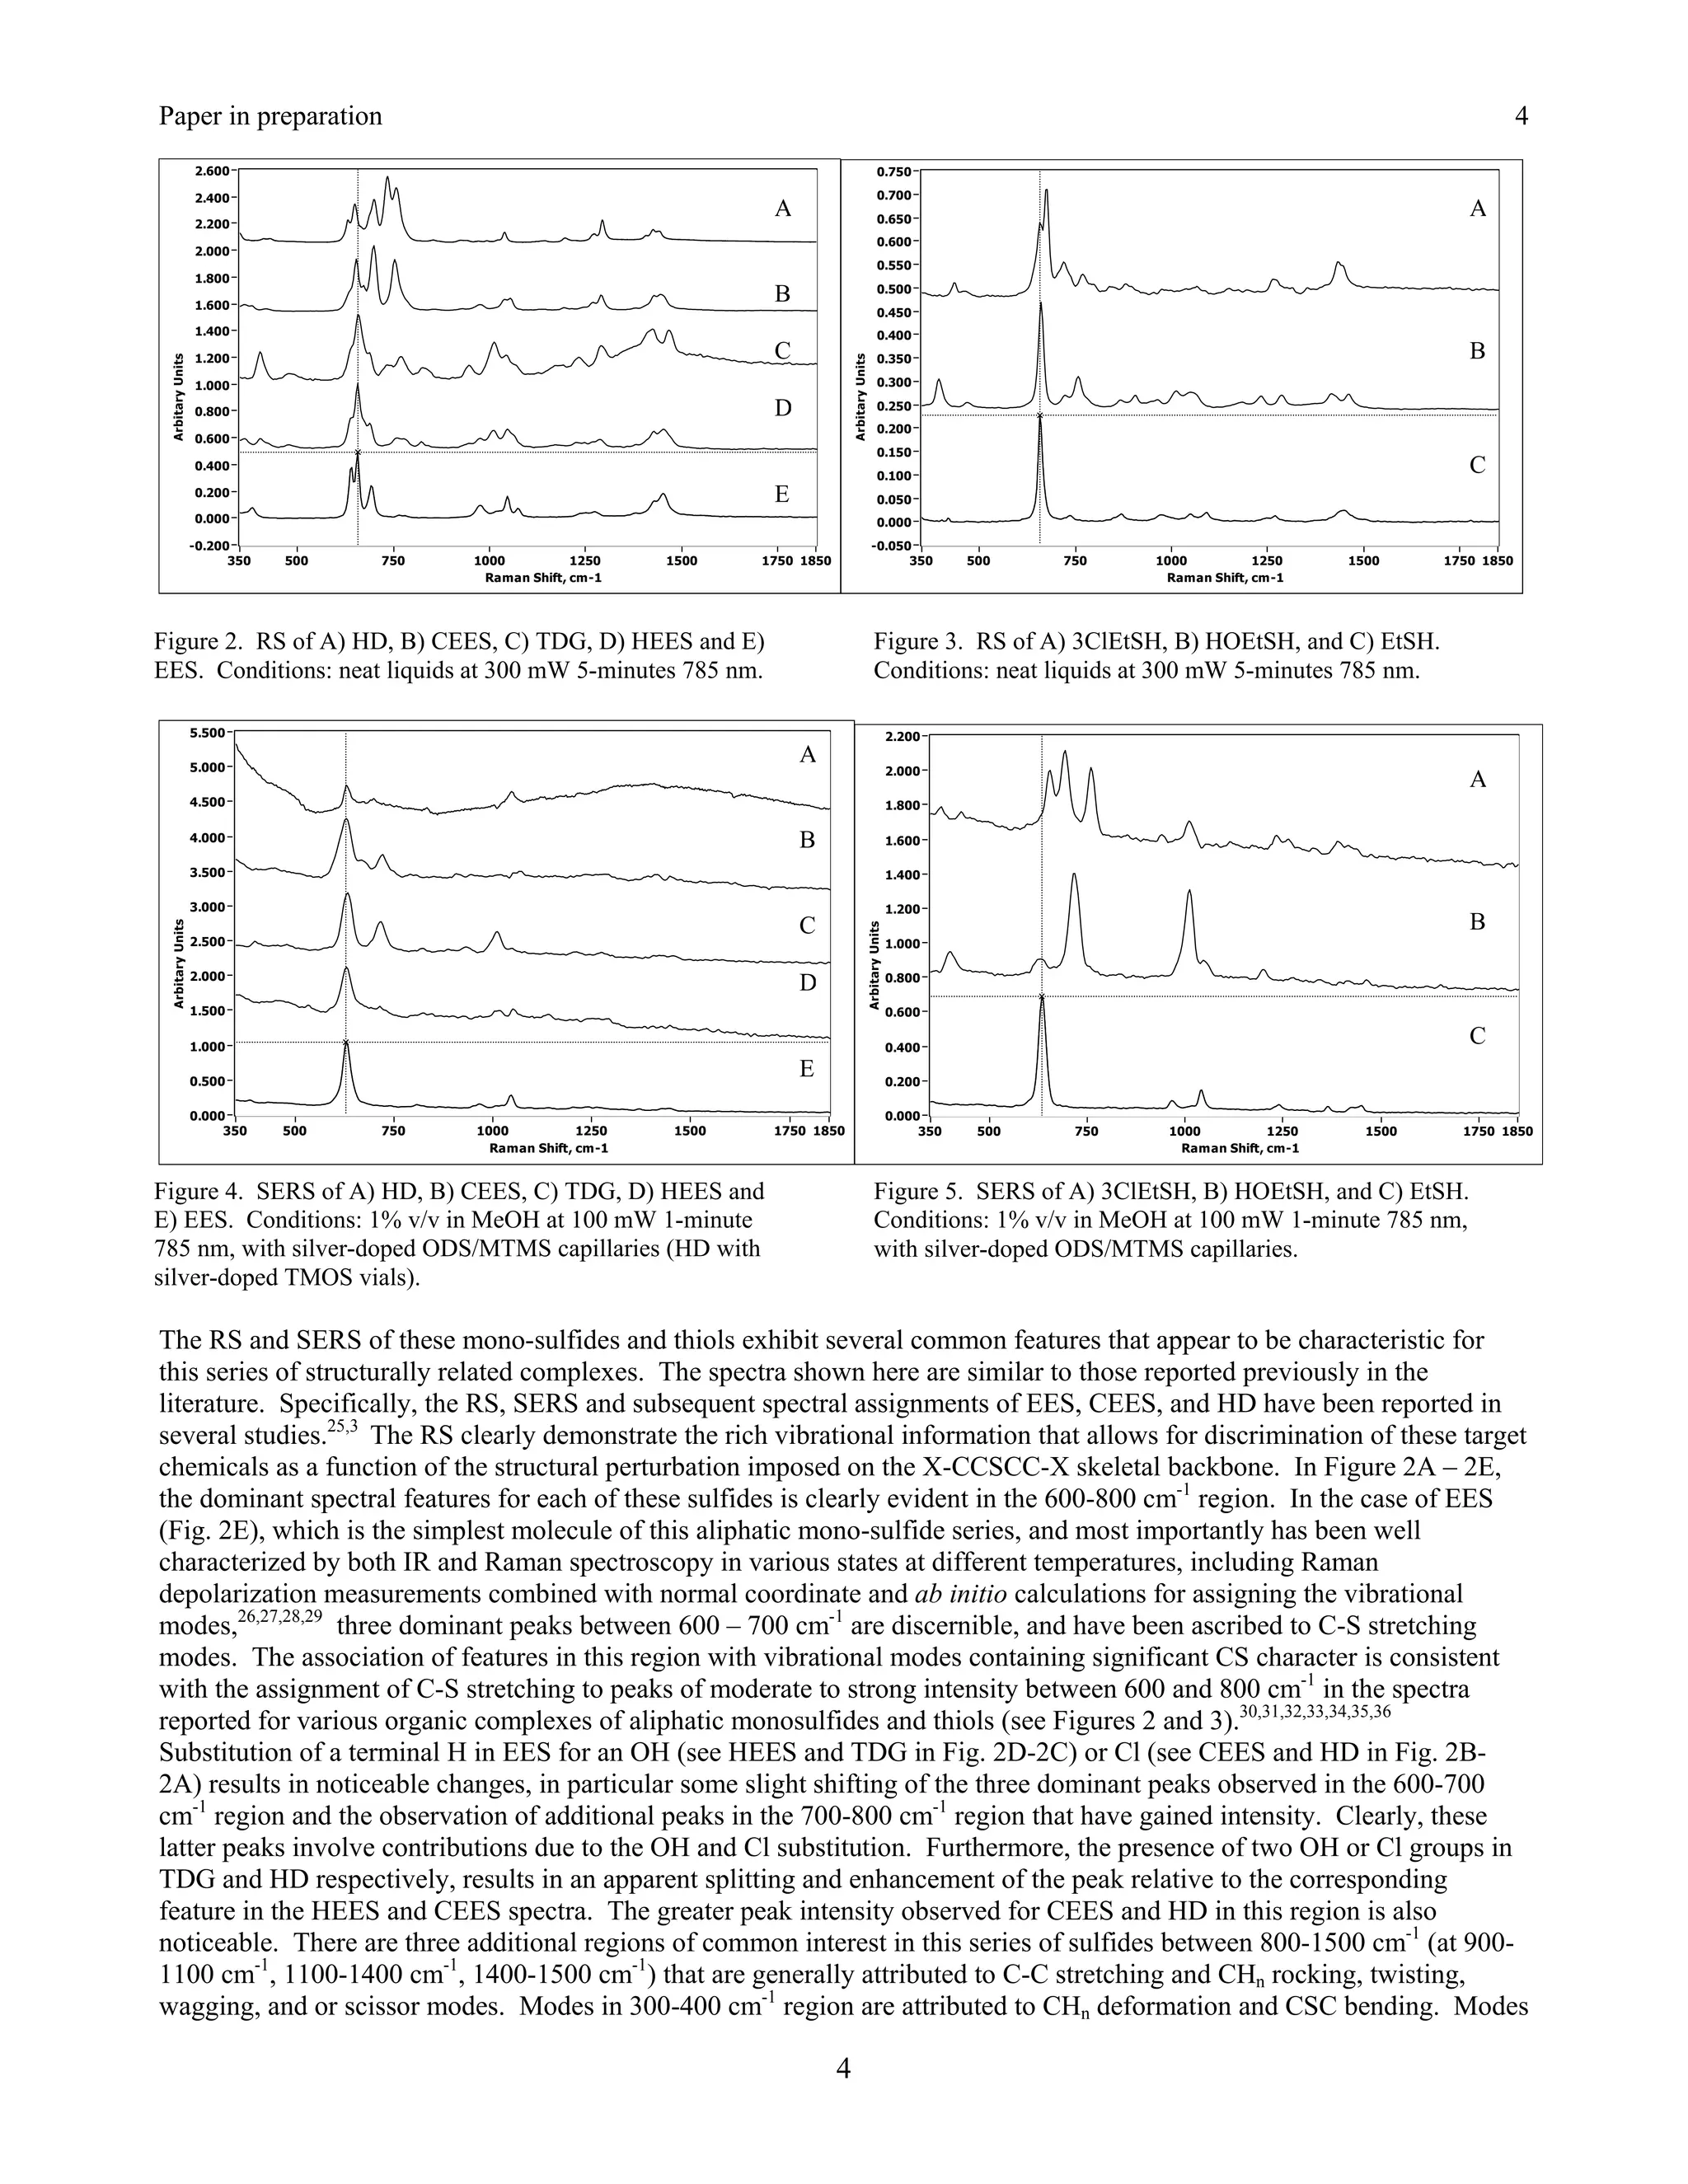
Figure 1. Primary Hydrolysis pathway of HD: degradation products shown in their protonated forms.
The ability to detect and characterize the more persistent hydrolysis products of HD such as TDG is important for a number
of reasons: 1) they are indicators for identifying the parent CWA present (or provide strong supporting evidence for prior
use of), 2) for assessing if degradation of the CWA has occurred, and 3) they provide a means for predicting when the water
supply was poisoned.
2. EXPERIMENTAL
The CWA vesicant Bis(2-chloroethyl)sulfide (designated HD or distilled sulfur mustard) was supplied as a neat liquid by
the U.S. Army at the Edgewood Chemical Biological Center (Aberdeen, MD). All Raman and SERS measurements
involving HD were acquired at this facility, while the other chemicals presented here were measured at Real-Time
Analyzers (RTA, Middletown, CT). The primary HD hydrolysis product Bis(2-hydroxyethyl)sulfide (designated TDG or
thiodiglycol) and subsequent oxidation product Bis(2-hydroxyethyl)sulfoxide (designated TDG-SO or thiodiglycol
sulfoxide) were purchased as analytical reference materials from Cerilliant (Round Rock, TX). TDG was purchased as a
neat liquid. Although the pure liquid form of TDG-SO was available, it was purchased here in forensic quantities (1
mg/mL in MeOH). The additional mono-sulfides studied, which included dimethyl sulfide (MMS), diethyl sulfide (EES),
2-hydroxyethyl ethylsulfide (HEES), 2-chloroethyl ethylsulfide (CEES), 2-chloroethyl methylsulfide (CEMS), and 2-
chloroethyl phenylsulfide (CEPS), were obtained as neat liquids at the highest purity available from Sigma-Aldrich (St.
Louis, MO) and used here without further purification. The other chemicals purchased, which include the additional test
analytes ethanethiol (EtSH), 2-hydroxy ethanethiol (HOEtSH) and 3-chloro propanethiol (ClPrSH) as neat liquids, and
those chemical reagents and solvents used to prepare the silver-doped and gold-doped sol-gels, were also acquired from
Sigma-Aldrich (St. Louis, MO) and used as received. All solvents, including those used for sample preparation were of
HPLC grade. For safety purposes, all samples were prepared and manipulated in a chemical hood, where they were
introduced to the sampling device and sealed before being measured. Prior to the SERS studies, Raman spectra (RS) of the
di-alkyl- and alkyl-aromatic-sulfides, and the other relevant structural fragments (including thiols and alcohols) were
measured in capillaries as pure liquids with the exception of TDG-SO (1 mg purchased in a 1mL methanol solution). The
Raman spectrum of ethane thiolate (deprotonated form of EtSH in 1N KOH) was also measured. In the case of surface-
enhanced Raman spectral measurements, the sulfides MMS, EES, HEES, CEES, CEMS, CEPS, and TDG were prepared
initially as 1% v/v solutions in methanol (10 mg/mL), as were the thiols EtSH, HOEtSH, and ClPrSH. Samples at lower
concentrations were prepared by sequential serial dilution of the stock analyte solution using the appropriate solvent. The
1mg/mL forensic sample of TDG-SO (0.1% v/v in methanol) was tested as received. In some cases, the test analyte was
directly prepared in water at the desired concentration level. All solutions were immediately measured following their
preparation in order to obtain a base-line spectral reference, with subsequent measurements made over time to determine
whether or not the integrity of the sample had been compromised by potential degradation processes. Samples of HD were
tested initially in a water/isopropanol mixture (pre-dissolved in the alcohol and volumetrically brought to the desired
concentration with water prior to measurements). The SERS-response of HD was also measured in pure methanol. In both
cases the SERS of HD was measured at Aberdeen in 2-mL glass vials internally coated with a layer of silver-doped or gold-
doped sol-gel (Simple SERS Sample Vials, Real-Time Analyzers, East Hartford, CT), while the other chemicals were
measured at RTA in a series of 1-mm diameter glass capillaries filled with a pre-defined library subset of chemically
selective silver and gold doped sol-gels. CEMS, CEES, CEPS, and TDG were also measured at RTA in vials spin-coated
with the standard silver-doped sol-gel chemistry that were similar to those used in the previous HD SERS studies.3 The
capillaries were prepared according to previously published methods, where the silver doped sol-gel chemistry used a
silver-amine intermediate formed from the addition of excess ammonium hydroxide to AgNO3.16 However, a combination
of different Si-alkoxides including tetramethyl orthosilicate (TMOS), methyltrimethoxysilane (MTMS), and
octadecyltrimethoxysilane (ODS) were employed instead of plain TMOS. The following four chemically selective silver-
doped sol-gel libraries for coating capillaries designated TMOS/MTMS (1:6 v/v), MTMS, MTMS/ODS/TMOS (5:1:1
v/v/v) and MTMS/ODS (10:1 v/v) with analyte selectivity ranging from polar-negative to non-polar-negative were used
here in this study to screen the chemicals for SERS-activity. The gold-doped sol-gel chemistry employed HAuCl4 in nitric
acid with pure TMOS or a mixture of TMOS/MTMS. For both the silver and gold chemistries, fresh dilute NaBH4
(0.1g/100ml HPLC water, pH=9.65 @23°C) was used to reduce the sol-gels after an appropriate curing period (generally
24 hrs), followed by a water wash to remove residual reducing agent. Additional treatment of the sol-gels with various acid
washes using HNO3 and or HCl at different concentrations provided a means to affect analyte selectivity and or increase
sensitivity.
2](https://image.slidesharecdn.com/finalreportdaad1302c0015part5applp-13347355530702-phpapp01-120418025822-phpapp01/75/Final-Report-Daad13-02-C-0015-Part5-App-L-P-31-2048.jpg)
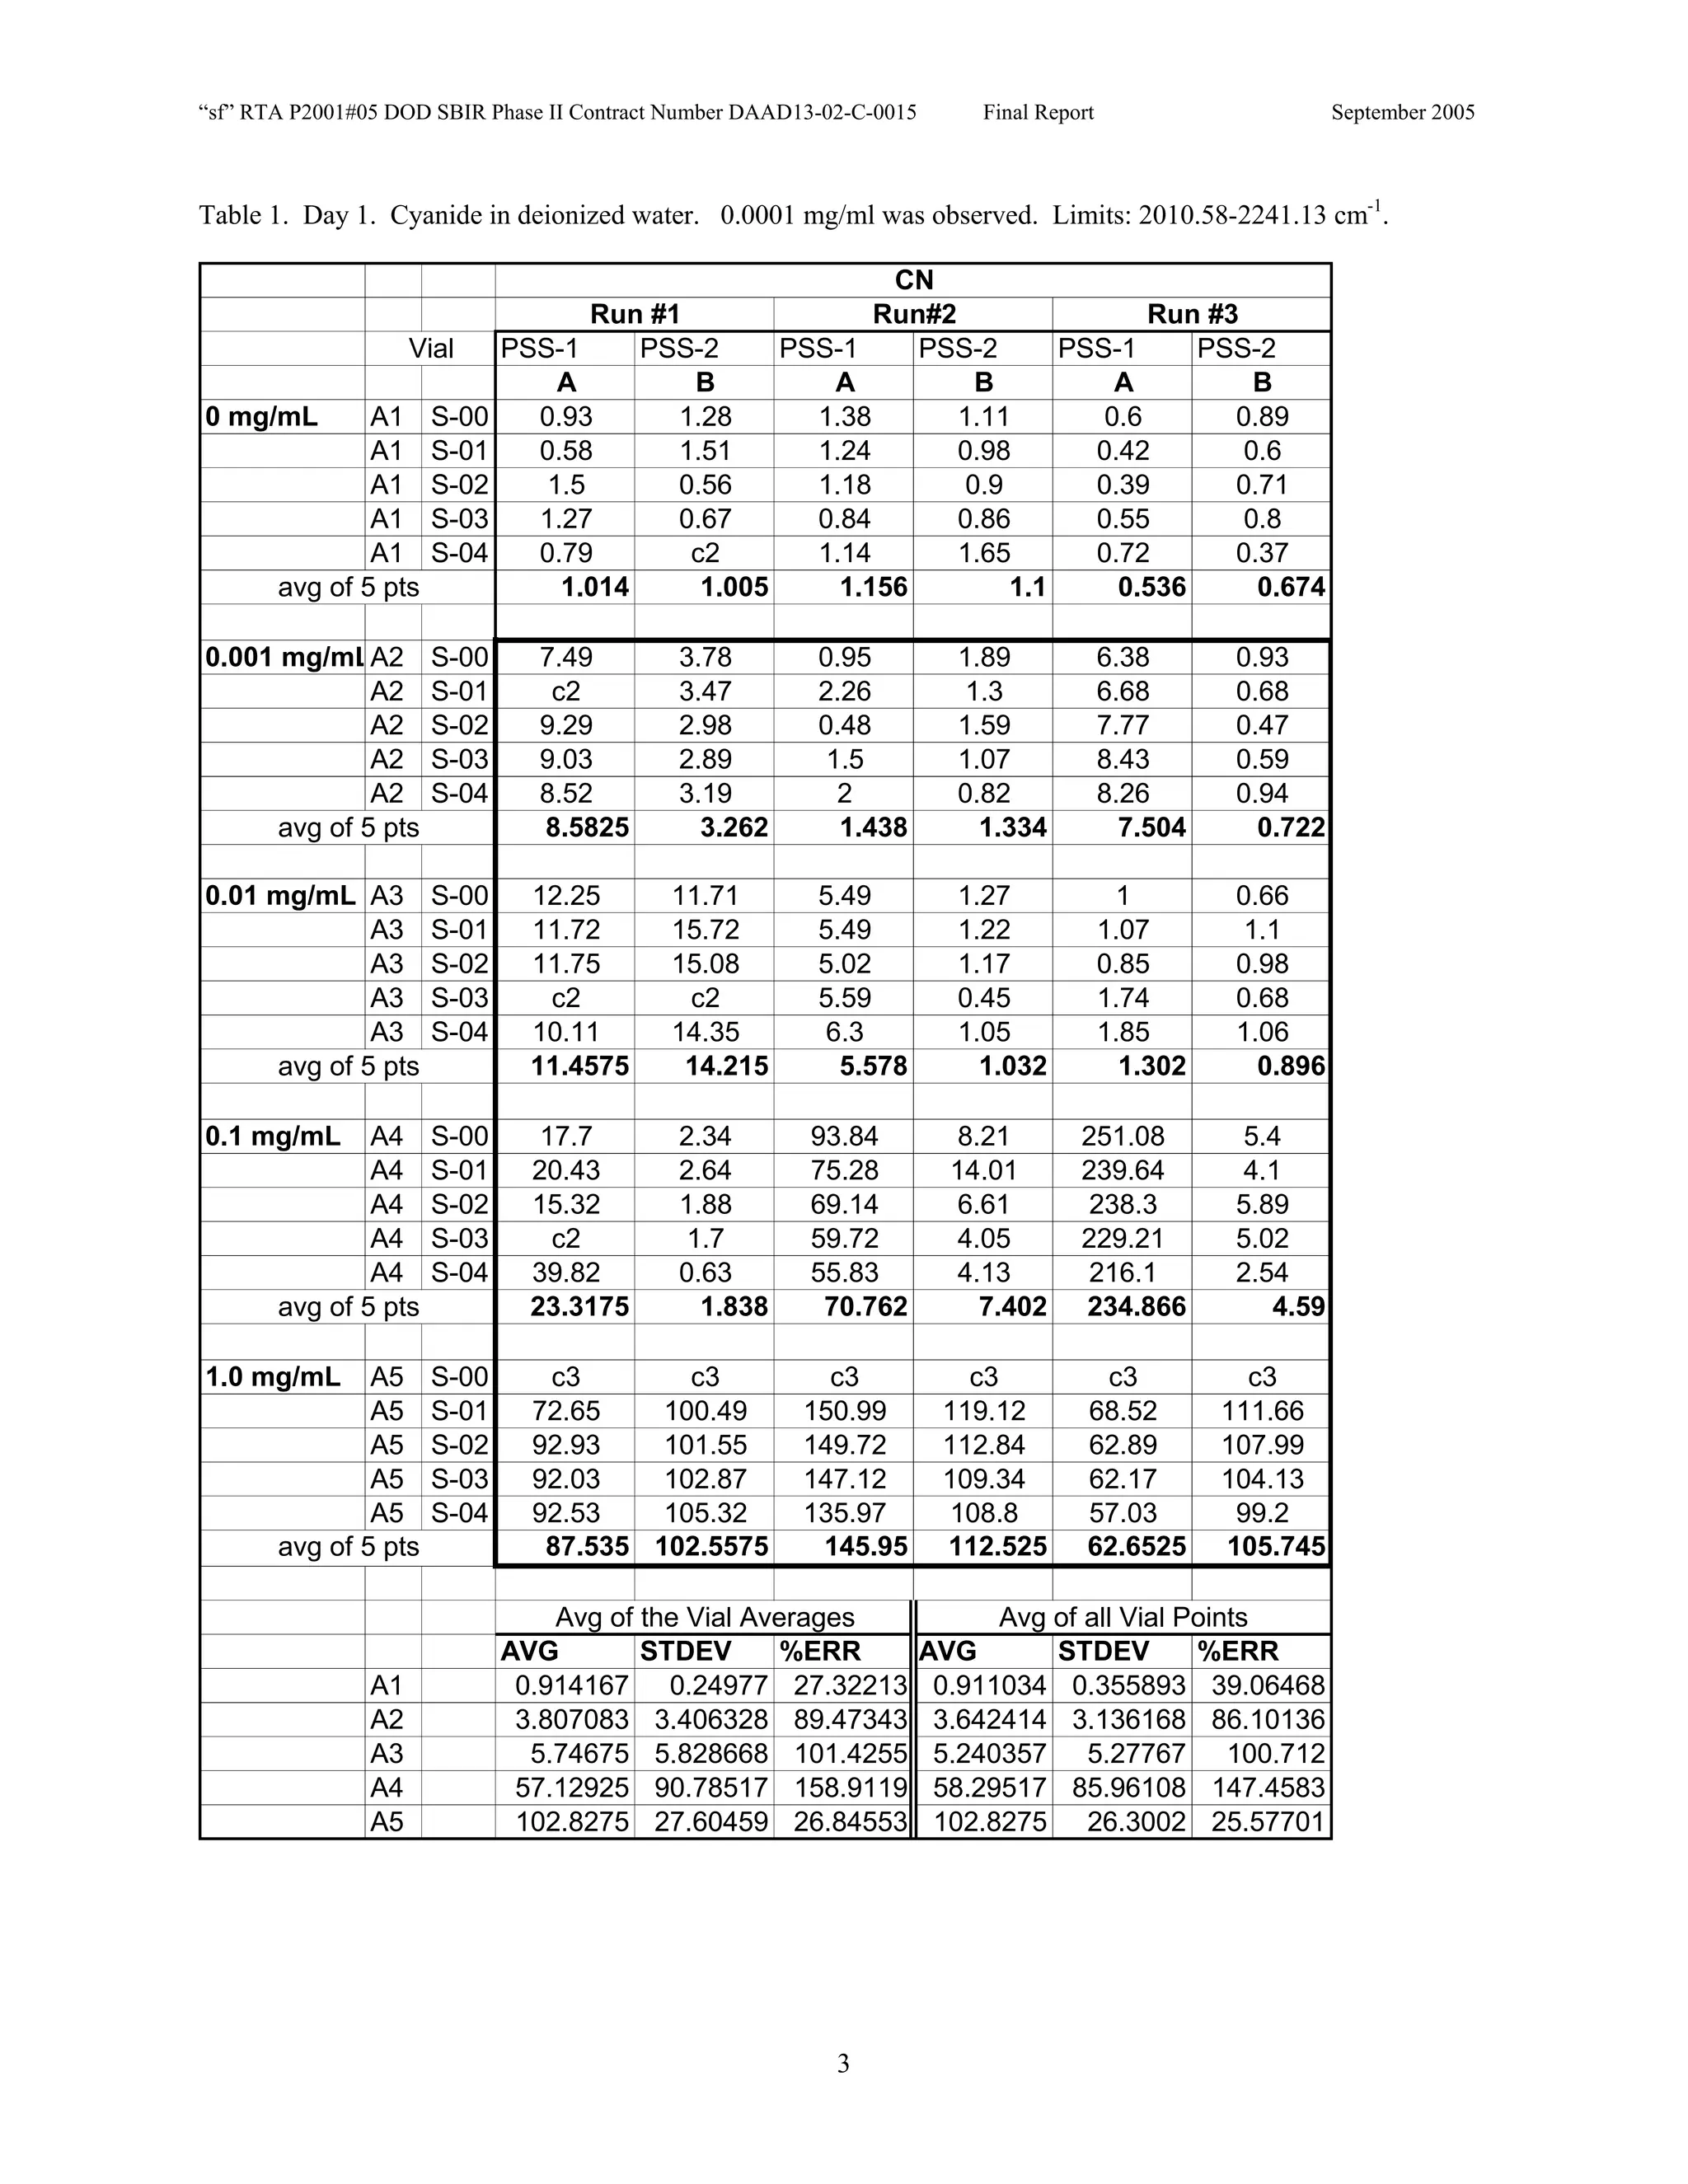
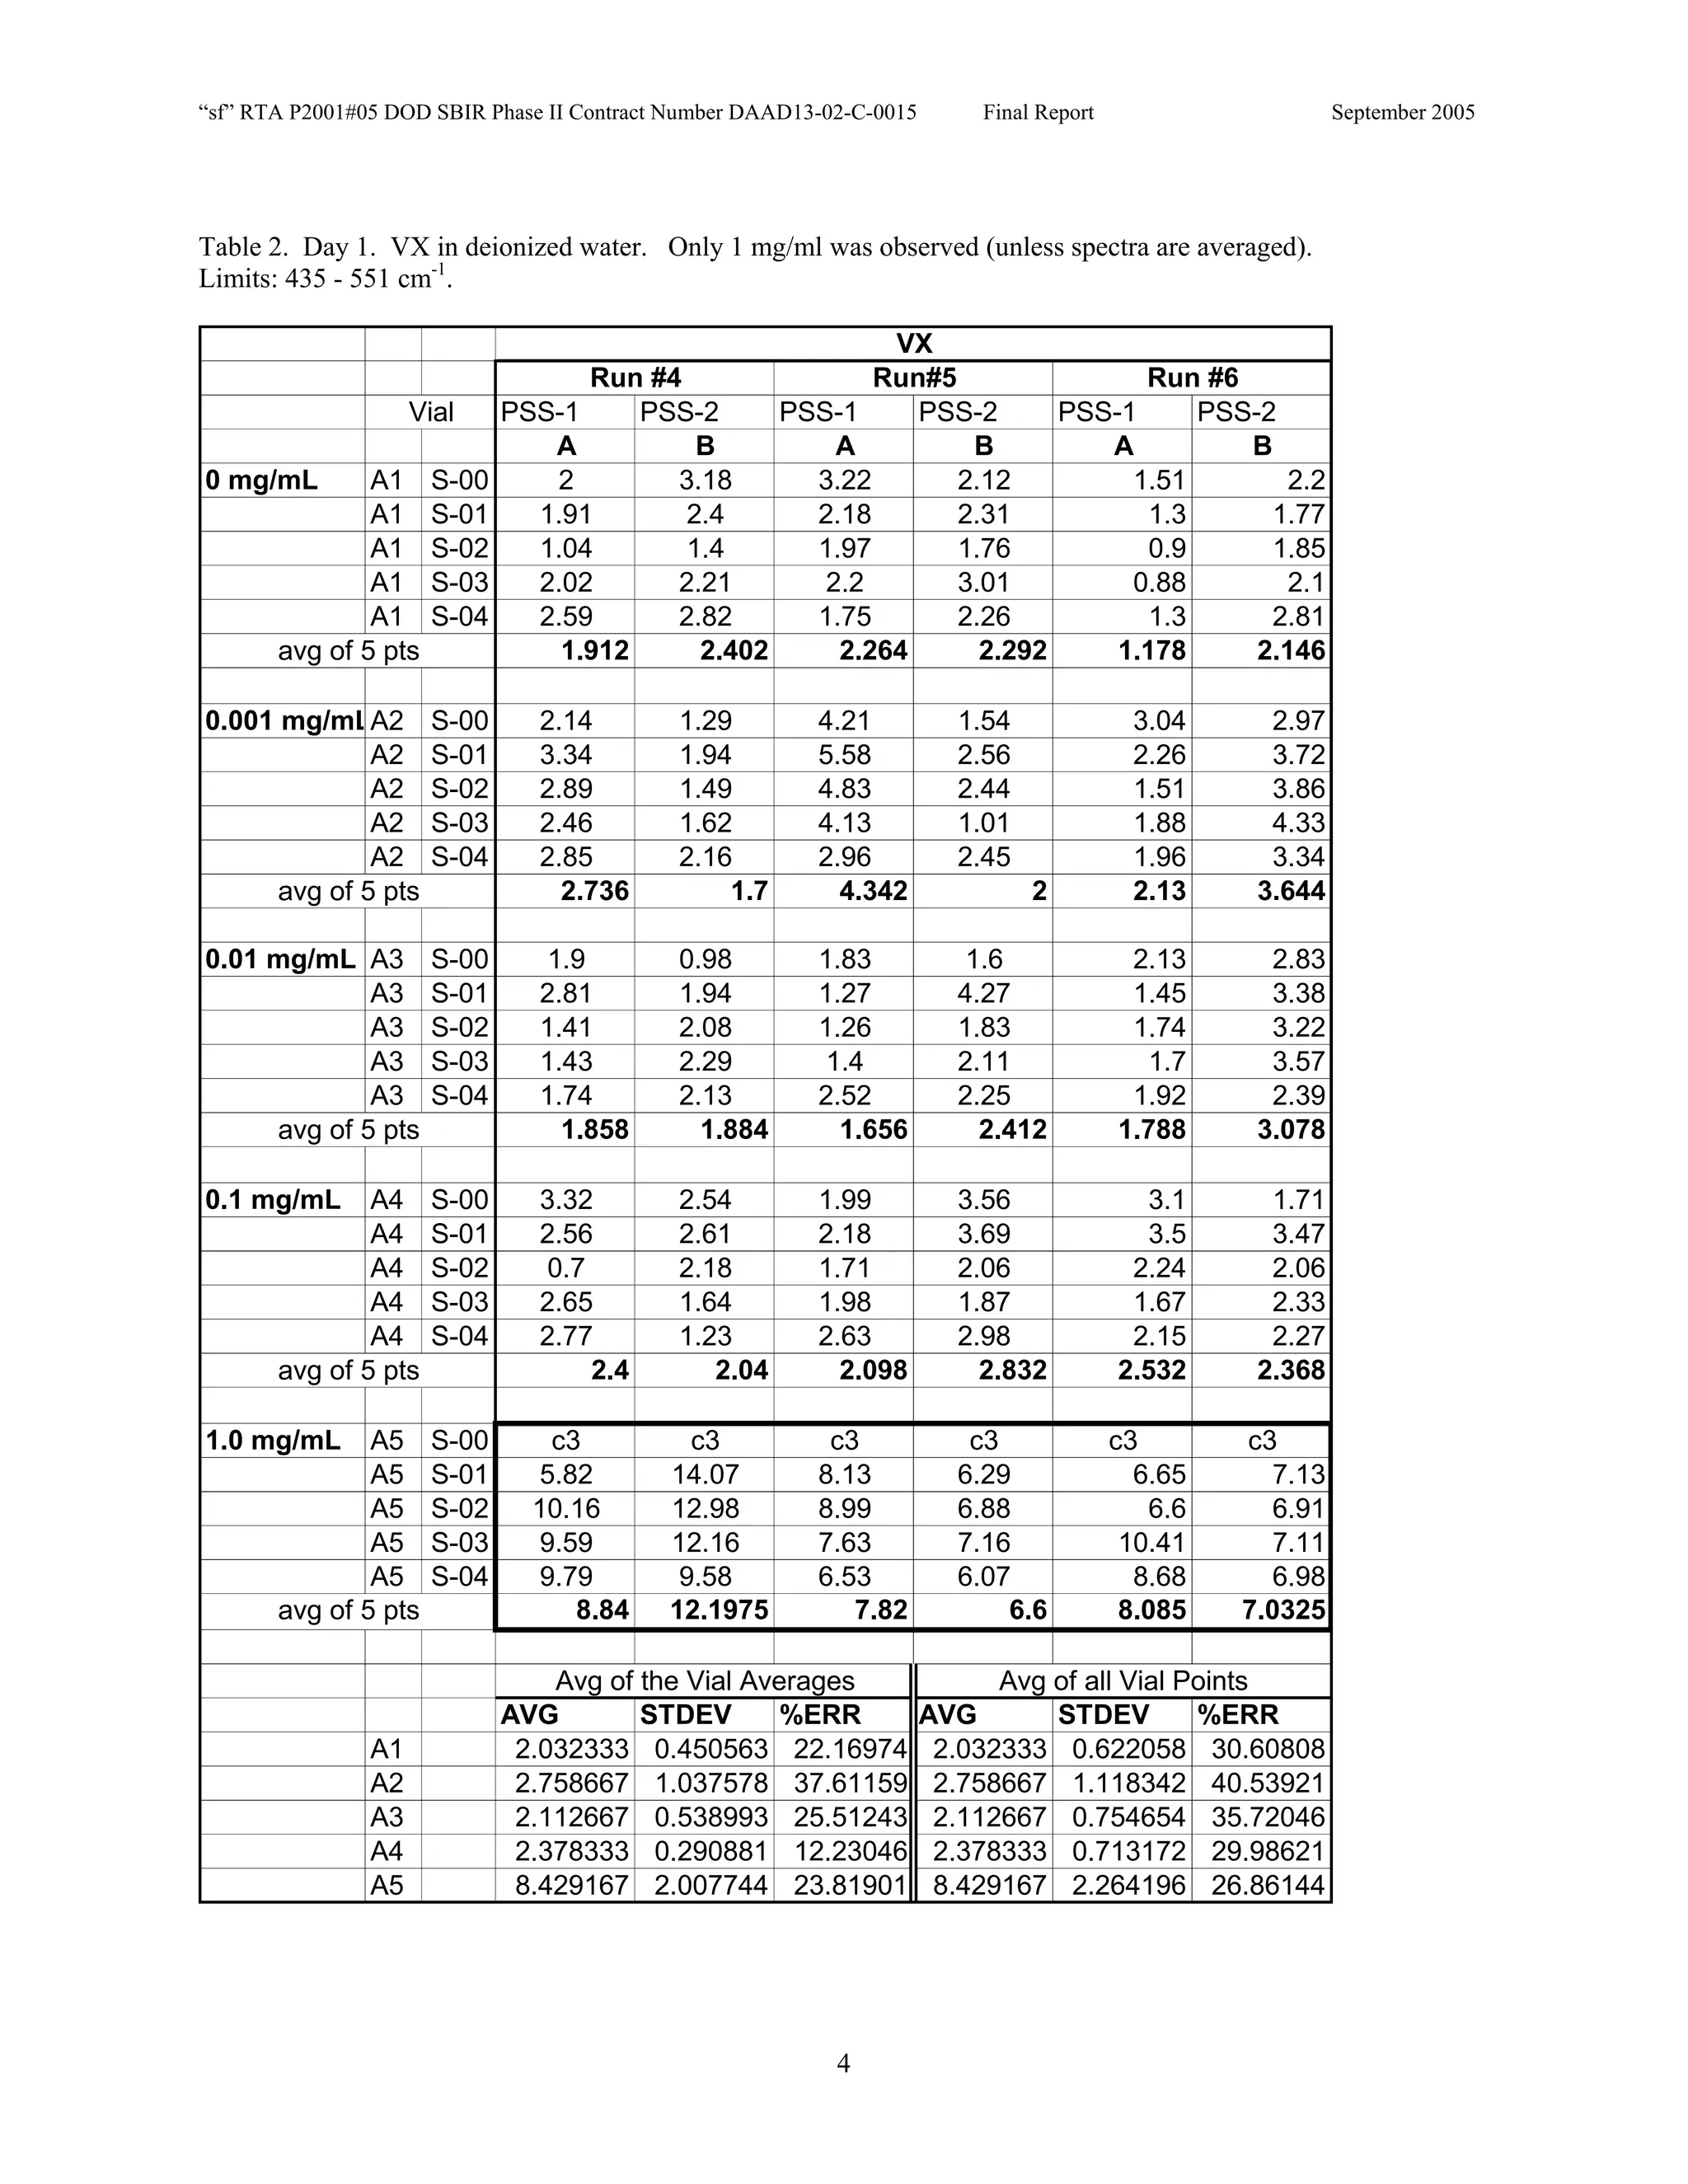
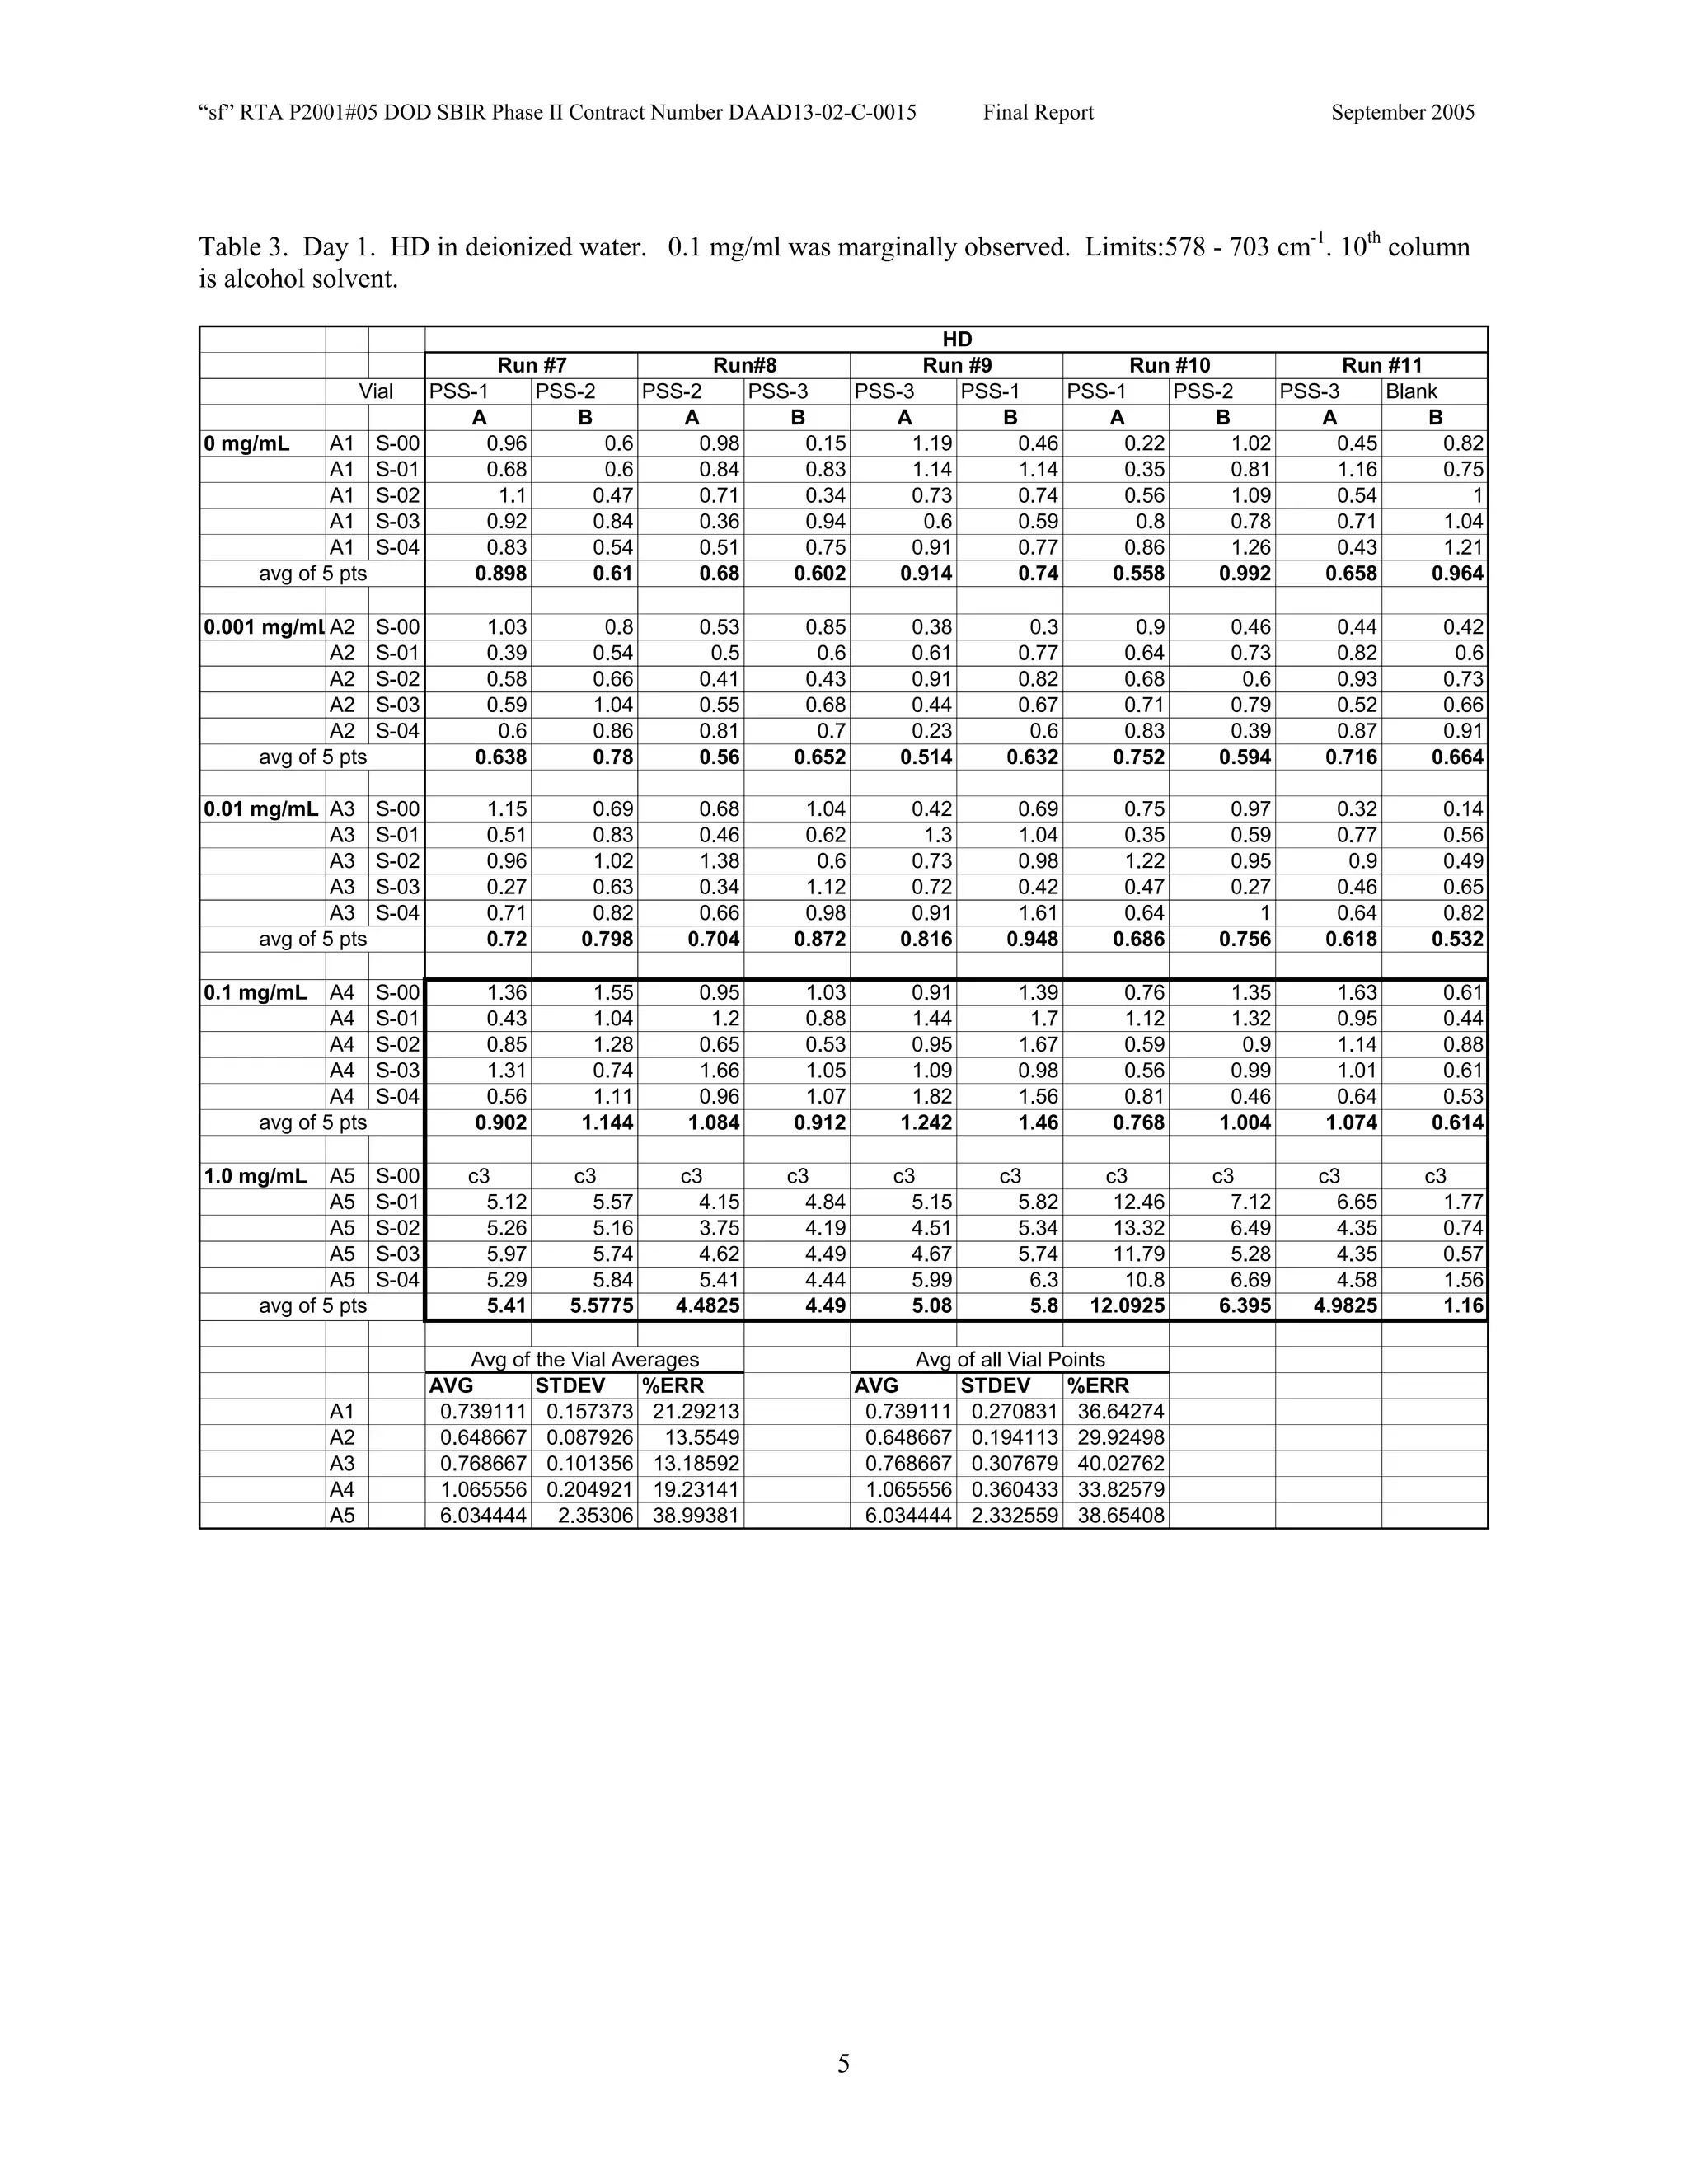
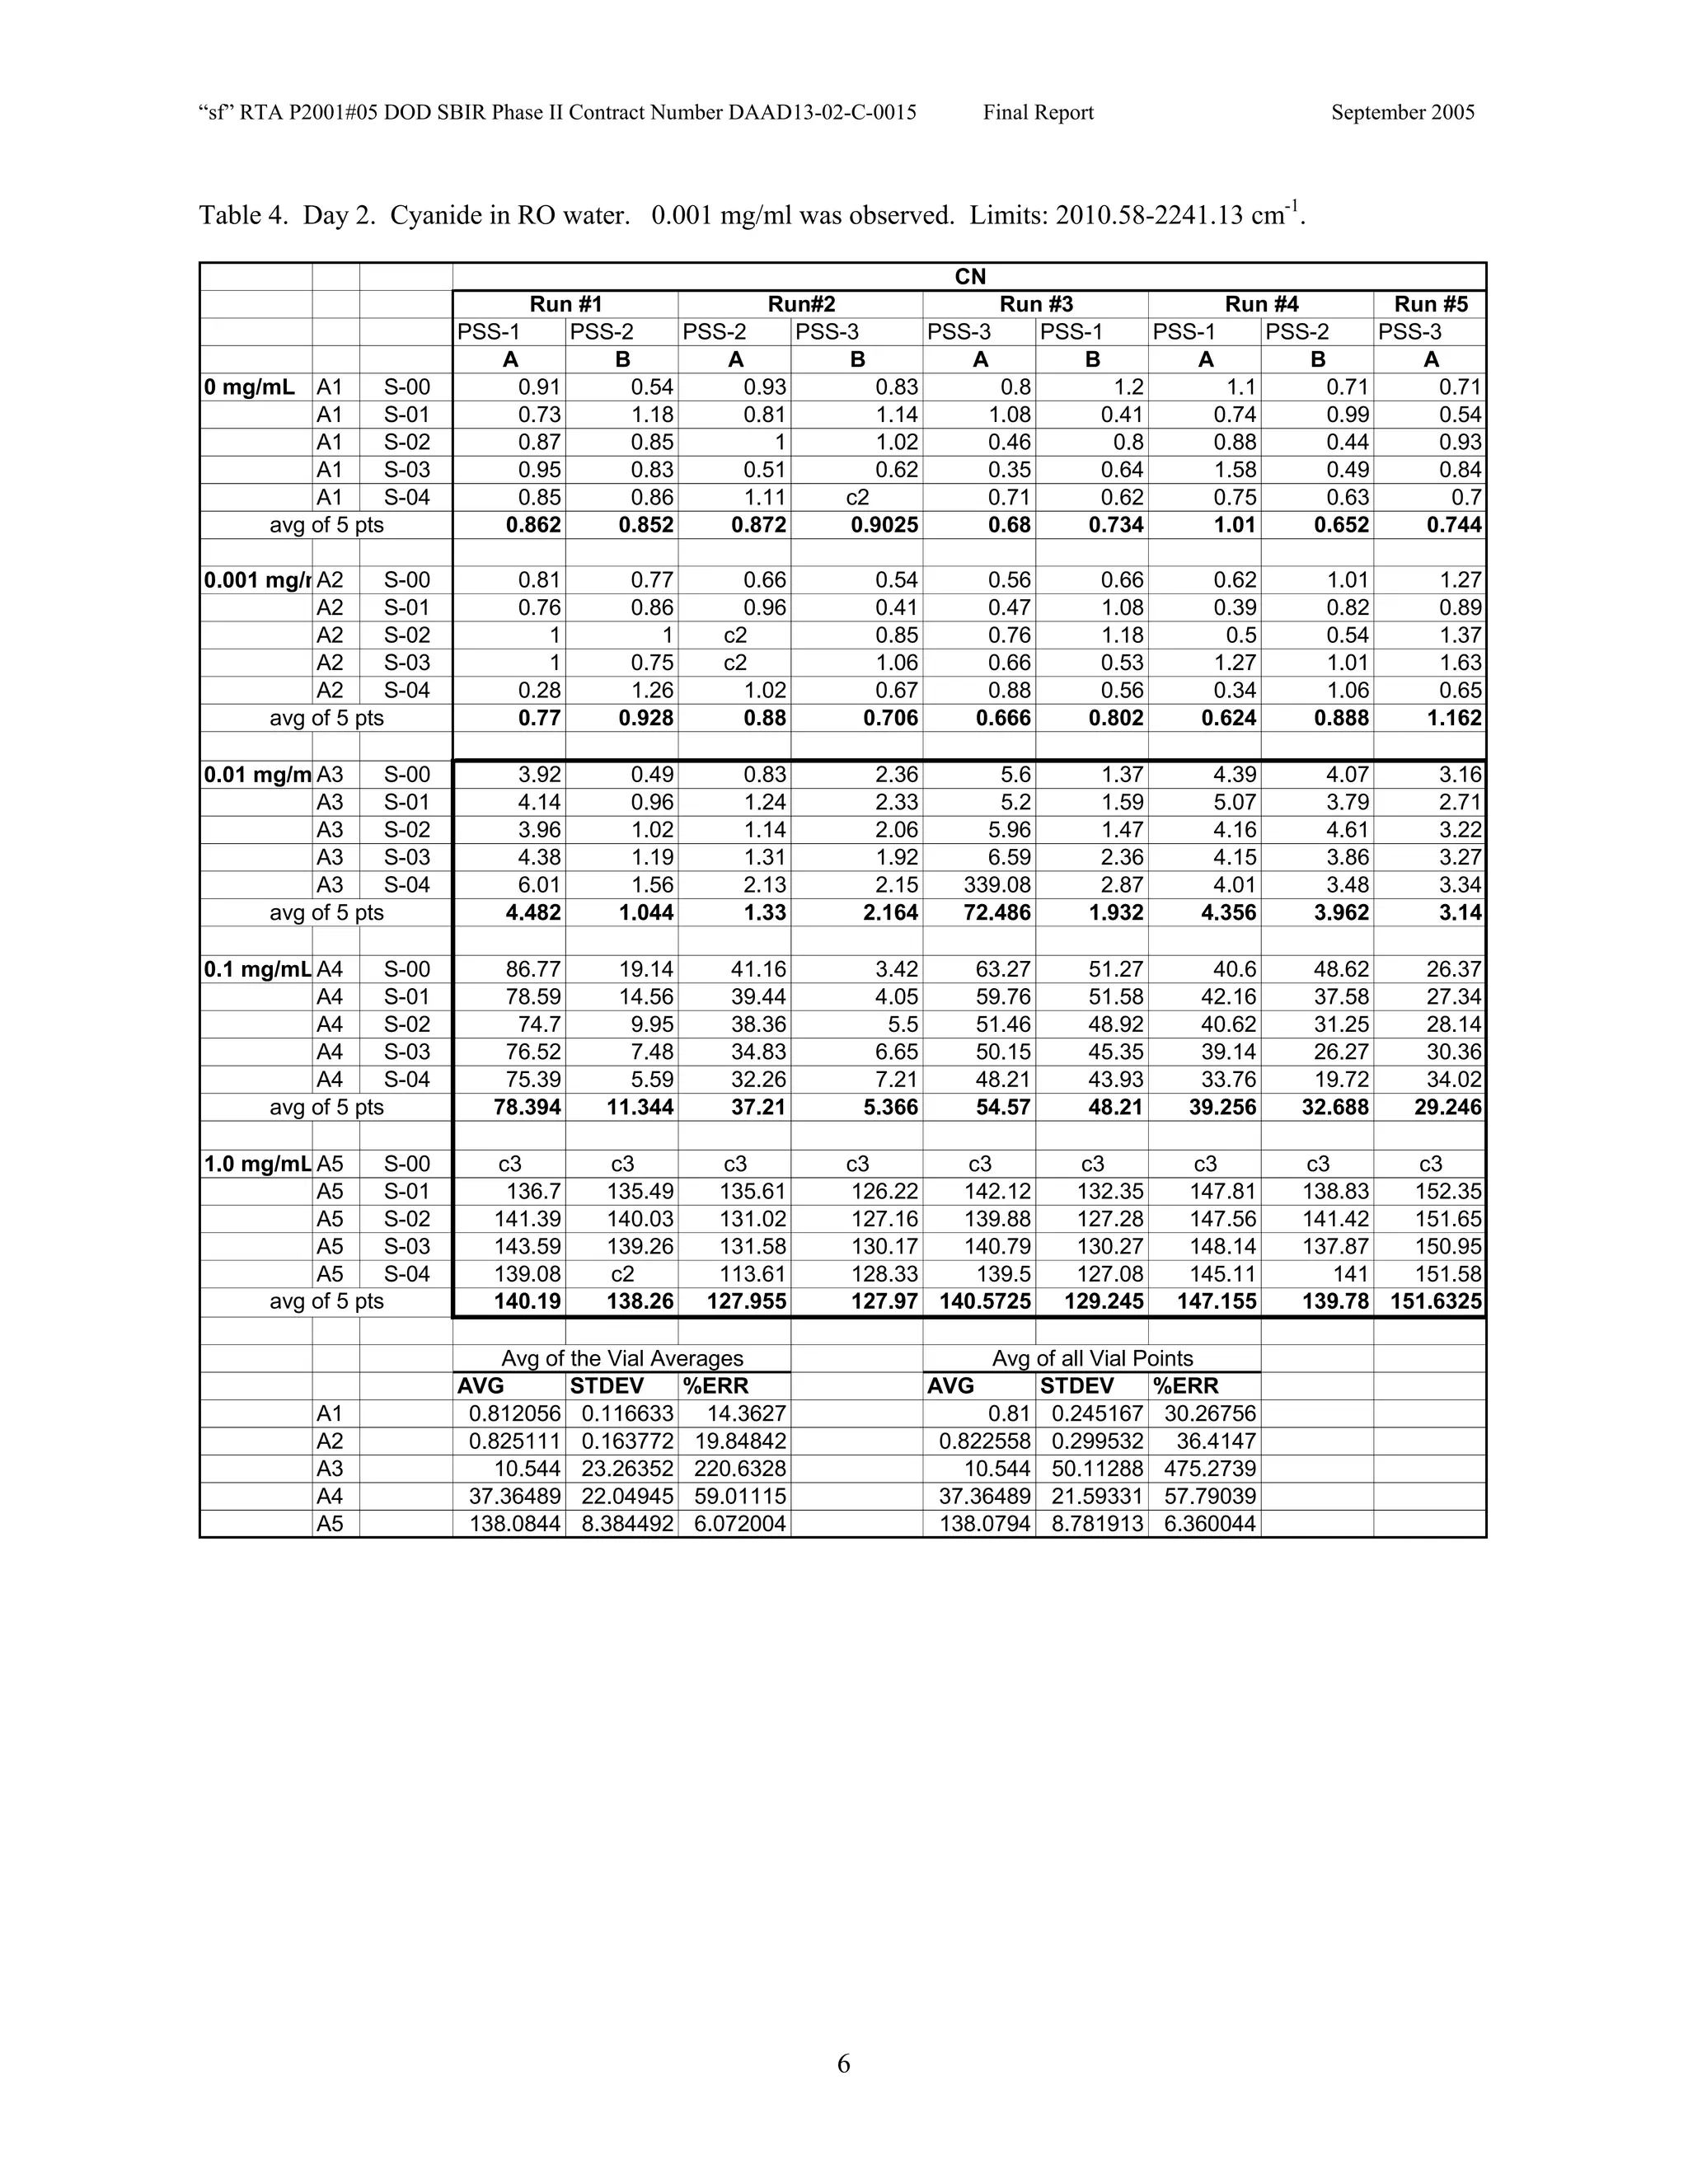
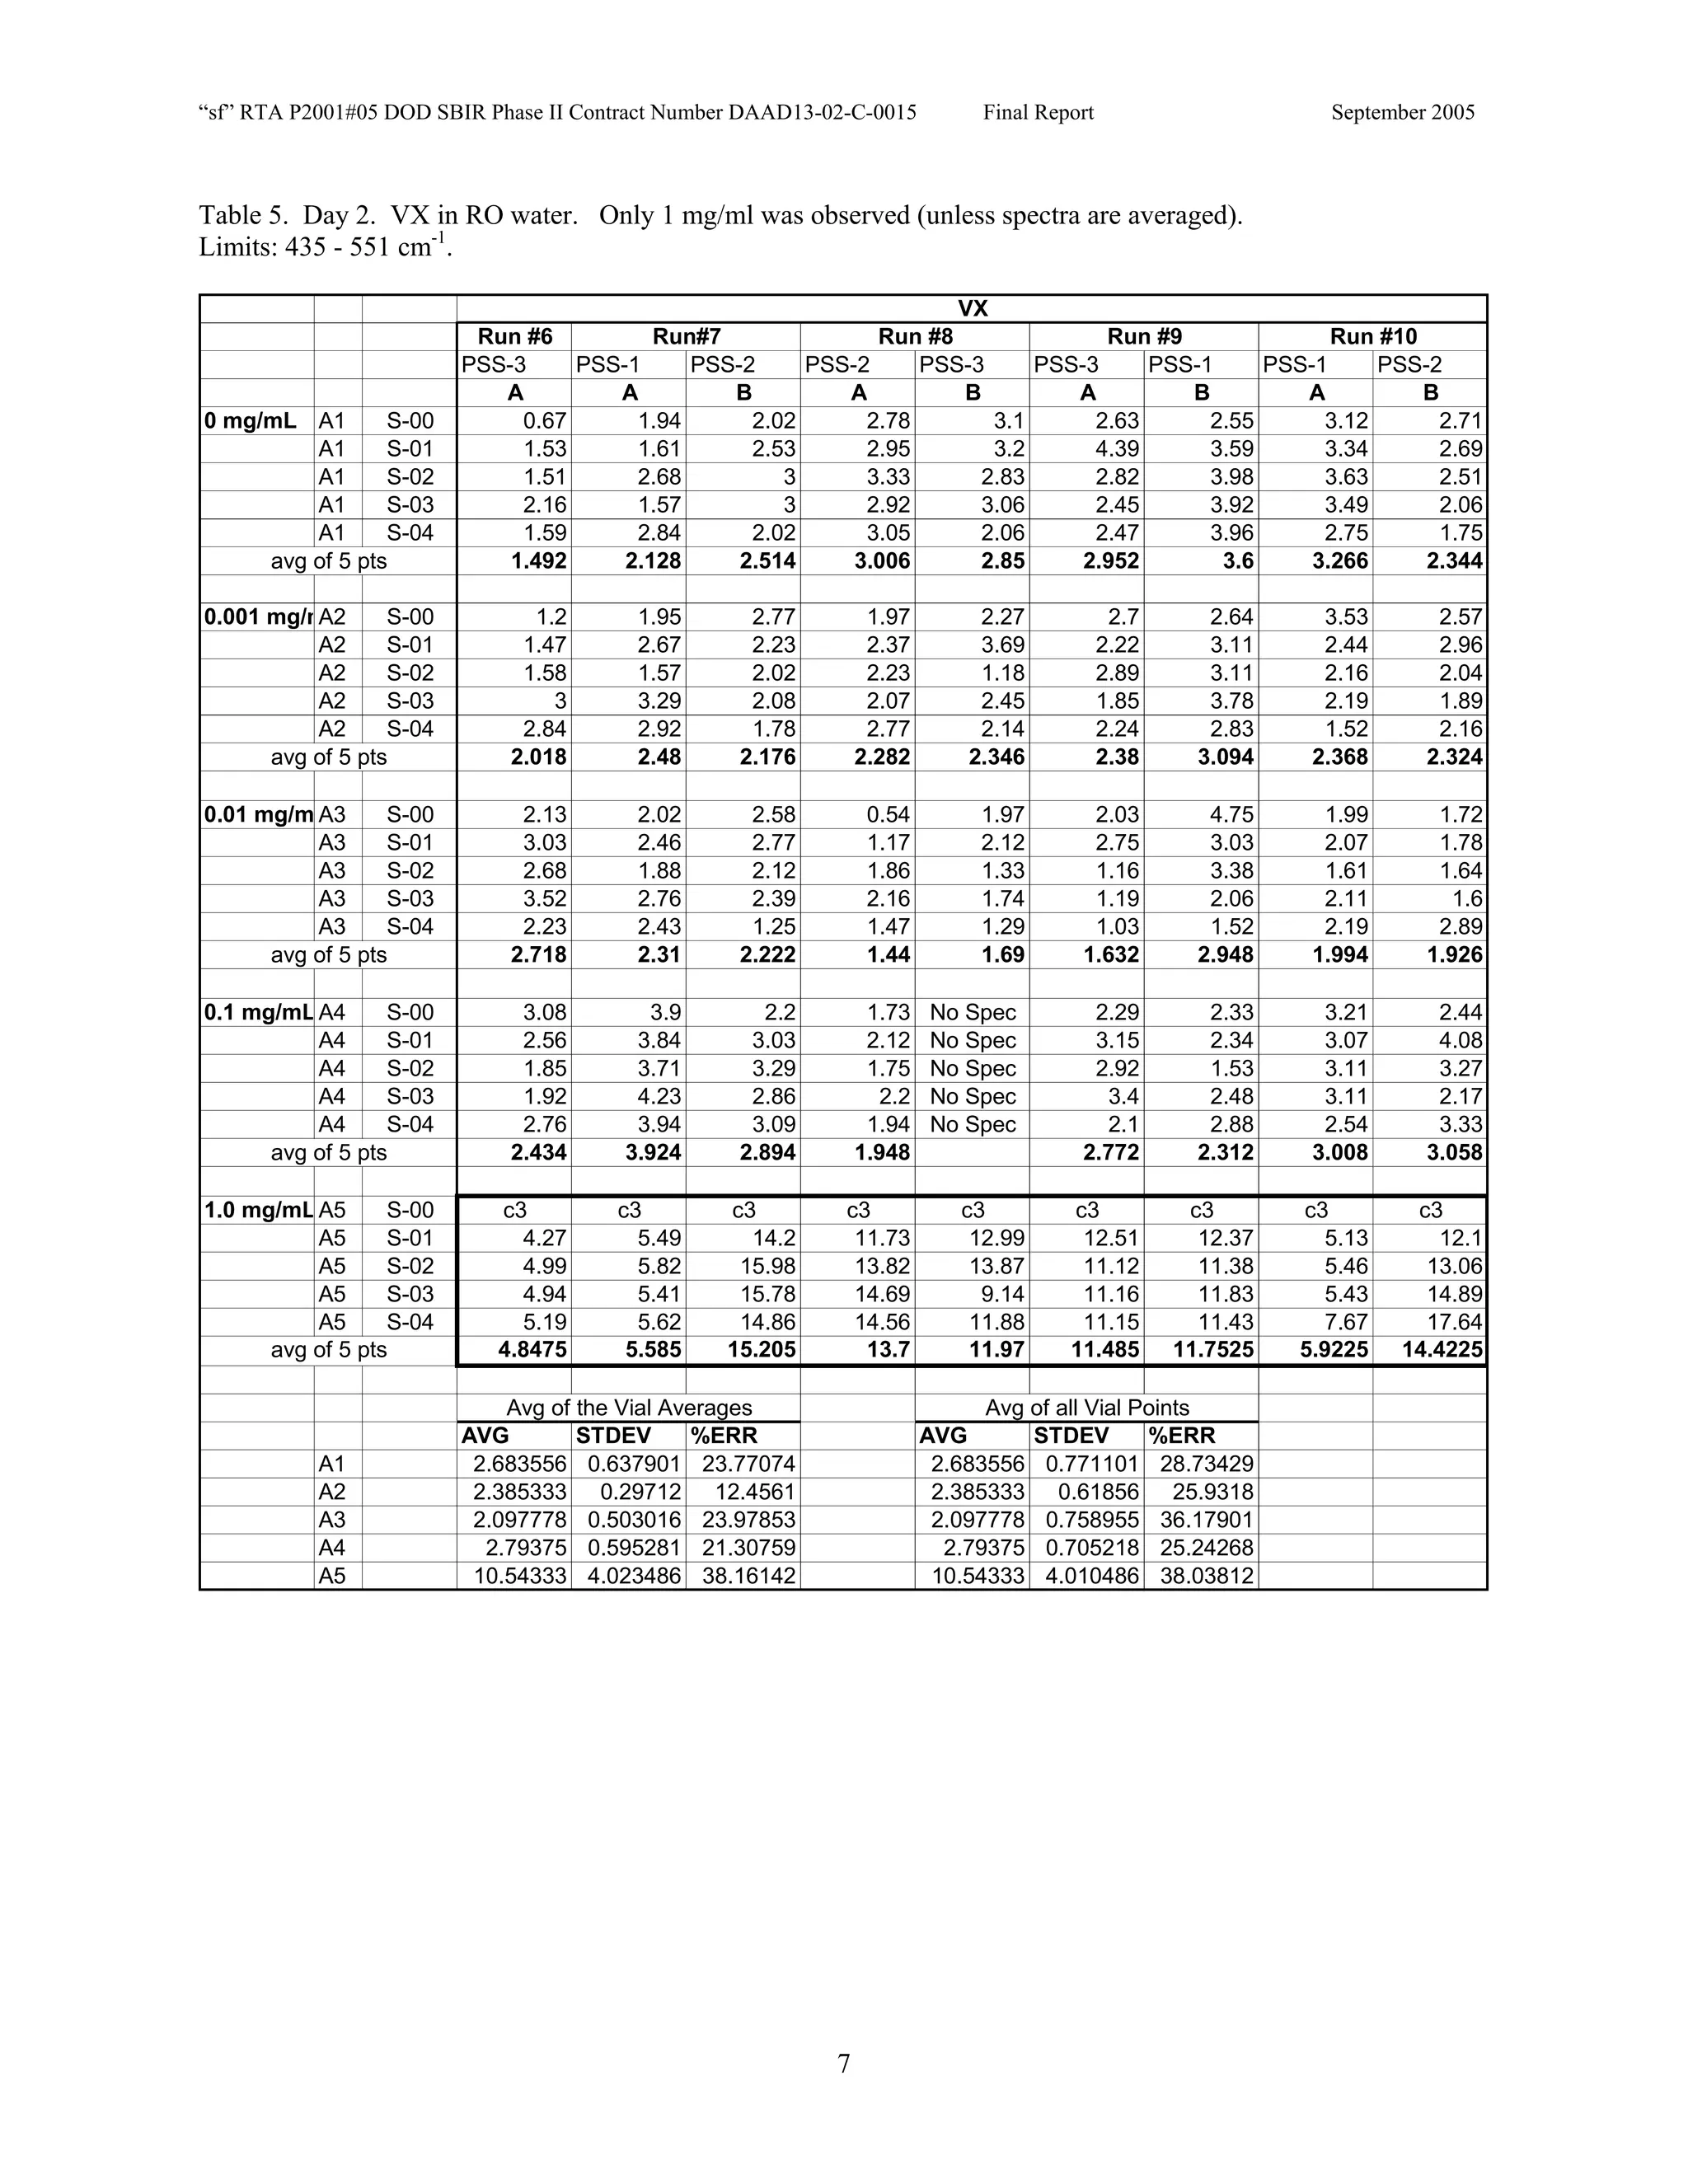
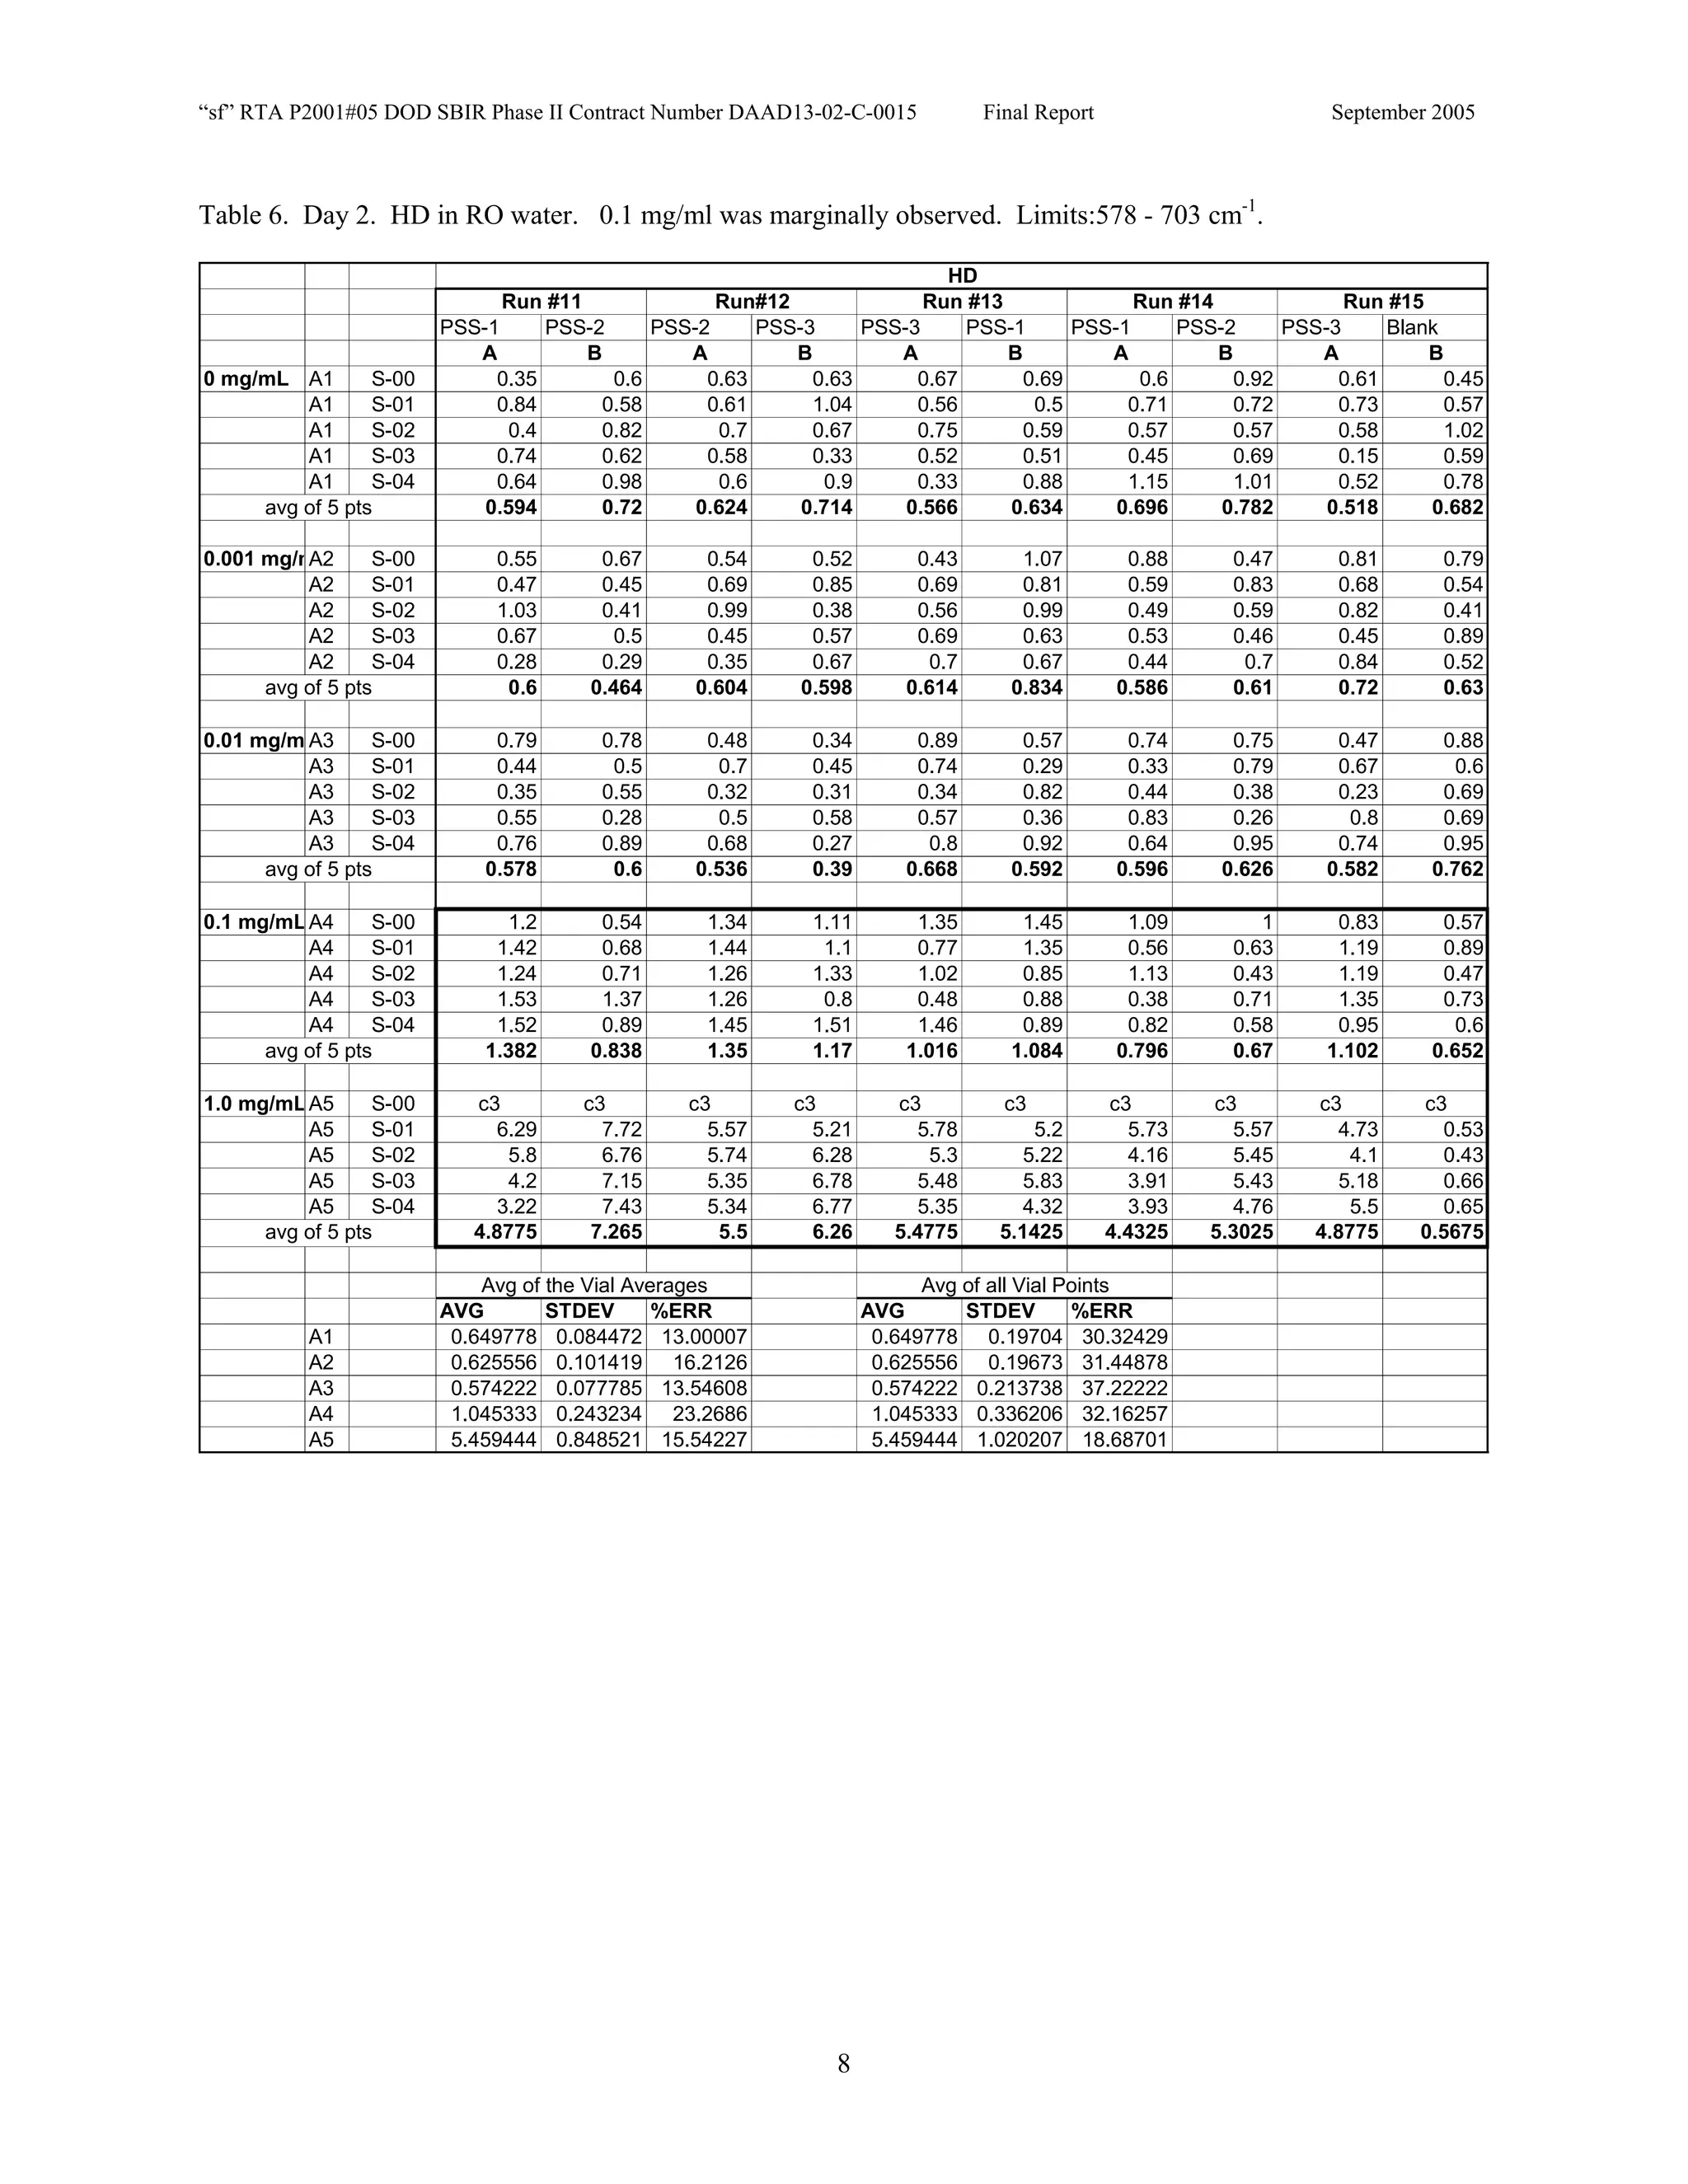
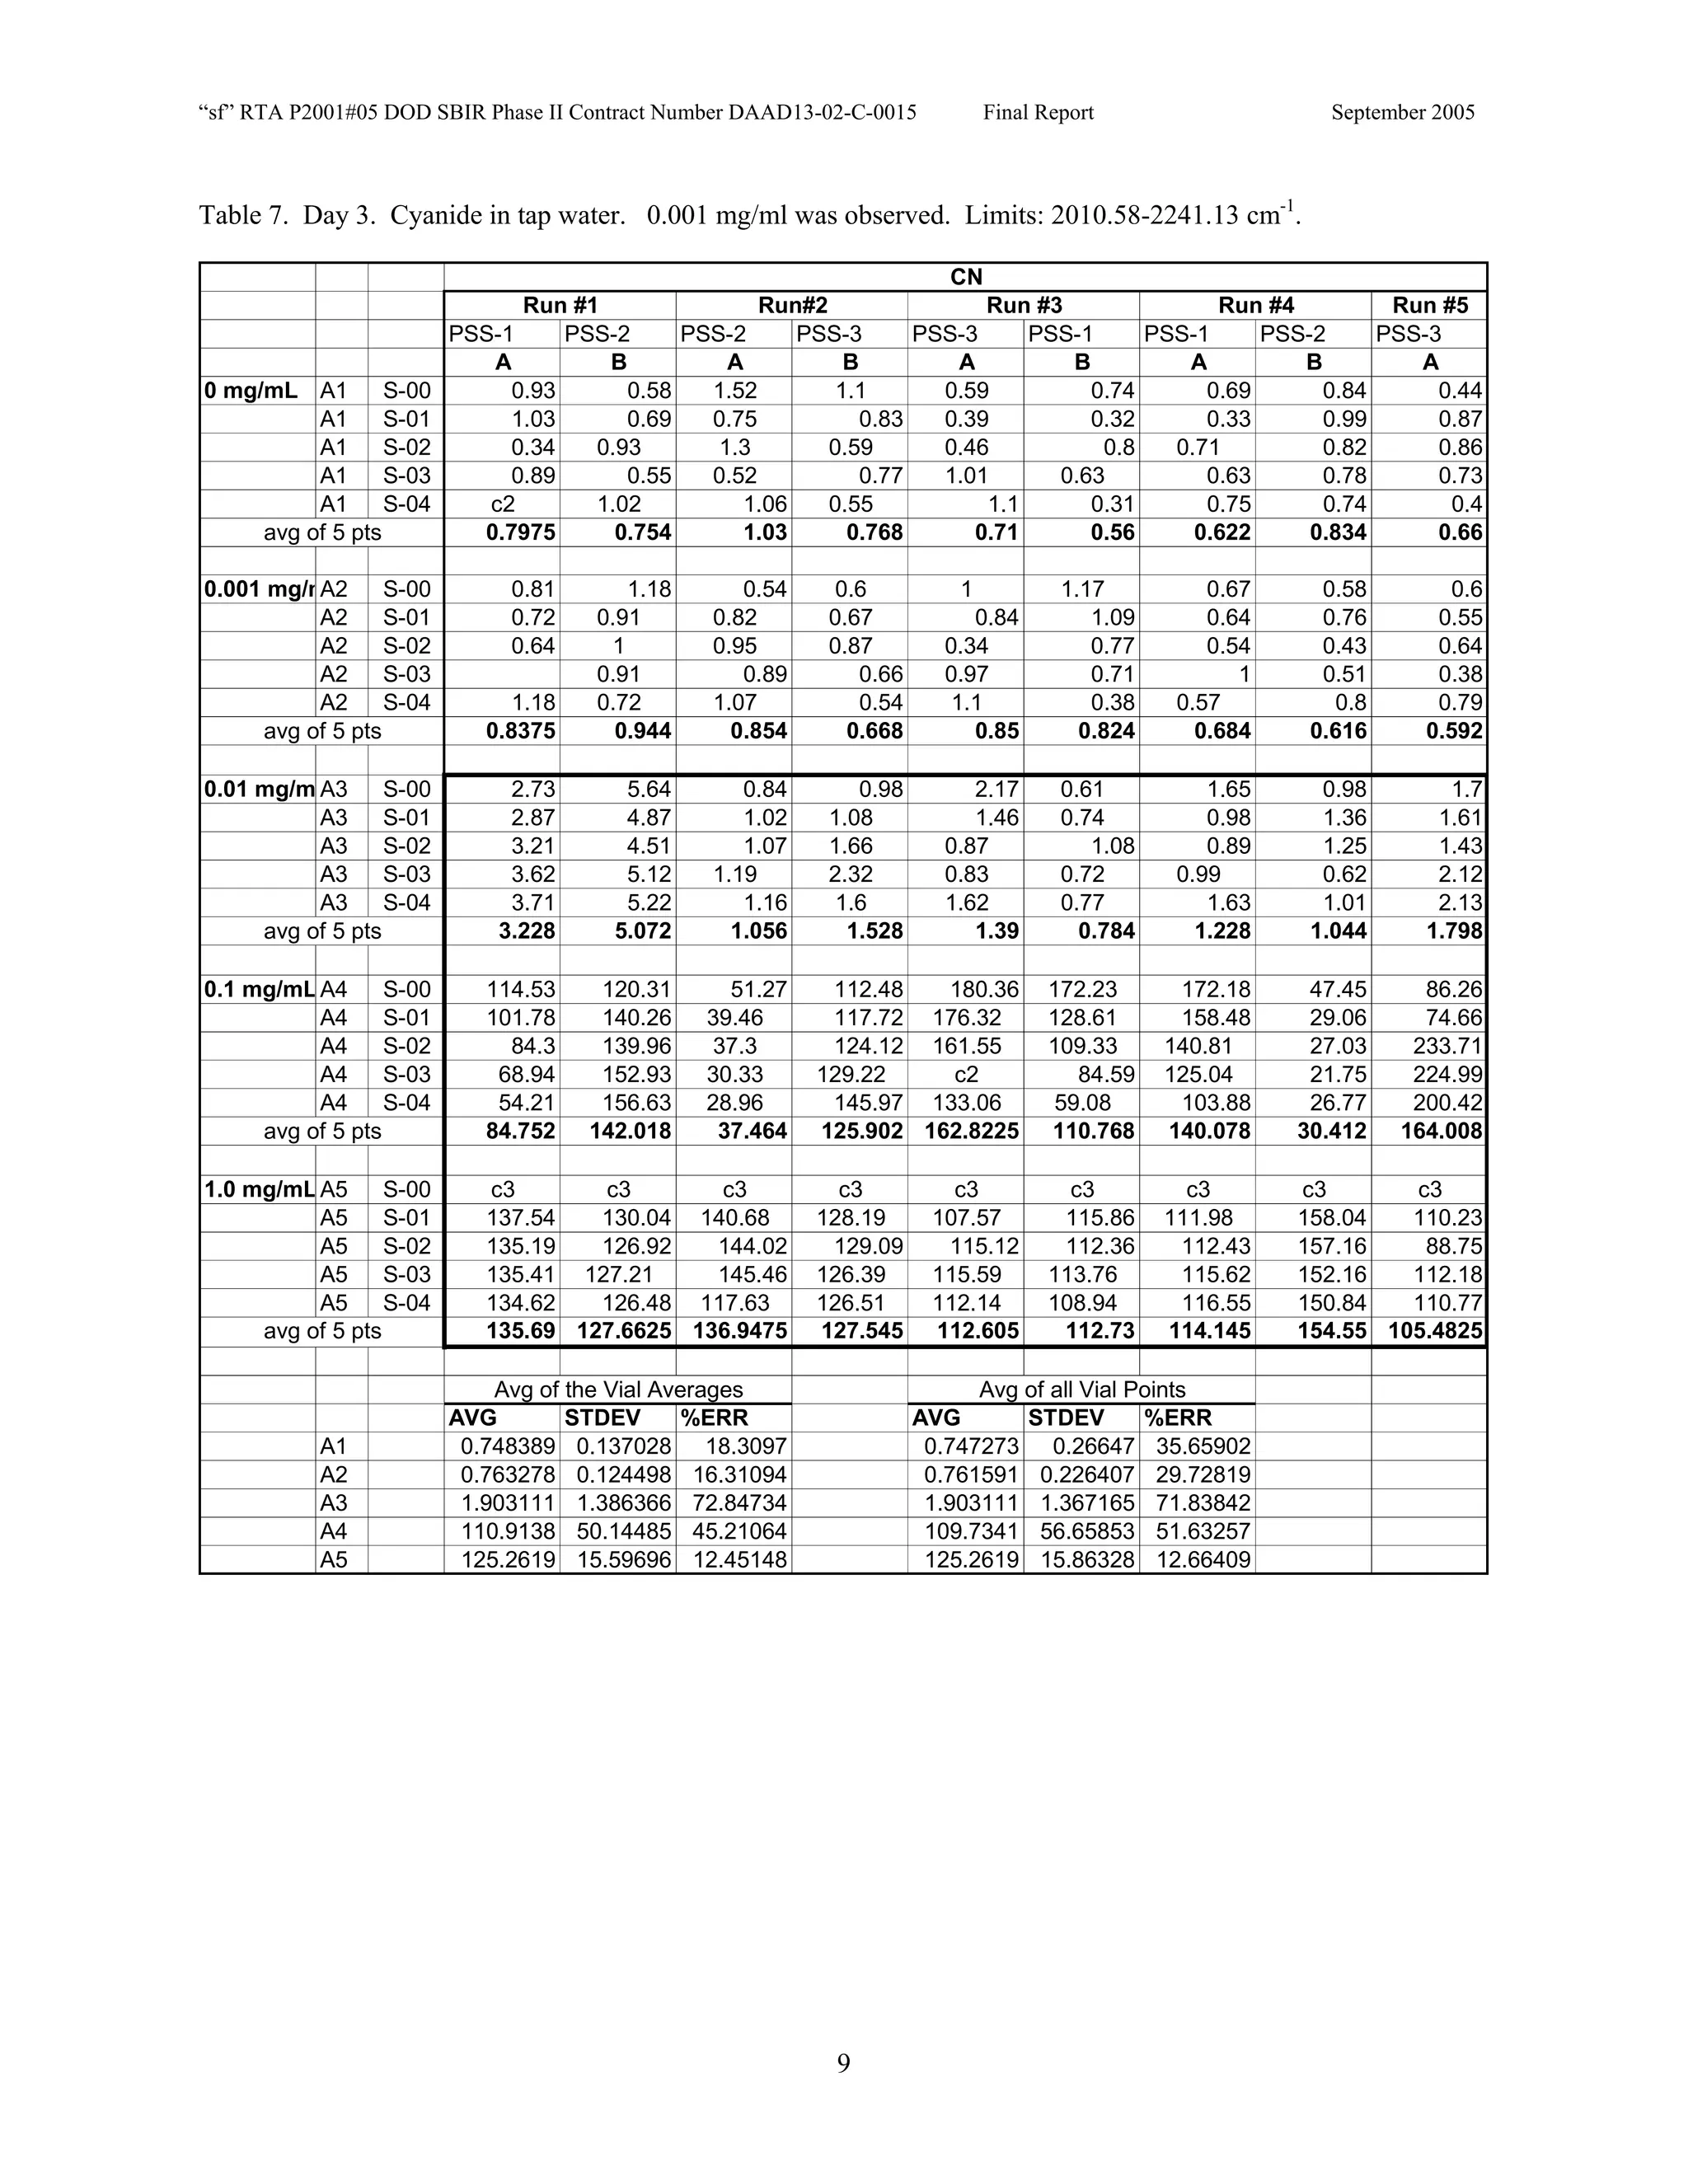
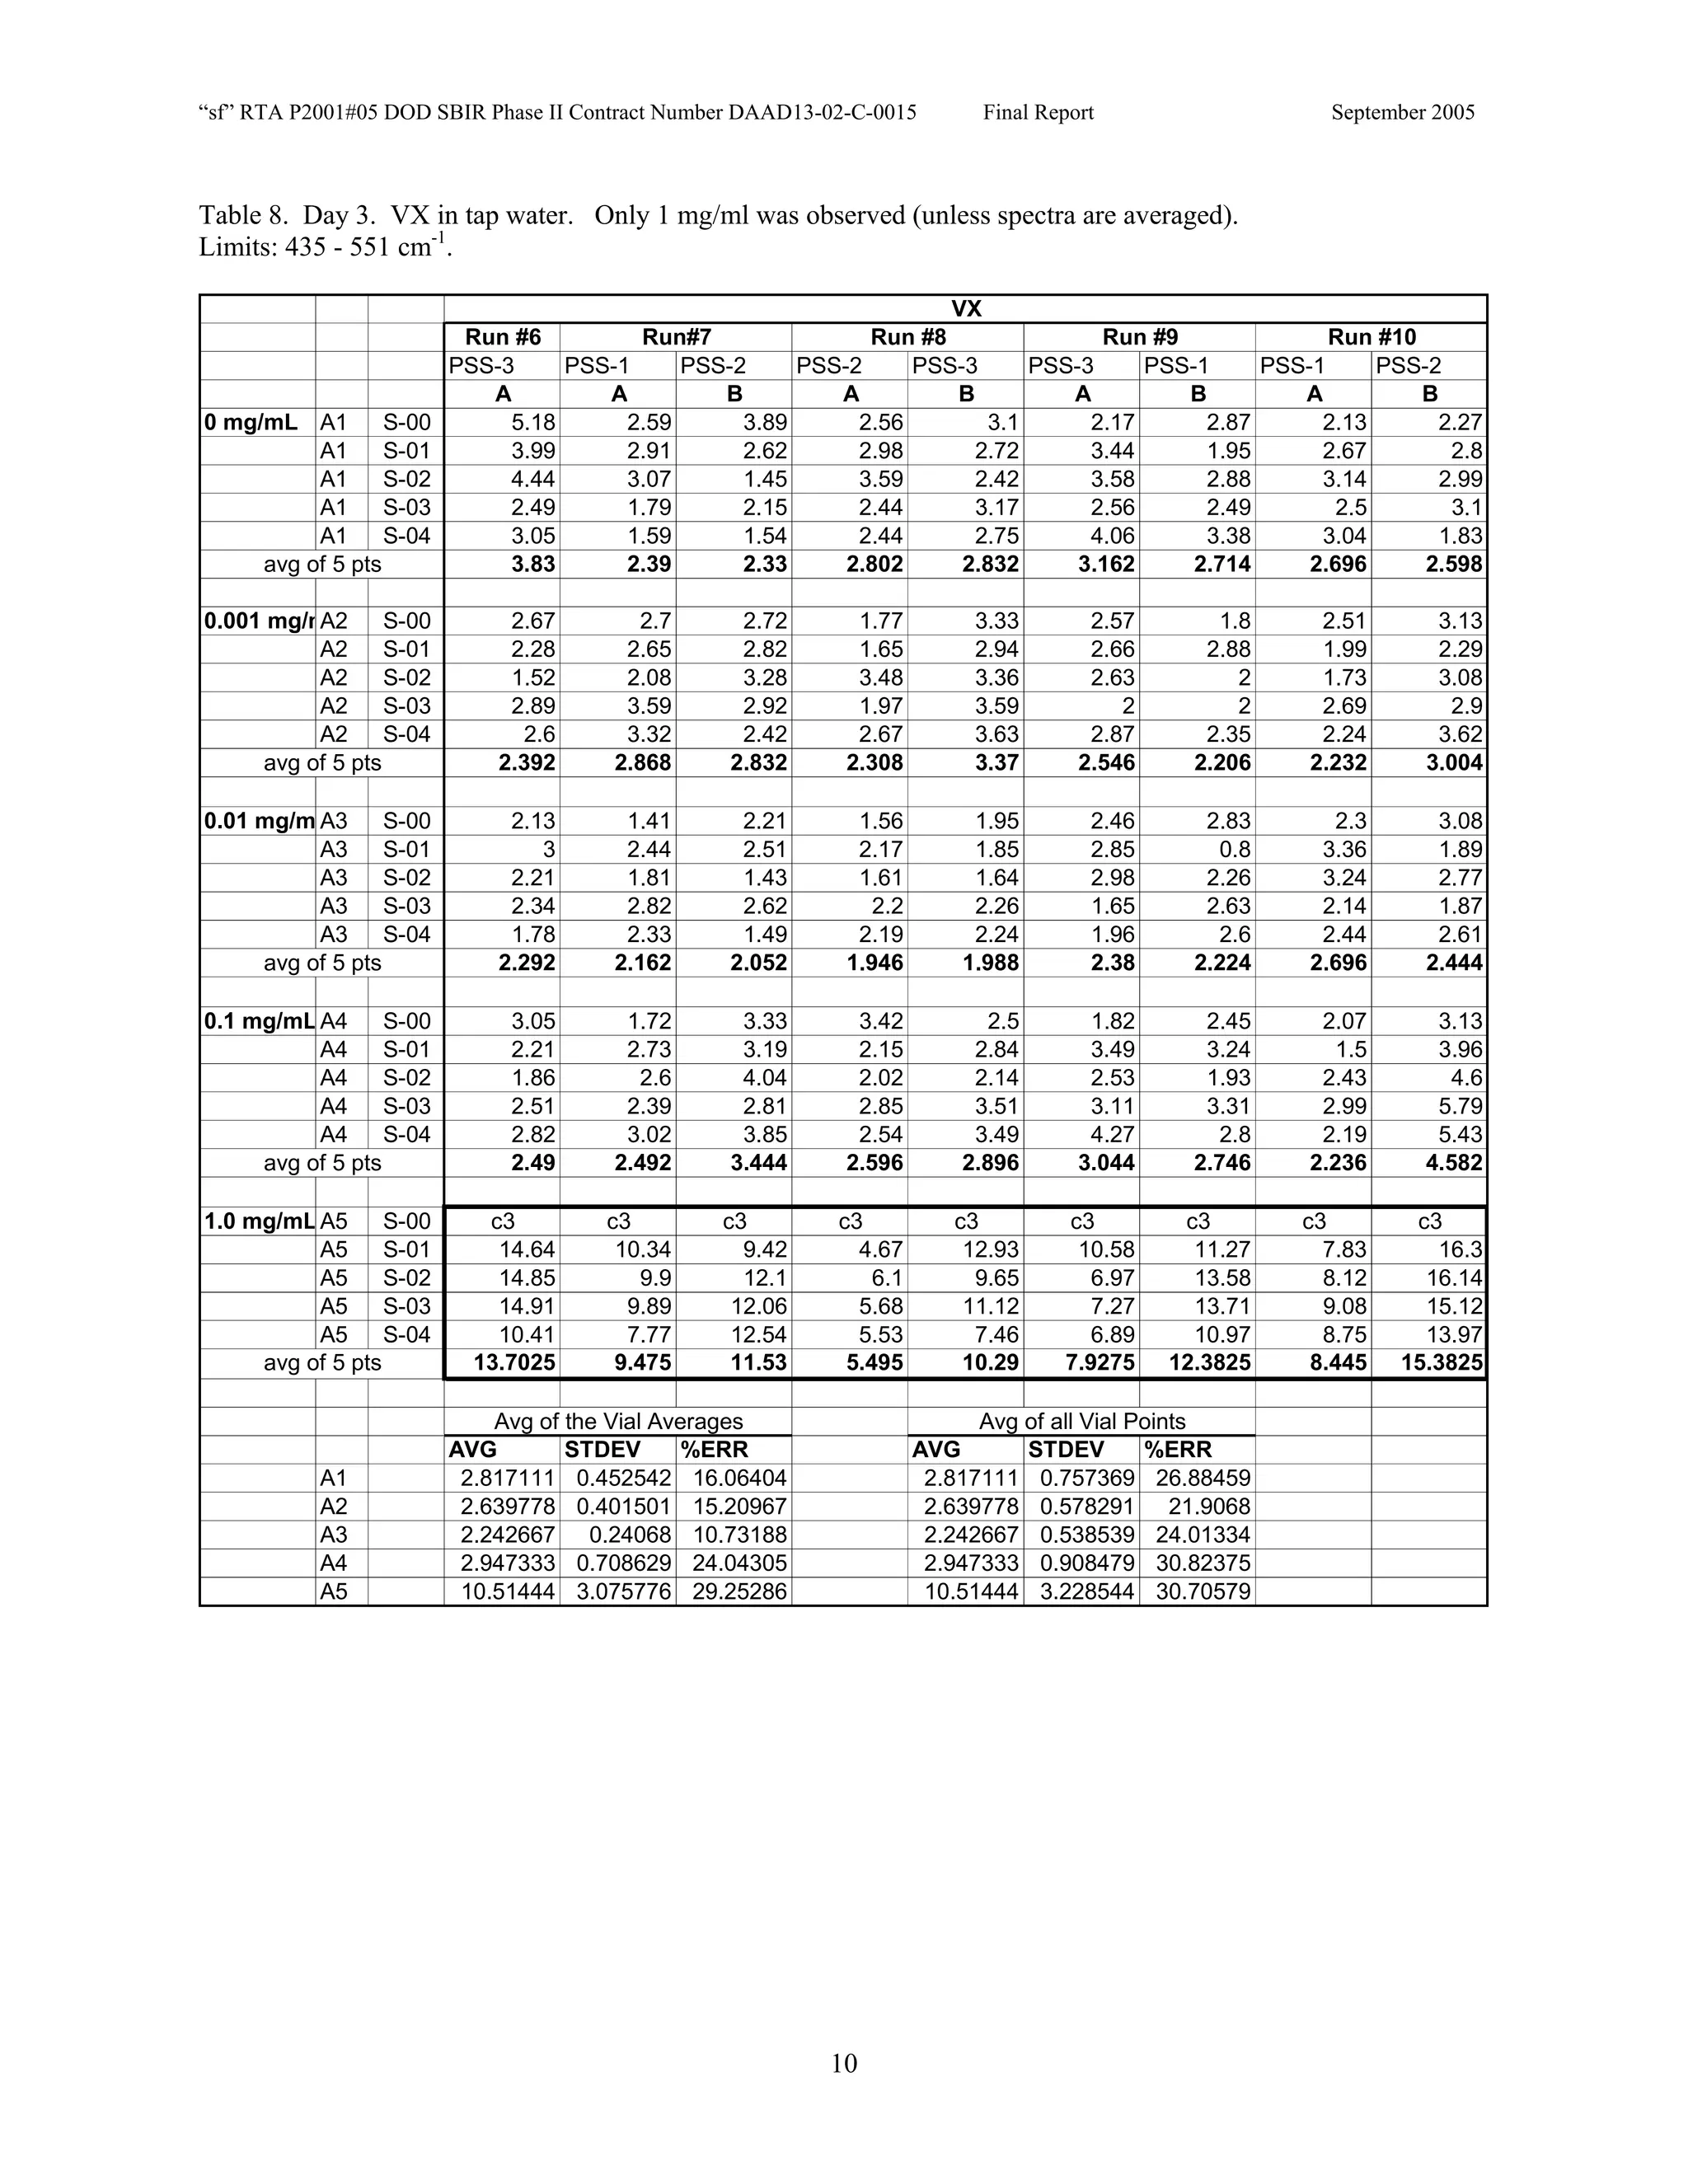
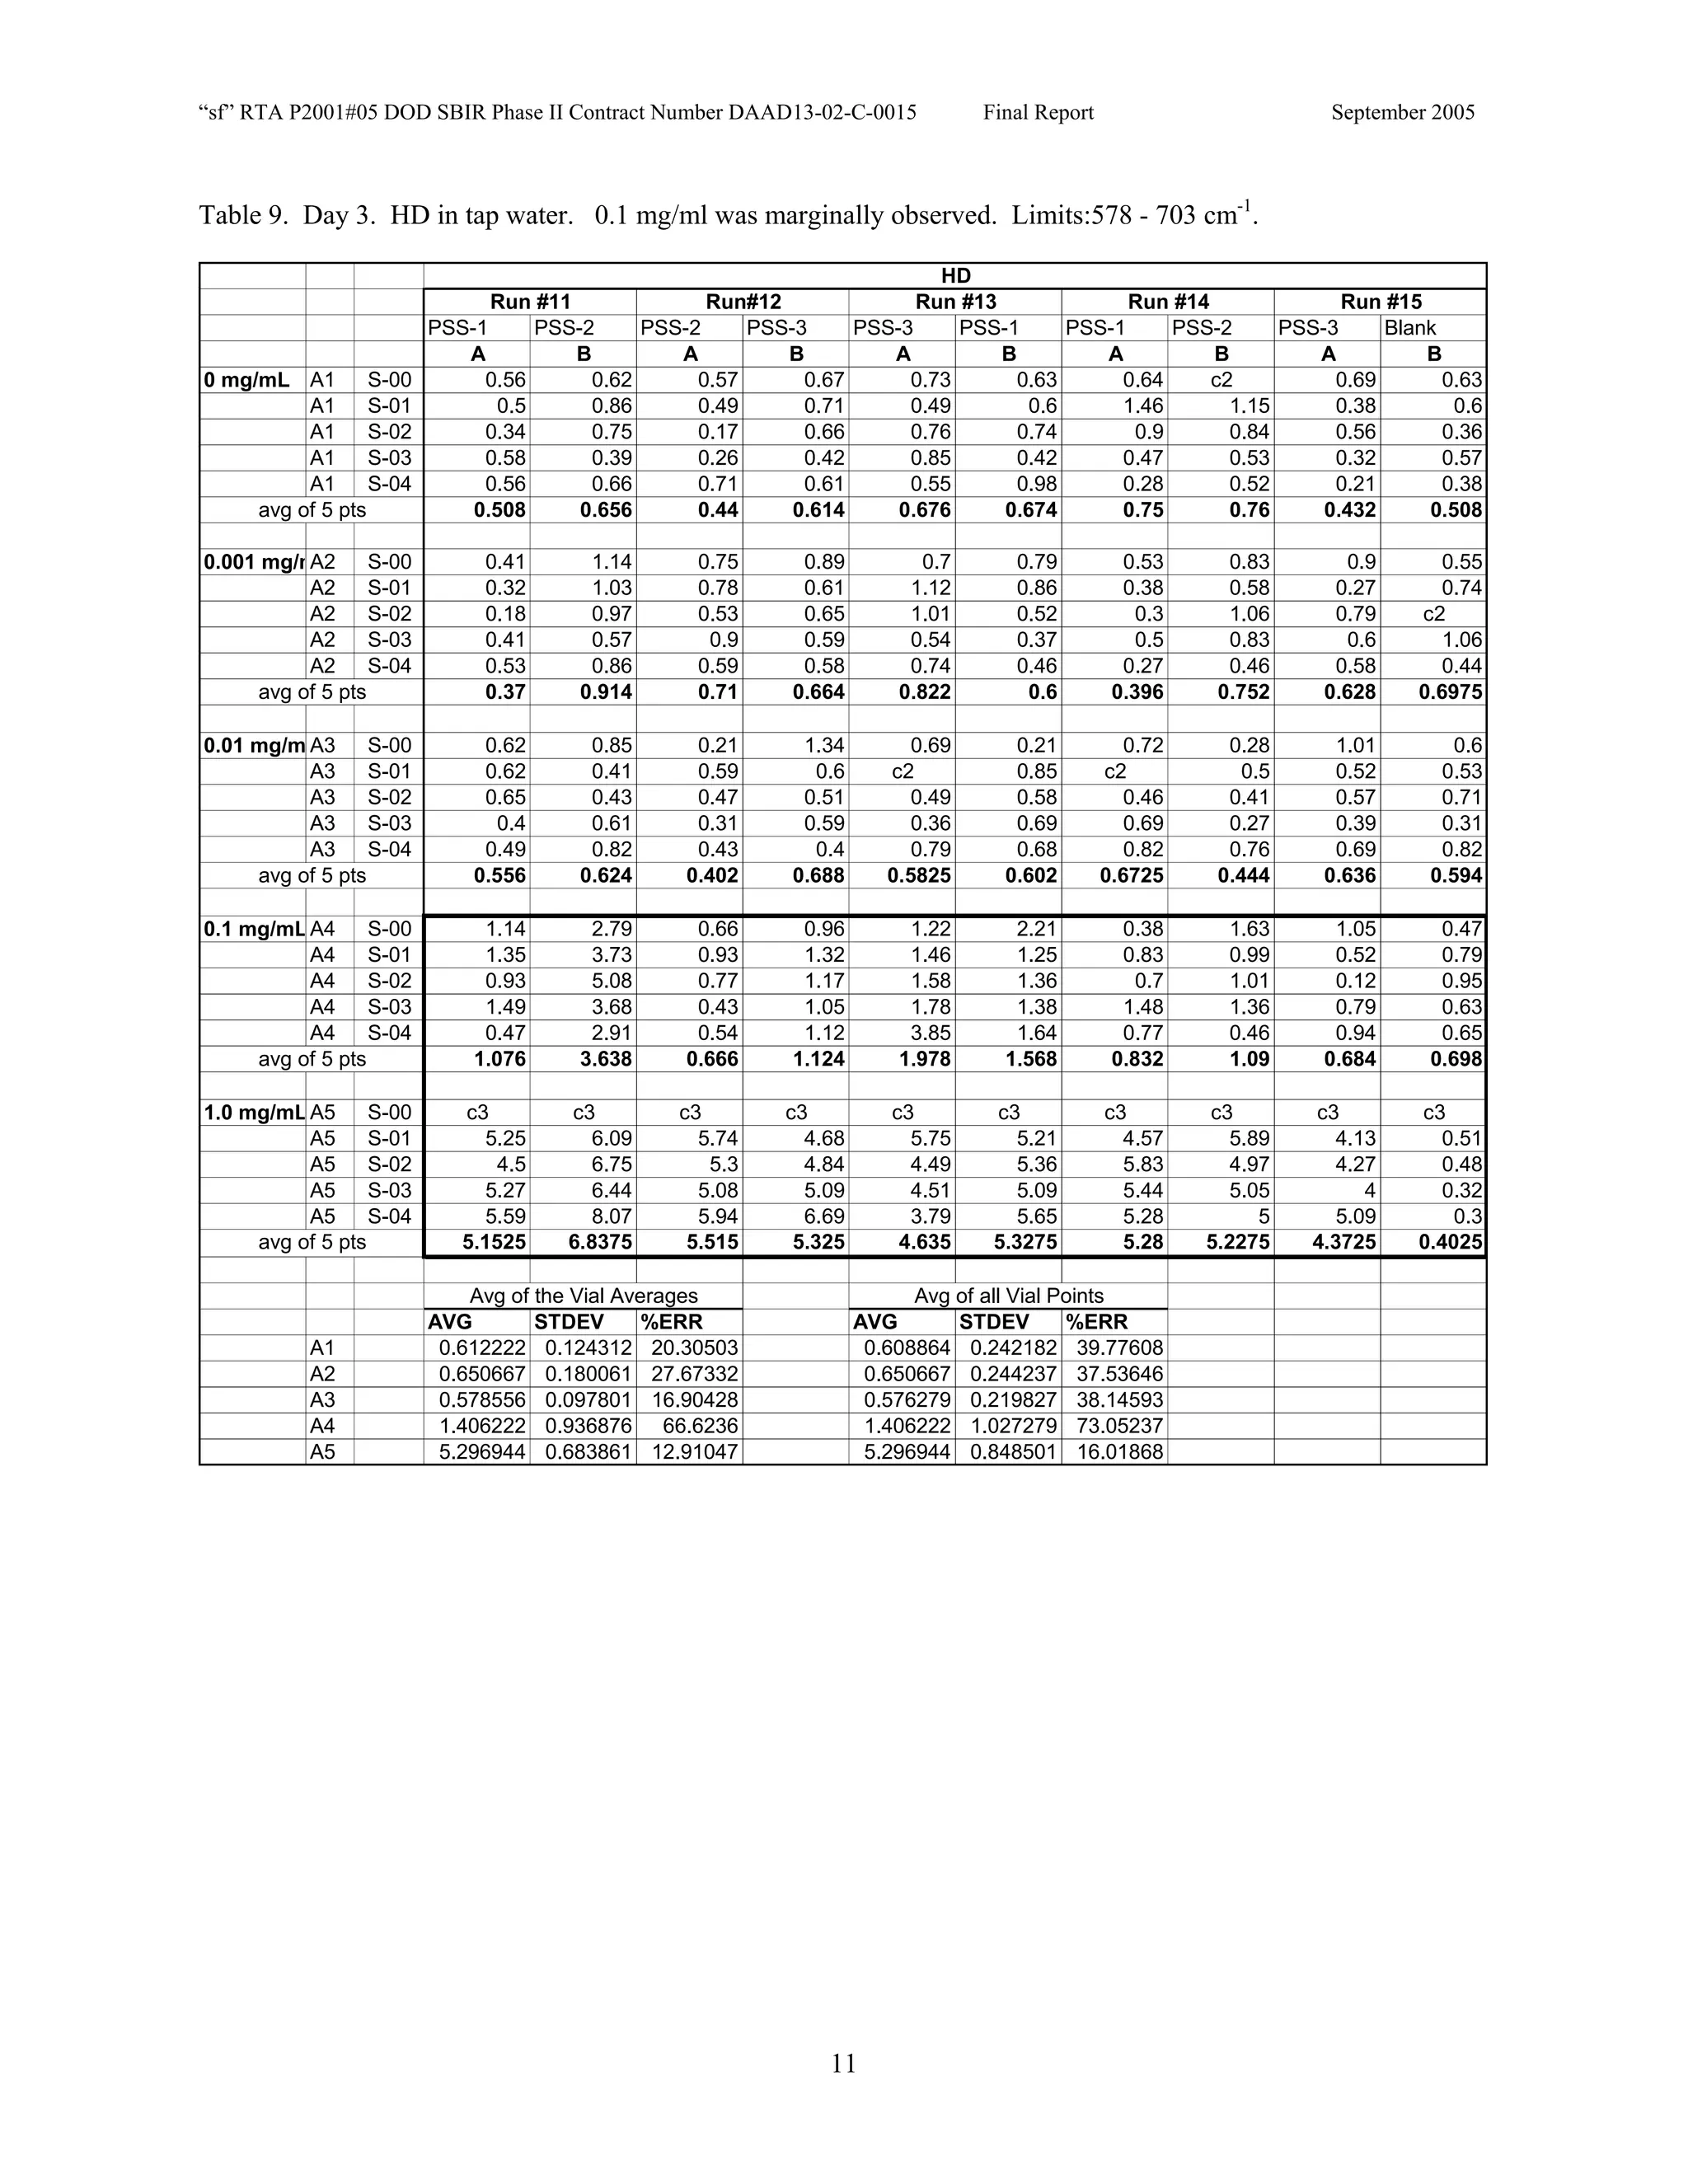
![Appendix P
EDGEWOOD DATA
Tables of SERS data collected during tests of CN, HD, and VX in water collected at Aberdeen (9/10-12/2002).
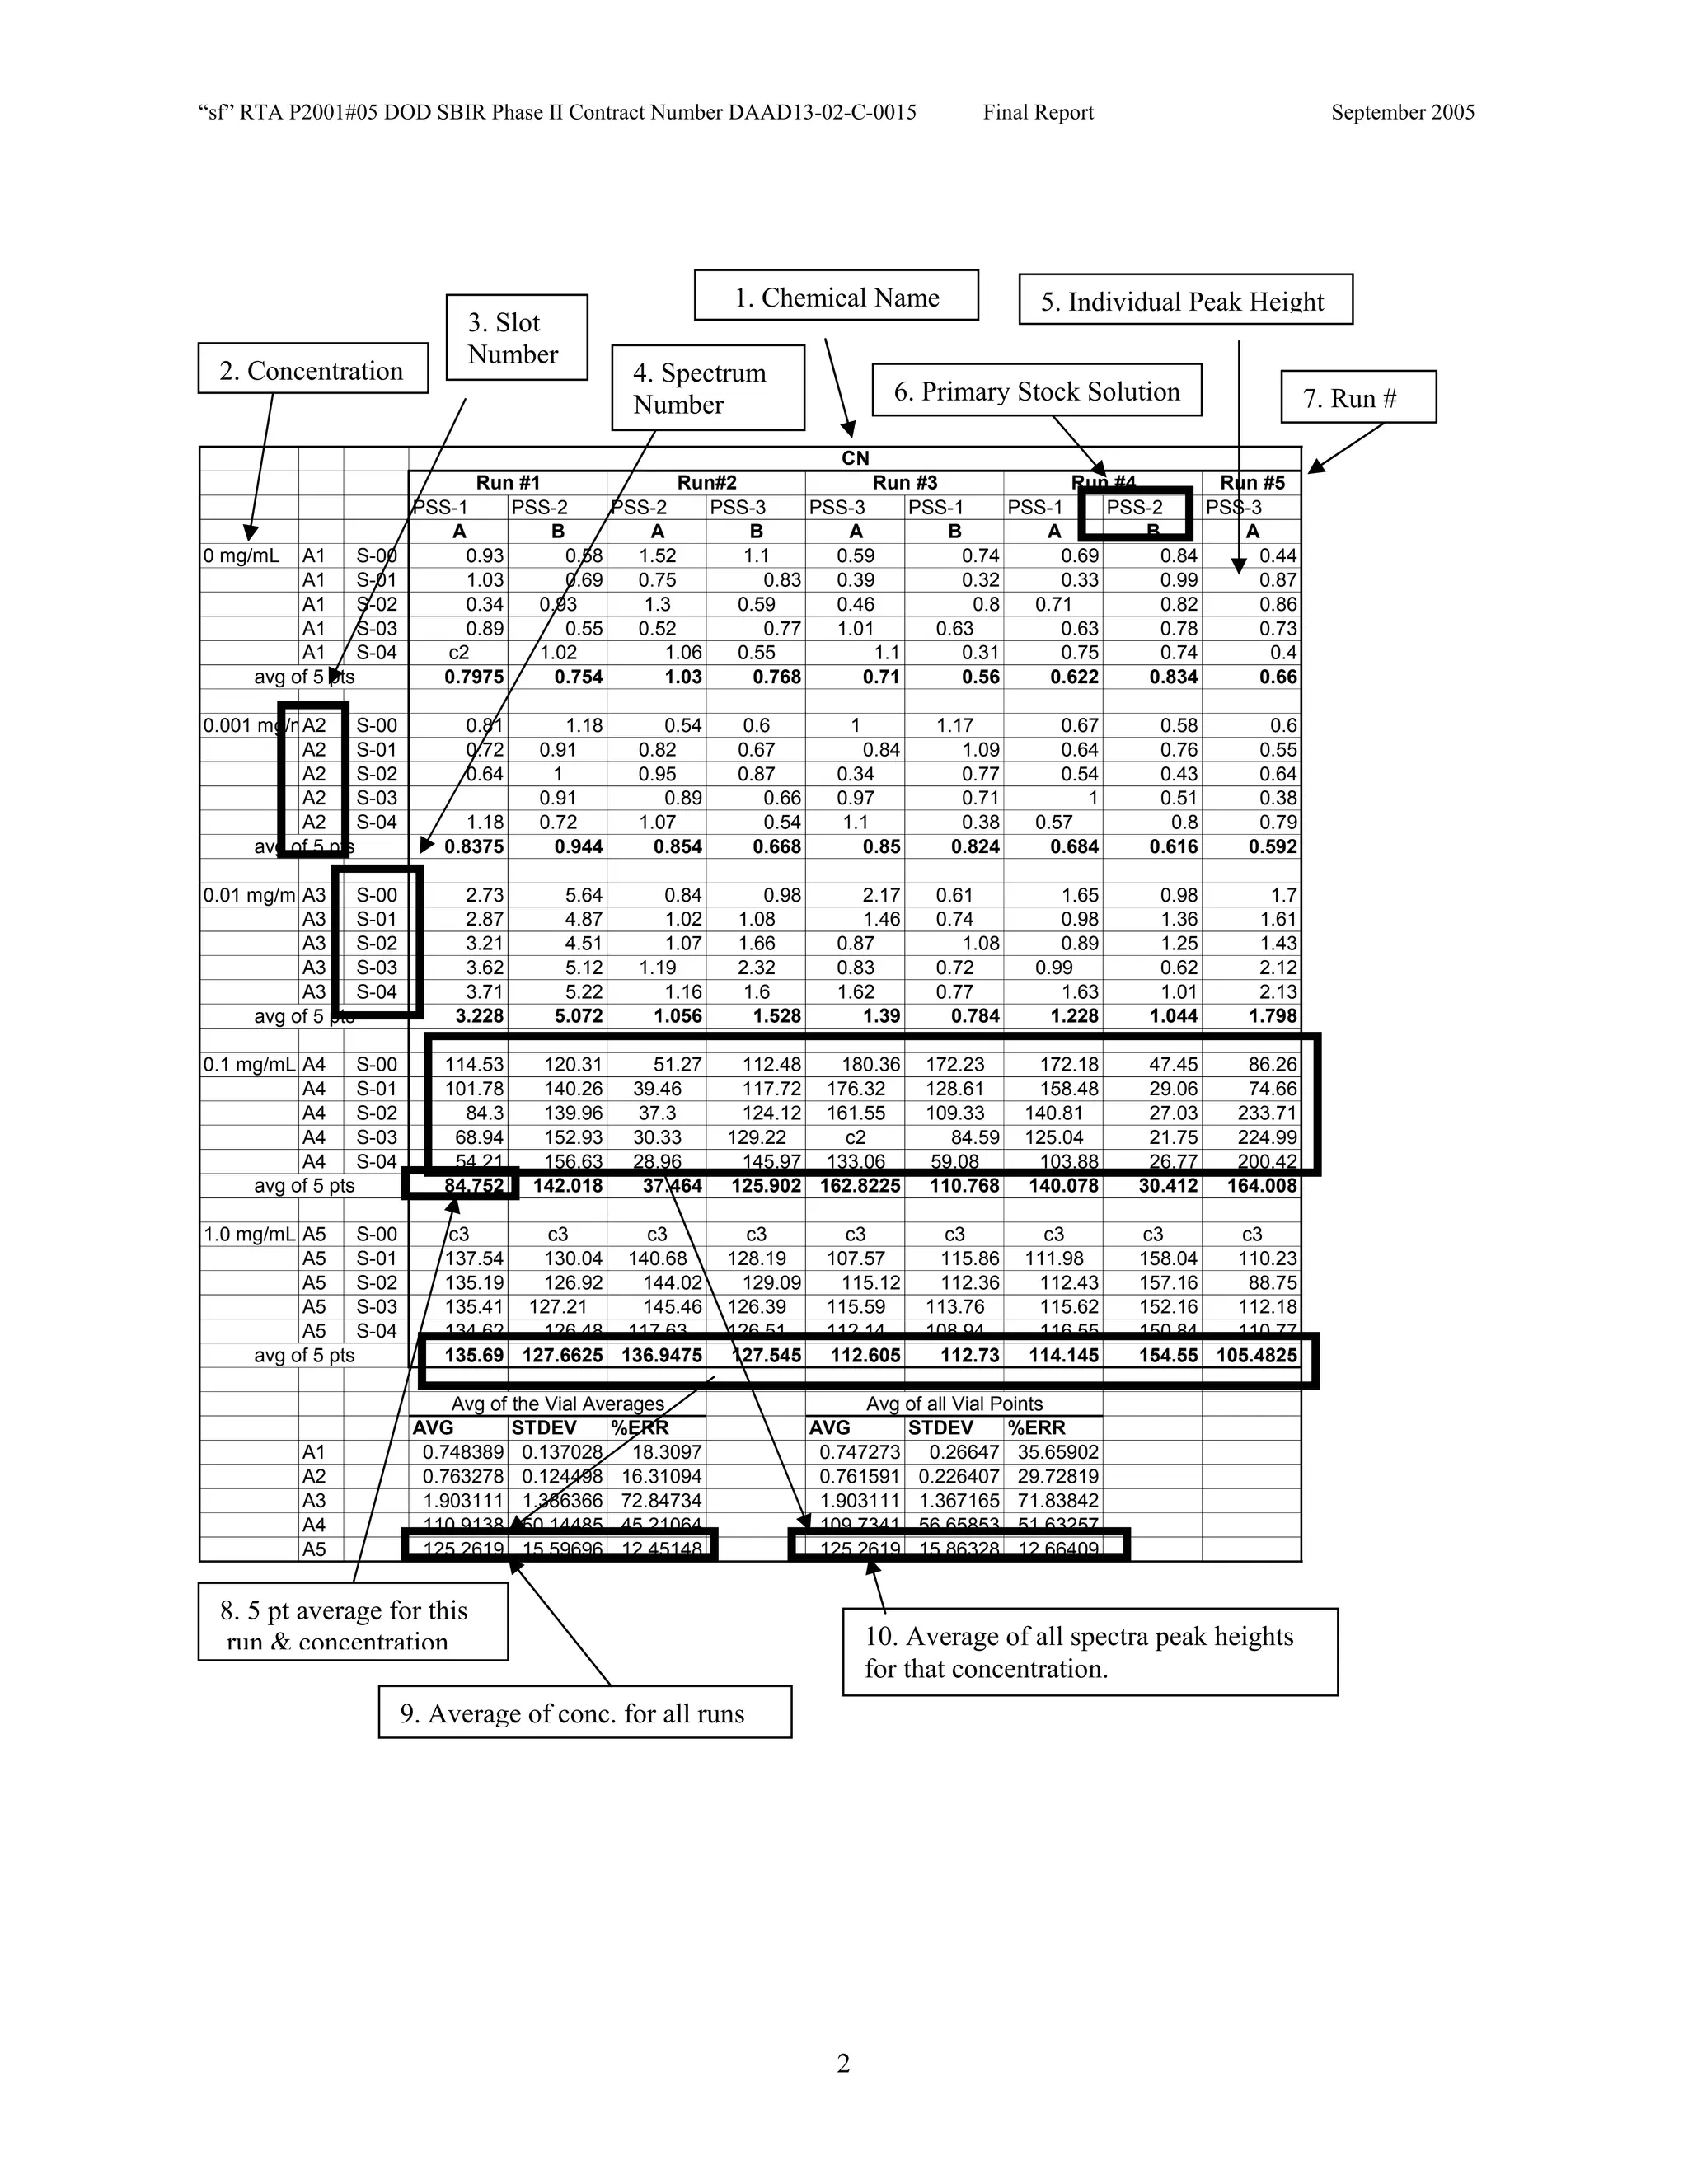
An example table is shown below with sections numbered and described to guide analysis.
1. Chemical Name gives the chemical agent being tested.
2. The Concentration column gives the concentration of the chemical agent (A1-A5 for 5 conc.).
3. The Slot Number column gives the slot on the instrument where the vial was placed. Only the A slots (5)
were used. B slots were inverted, and the software positioning program did not account for vial caps,
which would have offset vial measurements. B slots were not used.
4. The Spectrum Number column labels each of the five spectra that were acquired for each vial. Five
positions (pts) were measured 1 mm apart along the length of the vials. A glitch in the software program
dropped the data for the first position of the 1 mg/ml data for every run (note c3 in table).
5. The remaining columns give the Peak Heights for the spectra that were collected. Peak Areas Tables are
also supplied.
6. Each of the Peak Height columns is labeled with the primary stock solution from which they were created.
7. Run numbers represent the 9 repeats in pairs of A and B (3 for each stock solution). HD included a B pair
for run #5 that included ethanol (isopropyl alcohol?) in the water.
8. At the bottom of each concentration is the average of peak heights for the 5 spectra for that vial. These
rows are labeled “avg of 5 pts”. Except 1mg/ml are 4 pts.
At the bottom of each table a preliminary analysis is performed for each concentration.
9. The average, standard deviation, and % error ([(Std/AVG)*100]) of each 5 pt average for each
concentration.
10. The average, standard deviation, and % error for each pt for each concentration.
The Tables are arranged by Day (1-3) and according to when the samples were measured (CN, VX, HD). Due to a
limited supply of vials (350) only 2 DI stock solution repeats were performed for CN and VX. All others used 3
repeats.](https://image.slidesharecdn.com/finalreportdaad1302c0015part5applp-13347355530702-phpapp01-120418025822-phpapp01/75/Final-Report-Daad13-02-C-0015-Part5-App-L-P-41-2048.jpg)


![Fei sun chemical presentation 070114 2c [compatibility mode]](https://cdn.slidesharecdn.com/ss_thumbnails/feisunchemicalpresentation0701142ccompatibilitymode-190222080248-thumbnail.jpg?width=640&height=640&fit=bounds)


