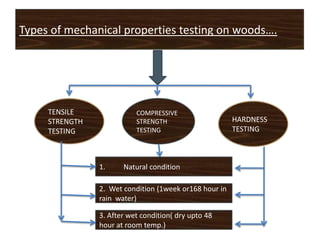
1. The document presents an investigation of the mechanical properties of natural and composite woods. Compression, hardness, and tensile tests were performed on various natural woods and the results were analyzed.
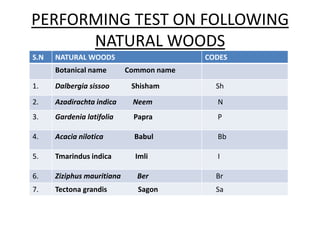
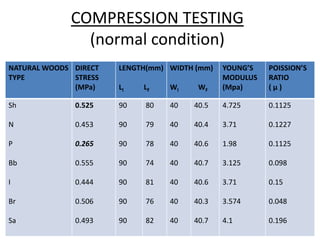
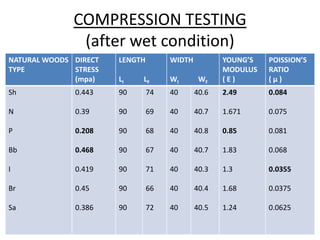
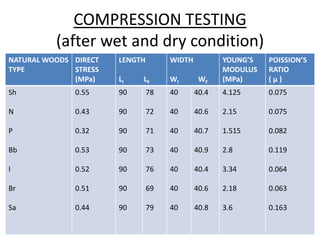
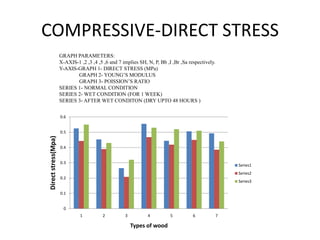
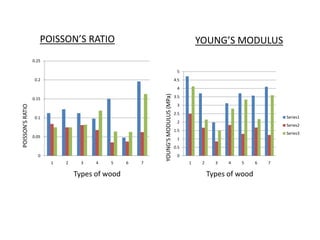
2. The compression tests showed that Neem wood had higher strength after being dried compared to other woods like Sheesham. This indicates that Neem would be preferable for use in highly wet places with high rainfall.
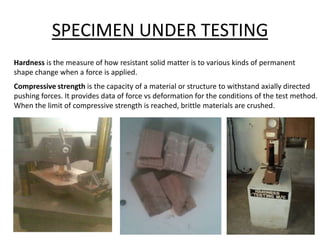
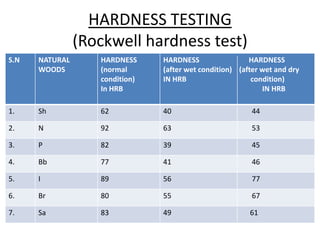
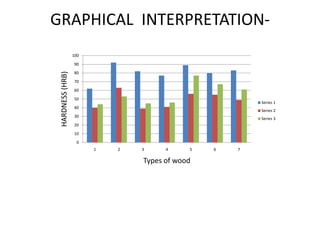
3. Hardness testing results demonstrated that Neem wood has the highest hardness while Papra wood has the lowest, suggesting Neem would be best for applications requiring hardness.