Direct Lineage Reprogramming: Novel Factors involved in Lineage ReprogrammingAhmed Madni
Direct linage reprogramming has got a major focus in biomedical field. The production of specific functional cell type from totally different cell lineage is called lineage reprogramming. In other words, it is induction of functional cell type from another linage without passing through intermediate stage of pluripotent.
The RET proto-oncogene encodes a receptor tyrosine kinase for members of the glial cell line-derived neurotrophic factor family of extracellular signalling molecules. RET loss of function mutations are associated with the development of Hirschsprung's disease, while gain of function mutations are associated with the development of various types of human cancer, including medullary thyroid carcinoma, multiple endocrine neoplasias type 2A and 2B, pheochromocytoma and parathyroid hyperplasia.
RET is an abbreviation for "rearranged during transfection", as the DNA sequence of this gene was originally found to be rearranged within a 3T3 fibroblast cell line following its transfection with DNA taken from human lymphoma cells. The human gene RET is localized to chromosome 10 (10q11.2) and contains 21 exons.
The natural alternative splicing of the RET gene results in the production of 3 different isoforms of the protein RET. RET51, RET43 and RET9 contain 51, 43 and 9 amino acids in their C-terminal tail respectively. The biological roles of isoforms RET51 and RET9 are the most well studied in-vivo as these are the most common isoforms in which RET occurs.
Common to each isoform is a domain structure. Each protein is divided into three domains: an N-terminal extracellular domain with four cadherin-like repeats and a cysteine-rich region, a hydrophobic transmembrane domain and a cytoplasmic tyrosine kinase domain, which is split by an insertion of 27 amino acids. Within the cytoplasmic tyrosine kinase domain, there are 16 tyrosines (Tyrs) in RET9 and 18 in RET51. Tyr1090 and Tyr1096 are present only in the RET51 isoform.
The extracellular domain of RET contains nine N-glycosylation sites. The fully glycosylated RET protein is reported to have a molecular weight of 170 kDa although it is not clear to which isoform this molecular weight relates.
We present a computational pipeline implemented in R programming language to perform to detect in the protein-protein human interactome the protein-protein interactions that are most likely affected by the state of the gene coding for Protein Tyrosine Phosphatase, Receptor Type, G (PTPRG) and by different treatments in a well-established cell model of chronic myeloid leukaemia (CML).
The final concrete result of this research is a free software that allows oncologists to identify the protein-protein interaction pathways not properly working in patients suffering from CML, as well as he pathways that are altered by the pharmacological treatments currently being tested. (...)
Basic Mutagenic signal Transduction or the cancer signal transduction that control cell cycle are important pathways to understand cancer in molecular level and to invent targeted treatment.
Transcription factors and their role in plant disease resistanceSachin Bhor
The transcription of DNA to make messenger RNA is highly controlled by the cell. For higher organisms (plant or animal) to function, genes must be turned on and off in coordinated groups in response to a variety of situations. For a plant this may be “abiotic” (non-living) stress such as the rising or setting sun, drought, or heat, “biotic” (living) stress such as insects, viral or bacterial infection, or any of a limitless number of other events.
The job of coordinating the function of groups of genes falls to proteins called transcription factors (TF’s). TFs are proteins that binds to specific sequence of DNA in promoter region and regulate transcription.
ChEC-seq is a method used to identify protein-DNA interactions across a genome. It involves fusing micrococcal nuclease (MNase) to a protein of interest. In principle, specific genome- wide interactions of the fusion protein with chromatin result in local DNA cleavages that can be mapped by DNA sequencing. ChEC-seq has been used to draw conclusions about broad gene-specificities of certain protein-DNA interactions. In particular, the transcriptional regulators SAGA, TFIID, and Mediator are reported to generally occupy the promoter/UAS of genes transcribed by RNA polymerase II in yeast. Here we compare published yeast ChEC-seq data performed with a variety of protein fusions across essentially all genes, and find high similarities with negative controls. We conclude that ChEC-seq patterning for SAGA, TFIID, and Mediator differ little from background at most promoter regions, and thus cannot be used to draw conclusions about broad gene specificity of these factors.
Computational models for the analysis of gene expression regulation and its a...amathelier
Anthony Mathelier has recently been appointed as a new group leader in Computational Biology at the NCMM in Oslo, focusing on computational methods to study gene regulation. He will present one of his recent studies that coupled experimental data and targeted computational analysis with TF binding profiles to interpret cis-regulatory somatic mutations of 84 matched tumour-normal whole genomes from B-cell lymphomas. Transcription factor binding sites (TFBSs) representing the core of gene cis-regulation, he will finally introduce new models to improve the prediction of TFBSs from ChIP-seq data.
MicroRNA-Disease Predictions Based On Genomic Dataijtsrd
Gene Ontology is a structured library of concepts related with one or more gene products through a process called annotation. Association Rules that discovers biologically relevant and corresponding associations. In the existing system, they used Gene Ontology-based Weighted Association Rules for extracting annotated datasets. We here adapt the MOAL algorithm to mine cross-ontology association rules. Cross ontology rules to manipulate the Protein values from three sub ontologys for identifying the gene attacked disease. It focused on intrinsic and extrinsic values. The Co-Regulatory modules between microRNA, Transcription Factor and gene on function level with multiple genomic data. The regulations are compared with the help of integration technique. Iterative Multiplicative Updating Algorithm is used in our project to solve the optimization module function for the above interactions. Comparing the regulatory modules and protein value for gene and generating Bayesian rose tree for the efficiency of our result. Ajitha. C | DivyaLakshmi. K | Jothi Jayashree. M"MicroRNA-Disease Predictions Based On Genomic Data" Published in International Journal of Trend in Scientific Research and Development (ijtsrd), ISSN: 2456-6470, Volume-2 | Issue-3 , April 2018, URL: http://www.ijtsrd.com/papers/ijtsrd11386.pdf http://www.ijtsrd.com/computer-science/data-miining/11386/microrna-disease-predictions-based-on-genomic-data/ajitha-c
1. TFB Transcriptional Regulation in Halobacterium salinarum
Genes Directly Regulated by TFBg
How does a certain transcription factor affect gene expression in the Halobacterium salinarum organism?
Alex LaDue | Mechanical Engineering ’17 Gi Jung Lee | Mechanical Engineering ’16 Henry Taylor | Biology & Computer Science ’18
Abstract
Transcription factor IIBs, TFBs, are a class of Archaeal general
transcription factors responsible for much of the organism’s
transcriptional regulation and are involved in a wide range of life
processes. Through ChIP-chip data and gene expression data, these
transcription factors were found to interact with a large range of
genes (1220). Furthermore, large transcriptional regulation network
between the transcription factors themselves was found. TFBg was
then chosen to be overexpressed to observe its impact on the
transcription factor regulatory network within the scope of TFBs and
the organism’s molecular processes. TFBg was chosen due to its size
of directly related genes and its importance to the organism.
Methods
TFB Clustering Analysis
TFBg Analysis
Darnell, Cynthia L., and Amy K. Schmid. "Systems biology approaches to defining
transcription regulatory networks in halophilic archaea." Methods 86 (2015):
102-114.
Facciotti, Marc T., et al. "General transcription factor specified global gene
regulation in archaea." Proceedings of the National Academy of Sciences
104.11 (2007): 4630-4635.
Conclusions
From our analysis, the following conclusions can be drawn:
• TFBs directly regulate a total of 1220 genes
• Within TFBs, there is a large TF-TF network with only TFBe
being an outlier
• TFBg regulates and thus binds to the promoter of the TFBb-
encoding gene (represses) as well as its own gene (activates)
• TFBg less strongly, or indirectly, regulates a large number of
genes throughout the genome, however due to size limitations
and project scope (within TFBs), they are not listed
References
Acknowledgements: Thanks to Dr. Magwene, Dr. Schmid and Edgar Medina
The TF-TF network was
created by determining if
any of the directly regulated
genes code for another TFB
transcription factor. It is
interesting to note that TFBe
doesn’t regulate any TFB
genes nor does it regulated
by other TFBs. TFBg is
regulated by most of the
other TFBs, which suggests
that it plays an important
role in the organism.
Through analysis of ChIP-chip data, a graph of the TFB
transcription factors and their regulated genes was produced,
demonstrating the extent of genome regulation of TFBs. A standard
p-value cutoff of 0.05 was used to determine which genes were
directly regulated by the various TFB transcription factors.
Gene clustering using gene expression data from the TFBs shown
above using the complete linkage hierarchical clustering method
with K=8. Through hierarchical clustering of all TFBs, high variance
in gene expression between different clusters is shown, suggesting
the variability of gene expressions for genes regulated by TFBs
(Figure 1). This contrasts with the clustering of TFBg in Figure 4.
TFB Hierarchical Clustering
TFB TFs and their Regulated Genes
TFBg Overexpression Hierarchical Clustering
TF-TF Networks
TFBg Heatmaps
All Genes Directly Regulated Genes
OE_tfbG_0.180
OE_tfbG_1.080
1 Standard
Deviation
Removed
2 Standard
Deviations
Removed
1 Standard
Deviation
Removed
2 Standard
Deviations
Removed
OE_tfbG_0.180
OE_tfbG_0.408
OE_tfbG_1.080
Hierarchical complete linkage gene clustering for all genes
using gene expression data for transcription factor, TFBg.
Compared to the clustering for all TFBs (Figure 3), the TFBg
cluster is incredibly precise and specified.
Heatmaps using gene expression data (normalized to wild-type
expression levels) from TFBg were generated: one using all genes,
one using genes TFBg directly regulated (ChIP-chip data). Genes
were organized by hierarchical clustering. Significantly expressed
genes were then measured through standard deviations from
average gene expression and displayed with non-significantly
expressed genes as white bars. Three conditions for the cell affected
by TFBg overexpression are shown: lag state, exponential stage,
and early stationary phase (going from left to right). As seen on
both sets, depending on growth stage, TFBg regulated an isolated
set of genes. By comparing the directly regulated and all gene heat
maps, TFBg regulates many genes indirectly, through TF-TF
networks. In direct regulation, there are certain clusters strongly
regulated.
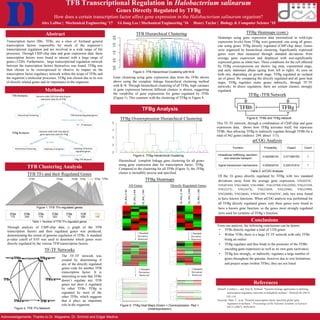
This TF-TF network, through a combination of ChIP-chip and gene
expression data, shows how TFBg activates itself, but represses
TFBb, thus allowing TFBg to indirectly regulate through TFBb for a
total of 362 genes (indirect: 249, direct: 113).
Function Probability Expect Count
Intracellular trafficking; secretion;
and vesicular transport
0.002098134 0.071084783 1
Signal transduction mechanisms 0.020430316 0.225101814 1
Table 2: arCOG Analysis
Of the 16 genes directly regulated by TFBg with two standard
deviations away from the average gene expression, VNG0255C,
VNG0743H, VNG1046H, VNG1088C, VNG1978H,VNG2293G, VNG2335H,
VNG2337C, VNG2437G, VNG2585H, VNG2598G, VNG2599H,
VNG2600G, VNG2666G, VNG6159H, VNG6293C, only two were found
to have known functions. When arCOG analysis was performed for
all TFBg directly regulated genes, only three genes were found to
have a known gene function, so the genes most strongly regulated
were used for certainty of TFBg’s function.
Figure 6: TFBb and TFBg network
Figure 1: TFB TFs regulated genes
Figure 2: TFB TFs Network
OE_tfbG_0.408
Figure 3: TFB Hierarchical Clustering with K=8
Figure 4: TFBg Hierarchical Clustering
Figure 5: TFBg Heat Maps (Green = Overexpression, Red =
Underexpression)
TFBg -TFB Network
arCOG Analysis
TFBf TFBd TFBb TFBc TFBg TFBa TFBe
TFBg Heatmaps (cont.)
TFBa
175
TFBb
249
TFBc
116
TFBd
923
TFBe
10
TFBf
658
TFBg
113
Table 1: Number of TFB TFs regulated genes