1. Nano Encapsulated Transforming Growth Factor-β (TGF-β) Possibly
Attenuates NF-κB Activation Pathway in Pulmonary Hypertension
Leandro Fernandez, Omar Mohtar, Elizabeth Klings, and Jean-Bosco Tagne
Pulmonary Center, Boston University Medical Center
Introduction
• Pulmonary hypertension (PH) is a clinical condition resulting from pulmonary vasculopathy. The epidemiologic
associations between PH and systemic hypertension, renal and cerebrovascular disease in sickle cell disease (SCD)
suggests a pathologic link amongst vascular complications of SCD.
• Candidate gene-based studies done by our group and others have demonstrated that Transforming Growth Factor-
Beta (TGF-β), a secreted protein in the superfamily of cytokines that performs many cellular functions is associated
with numerous vascular phenotypes in sickle cell disease including stroke, priapism, leg ulcerations and pulmonary
hypertension.
• These functions include the control of cell growth, cell proliferation, as well as cell differentiation and apoptosis. As
a result of TGF-β’s wide array of cellular processes, it can be negatively or positively expressed to induce or inhibit
these cellular functions.
• Aberrant TGF-β signaling has roles in animal models of PH and mutations have been found in some patients with
idiopathic PH suggesting that this pathway is an important modulator of gene expression within the pulmonary
vasculature.
Hypothesis
Human pulmonary artery endothelial (HPAEC) cells were kindly provided by Dr. Jean-Bosco Tagne (Pulmonary Center,
Boston University Medical Center) and were grown in p100 plates with Lonza’s EGM™-2 BulletKit™ culture media. The
media was changed every three days for continued cell growth. The experiment with these cells began when they reached
70% confluence. Each well was then added with one of the following treatments: 5μM TGF-β, 10μM TGF-β, 5nM nano-
formulated TGF-β, 10 nM nano-formulated TGF-β, or left untreated as a control. Cells were incubated for 48 hours and then
harvested for RT-PCR analysis.
Real-time reverse transcription polymerase chain reaction (RT- PCR) methods were adapted to identify the different genes
of interest. Expression levels of Smad 3 for its role in the TGF-β signaling pathway, Map3k7, as well as RelA, both of which
are fundamental for the Nuclear Factor NF-κB pathway in TGF-β, and Fibronectin (FN1) which is responsible for cell
adhesion, wound healing, and cell migration were analyzed using real-time quantitative PCR as a validation of microarray
results.
Methods
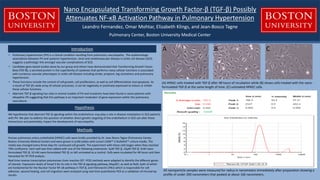
All nanoparticle samples were measured for radius in nanometers immediately after preparation showing a
profile of under 200 nanometers that peaked at about 166 nanometers.
A B C
(A) HPAEC cells treated with TGF-β after 48 hours of incubation while (B) shows cells treated with the nano-
formulated TGF-β at the same length of time. (C) untreated HPAEC cells
We hypothesize that aberrant TGF-β signaling within the endothelium may play a role in disease modulation in SCD patients
with PH. We plan to address the question of whether direct genetic targeting of the endothelium in SCD can alter these
interactions and potentially, impact the development of vasculopathy.
2. RESULTS
CONCLUSIONS
REFERENCES
1. Tagne, J.B., et al., A nanoemulsion formulation of tamoxifen increases its efficacy in a breast cancer cell line. Mol Pharm, 2008. 5(2): p. 280-6
2. Freudlsperger, C., et al., TGF-b and NF-kB signal pathway cross-talk is mediated through TAK1 and SMAD7 in a subset of head and neck cancers. Oncogene, 2013. 32, 1549–1559
3. Sultana, Chand, et al., Interaction of Sickle Erythrocytes With Endothelial Cells in the Presence of Endothelial Cell Conditioned Medium Induces Oxidant Stress Leading to Transendothelial Migration of Monocytes Blood, 1998. Vol 92, No 10
(November 15),: pp 3924-3935
• Although concentrations of TGF-β doubled, there was no
significance between the two amounts in terms of gene
expression and both concentrations follow the same trend.
• The two genes that are in the NF-κb pathway, RelA and Map3k7,
both decreased in expression in the nano-TGF-β compared to the
regular TGF-β
• Smad 3 which naturally occurs in the TGF-β signaling pathway,
increased in nano-formulated TGF-β compared to normal TGF-β
• Fibronectin saw the biggest difference between nano and regular
TGF-β with a 1.5 fold decrease in the nano-formulation.
The similar trends between the two varying concentrations suggests that
a lower amount of TGF-β is more beneficial because the lesser sum will
undeniably have less side effects, if any. The abnormal adherence of
sickle red blood cells to endothelial cells has been thought to contribute
to vascular occlusion. This, along with transcription factor NF-kB, an
indicator of cellular oxidant stress, is a major cause of morbidity in sickle
cell disease. This study showed that in the presence of our Nano-
formulated TGF-β, the nuclear factor NF-κB pathway is altered, and an
important gene in regulating cell adhesion (FN1) is also considerably
lower which is an indication of the improvement in TGF-β’s therapeutic
effect in the cure of PH and SCD.
Nano Encapsulated Transforming Growth Factor-β (TGF-β) Possibly
Attenuates NF-κB Activation Pathway in Pulmonary Hypertension
Pulmonary Center, Boston University Medical Center
Leandro Fernandez, Omar Mohtar, Elizabeth Klings, and Jean-Bosco Tagne
The figure shown above shows the RT-PCR results for the 4 different genes of interest using delta delta ct comparative analysis. The blue bars indicate the normal
TGF-β while the red bars show the expression for the nano-TGF-β. The graphs are also placed side by side to their 5 and 10 molar counterparts to further illustrate
the trend between the two concentrations
0
0.5
1
1.5
2
2.5
FN1 FN1
TGF 10 nM NTGF 10 nM
Expression
10uM Fibronectin Relative
Expression
0
0.5
1
1.5
2
2.5
FN1 FN1
TGF 5nm NTGF 5nm
Expression
5uM Fibronectin Relative
Expression
0
0.2
0.4
0.6
0.8
1
1.2
MAP3K7 MAP3K7
TGF 5nm NTGF 5nm
Expression
5uM Map3k7 Relative
Expression
0
0.2
0.4
0.6
0.8
1
1.2
1.4
1.6
1.8
2
MAP3K7 MAP3K7
TGF 10 nM NTGF 10 nM
Expression
10uM Map3k7 Relative
Expression
0
0.2
0.4
0.6
0.8
1
1.2
1.4
RELA RELA
TGF 10 nM NTGF 10 nM
Expression
10uM RelA Relative
Expression
0
0.1
0.2
0.3
0.4
0.5
0.6
0.7
0.8
0.9
1
RELA RELA
TGF 5nm NTGF 5nm
Expression
5uM RelA Relative
Expression
0
0.1
0.2
0.3
0.4
0.5
0.6
0.7
0.8
0.9
1
Smad3 Smad3
TGF 5nm NTGF 5nm
Expression
5uM Smad 3 Relative
Expression
0
0.1
0.2
0.3
0.4
0.5
0.6
0.7
0.8
0.9
1
SMAD3 SMAD3
TGF 10 nM NTGF 10 nM
Expression
10uM Smad 3 Relative
Expression