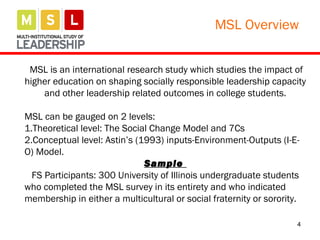
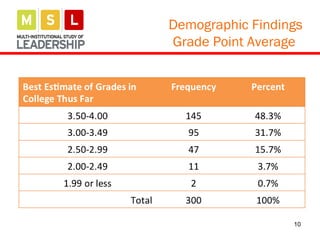
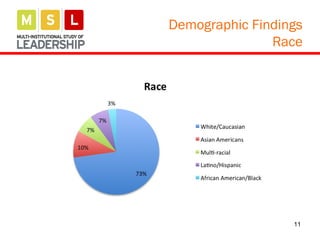
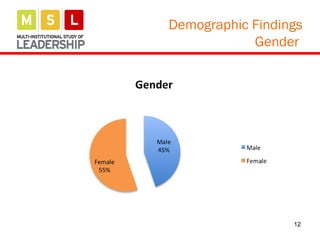
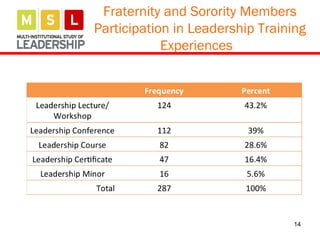
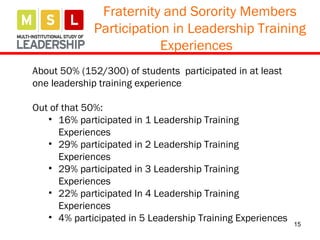
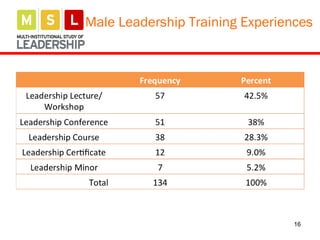
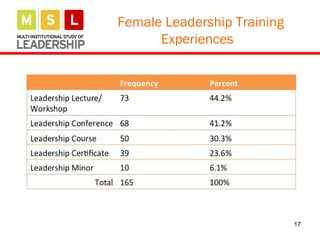
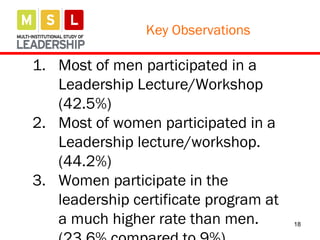
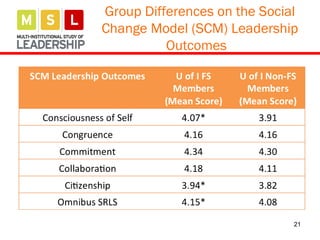
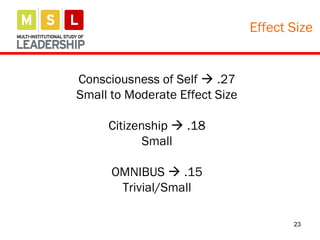
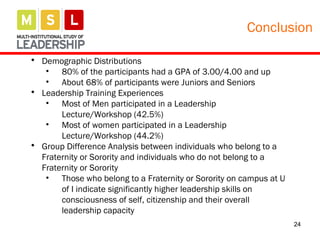
1
Fraternity and Sorority Analysis
University of Illinois Urbana-Champaign
12/04/15
Ismael Correa & Mia Xin
© MSL/ NCLP, 2006, 2009, 2010, 2011, 2012, 2015
2
Outline
Section I
Background and Purpose
Section II
Demographic findings
Section III
Leadership Training Experiences
Section IV
Group difference on the Social Change Model
Leadership Outcomes
3
Section I
Background and Purpose
4
MSL Overview
MSL is an international research study which studies the impact of
higher education on shaping socially responsible leadership capacity
and other leadership related outcomes in college students.
MSL can be gauged on 2 levels:
1.Theoretical level: The Social Change Model and 7Cs
2.Conceptual level: Astin’s (1993) inputs-Environment-Outputs (I-E-
O) Model.
Sample
FS Participants: 300 University of Illinois undergraduate students
who completed the MSL survey in its entirety and who indicated
membership in either a multicultural or social fraternity or sorority.
5
Theoretical Framework: Social Change
Model (7 C’s)
Individual Values
Consciousness of Self- awareness of the beliefs, values, attitudes,
and emotions that motivate one to take action
Congruence- thinking, feeling, and behaving with consistency,
genuineness, authenticity, and a honesty toward others; actions
are consistent with the most deeply held beliefs and convictions
Commitment- The psychic energy that motivates the individual to
serve that drives the collective effort; implies passion, intensity,
and duration, and is directed toward both the group activity as well
as its intended outcomes.
6
Group Values
Collaboration- To work with others in a common effort,
constitutes the cornerstone values of the group leadership
effort because it empowers self and others through trust.
Controversy with Civility- Recognizes two fundamental realities
of any creative group effort: that differences in viewpoint are
inevitable, and that such differences must be aired openly, but
with civility.
Theoretical Framework: Social Change
Model (7 C’s)
7
Community Values
Citizenship – The process by whereby an individual and
the collaborative group become responsibly connected to
the community and society through the leadership
development activity.
Theoretical Framework: Social Change
Model (7 C’s)
8
Section II
Demographic Findings
9
Demographic Findings
Class Standing
10
Demographic Findings
Grade Point Average
11
Demographic Findings
Race
12
Demographic Findings
Gender
13
Section III
Leadership Training Experiences of
Fraternity and Sorority Members
14
Fraternity and Sorority Members
Participation in Leadership Training
Experiences
15
About 50% (152/300) of students participated in at least
one leadership training experience
Out of that 50%:
• 16% participated in 1 Leadership Training
Experiences
• 29% participated in 2 Leadership Training
Experiences
• 29% participated in 3 Leadership Training
Experiences
• 22% participated In 4 Leadership Training
Experiences
• 4% participated in 5 Leadership Training Experiences
Fraternity and Sorority Members
Participation in Leadership Training
Experiences
16
Male Leadership Training Experiences
17
Female Leadership Training
Experiences
18
1. Most of men participated in a
Leadership Lecture/Workshop
(42.5%)
2. Most of women participated in a
Leadership lecture/workshop.
(44.2%)
3. Women participate in the
leadership certificate program at
a much higher rate than men.
Key Observations
19
Section IV
Group Differences on the Social
Change Model (SCM) Leadership
Outcomes
20
Group Differences on the Social
Change Model (SCM) Leadership
Outcomes
Hypothesis
Students who were involved in Fraternities and
Sororities scored the same on each of the 7
leadership outcomes than students who were
not involved in Fraternities and Sororities.
Alternative Hypothesis
Students who were involved in Fraternities and
Sororities scored differently on each of the 7
Leadership Outcomes than those students who
were not involved in Fraternities and Sororities.
21
Group Differences on the Social
Change Model (SCM) Leadership
Outcomes
22
Group Differences on the Social
Change Model (SCM) Leadership
Outcomes
Key Question: Is the effect size big enough to mean something?
Effect Size
• An effect size quantifies the difference between two groups.
o An effect size of .15 is trivial
o An effect size of .20 is small
o An effect size of .50 is medium
o An effect size of .80 is large
In higher education a small effect
size is very notable
Ellis, P.D. (2009), “Thresholds for interpreting effect sizes”,
http://www.polyu.edu.hk/mm/effectsizefaqs/thresholds_for_interpreting_effect_sizes2.html accessed on
November 16th, 2015
23
Effect Size
Consciousness of Self  .27
Small to Moderate Effect Size
Citizenship  .18
Small
OMNIBUS  .15
Trivial/Small
24
Conclusion
• Demographic Distributions
• 80% of the participants had a GPA of 3.00/4.00 and up
• About 68% of participants were Juniors and Seniors
• Leadership Training Experiences
• Most of Men participated in a Leadership
Lecture/Workshop (42.5%)
• Most of women participated in a Leadership
Lecture/Workshop (44.2%)
• Group Difference Analysis between individuals who belong to a
Fraternity or Sorority and individuals who do not belong to a
Fraternity or Sorority
• Those who belong to a Fraternity or Sorority on campus at U
of I indicate significantly higher leadership skills on
consciousness of self, citizenship and their overall
leadership capacity
Discussion
25
What does this data tell us about . . .
Our school’s students who are involved in
a Fraternity or Sorority?
Our school’s Fraternity and Sorority
system?
Our school’s culture?
Our school’s leadership programs?
Our school’s strengths and weaknesses?
Our school’s future strategies?
26
Q & A

FINAL MSL Fraternity and Sorority Presentation

  • 1.
    1 Fraternity and SororityAnalysis University of Illinois Urbana-Champaign 12/04/15 Ismael Correa & Mia Xin © MSL/ NCLP, 2006, 2009, 2010, 2011, 2012, 2015
  • 2.
    2 Outline Section I Background andPurpose Section II Demographic findings Section III Leadership Training Experiences Section IV Group difference on the Social Change Model Leadership Outcomes
  • 3.
  • 4.
    4 MSL Overview MSL isan international research study which studies the impact of higher education on shaping socially responsible leadership capacity and other leadership related outcomes in college students. MSL can be gauged on 2 levels: 1.Theoretical level: The Social Change Model and 7Cs 2.Conceptual level: Astin’s (1993) inputs-Environment-Outputs (I-E- O) Model. Sample FS Participants: 300 University of Illinois undergraduate students who completed the MSL survey in its entirety and who indicated membership in either a multicultural or social fraternity or sorority.
  • 5.
    5 Theoretical Framework: SocialChange Model (7 C’s) Individual Values Consciousness of Self- awareness of the beliefs, values, attitudes, and emotions that motivate one to take action Congruence- thinking, feeling, and behaving with consistency, genuineness, authenticity, and a honesty toward others; actions are consistent with the most deeply held beliefs and convictions Commitment- The psychic energy that motivates the individual to serve that drives the collective effort; implies passion, intensity, and duration, and is directed toward both the group activity as well as its intended outcomes.
  • 6.
    6 Group Values Collaboration- Towork with others in a common effort, constitutes the cornerstone values of the group leadership effort because it empowers self and others through trust. Controversy with Civility- Recognizes two fundamental realities of any creative group effort: that differences in viewpoint are inevitable, and that such differences must be aired openly, but with civility. Theoretical Framework: Social Change Model (7 C’s)
  • 7.
    7 Community Values Citizenship –The process by whereby an individual and the collaborative group become responsibly connected to the community and society through the leadership development activity. Theoretical Framework: Social Change Model (7 C’s)
  • 8.
  • 9.
  • 10.
  • 11.
  • 12.
  • 13.
    13 Section III Leadership TrainingExperiences of Fraternity and Sorority Members
  • 14.
    14 Fraternity and SororityMembers Participation in Leadership Training Experiences
  • 15.
    15 About 50% (152/300)of students participated in at least one leadership training experience Out of that 50%: • 16% participated in 1 Leadership Training Experiences • 29% participated in 2 Leadership Training Experiences • 29% participated in 3 Leadership Training Experiences • 22% participated In 4 Leadership Training Experiences • 4% participated in 5 Leadership Training Experiences Fraternity and Sorority Members Participation in Leadership Training Experiences
  • 16.
  • 17.
  • 18.
    18 1. Most ofmen participated in a Leadership Lecture/Workshop (42.5%) 2. Most of women participated in a Leadership lecture/workshop. (44.2%) 3. Women participate in the leadership certificate program at a much higher rate than men. Key Observations
  • 19.
    19 Section IV Group Differenceson the Social Change Model (SCM) Leadership Outcomes
  • 20.
    20 Group Differences onthe Social Change Model (SCM) Leadership Outcomes Hypothesis Students who were involved in Fraternities and Sororities scored the same on each of the 7 leadership outcomes than students who were not involved in Fraternities and Sororities. Alternative Hypothesis Students who were involved in Fraternities and Sororities scored differently on each of the 7 Leadership Outcomes than those students who were not involved in Fraternities and Sororities.
  • 21.
    21 Group Differences onthe Social Change Model (SCM) Leadership Outcomes
  • 22.
    22 Group Differences onthe Social Change Model (SCM) Leadership Outcomes Key Question: Is the effect size big enough to mean something? Effect Size • An effect size quantifies the difference between two groups. o An effect size of .15 is trivial o An effect size of .20 is small o An effect size of .50 is medium o An effect size of .80 is large In higher education a small effect size is very notable Ellis, P.D. (2009), “Thresholds for interpreting effect sizes”, http://www.polyu.edu.hk/mm/effectsizefaqs/thresholds_for_interpreting_effect_sizes2.html accessed on November 16th, 2015
  • 23.
    23 Effect Size Consciousness ofSelf  .27 Small to Moderate Effect Size Citizenship  .18 Small OMNIBUS  .15 Trivial/Small
  • 24.
    24 Conclusion • Demographic Distributions •80% of the participants had a GPA of 3.00/4.00 and up • About 68% of participants were Juniors and Seniors • Leadership Training Experiences • Most of Men participated in a Leadership Lecture/Workshop (42.5%) • Most of women participated in a Leadership Lecture/Workshop (44.2%) • Group Difference Analysis between individuals who belong to a Fraternity or Sorority and individuals who do not belong to a Fraternity or Sorority • Those who belong to a Fraternity or Sorority on campus at U of I indicate significantly higher leadership skills on consciousness of self, citizenship and their overall leadership capacity
  • 25.
    Discussion 25 What does thisdata tell us about . . . Our school’s students who are involved in a Fraternity or Sorority? Our school’s Fraternity and Sorority system? Our school’s culture? Our school’s leadership programs? Our school’s strengths and weaknesses? Our school’s future strategies?
  • 26.

Editor's Notes

  • #10 Seniors (4th Year and Beyond) and juniors accounted for a combined total of 67.3% distribution across class standing. This group (of juniors and seniors) drives some of the larger participation rates in leadership experiences.
  • #11 About 48% of the participants had a GPA that was 3.50-4.00. About 32% of the participants had a GPA that was 3.00-3.49. These results indicate that Greek students can maintain great academic performances while developing their extracurricular activities.
  • #13 Sexual orientation: Majority of them are heterosexual. (Heterosexual (96.7%), Bi-Sexual (1%), Questioning (1.7%), Gay/Lesbian (0.3%), Queer (0.3)) First generation: A majority of the participants were non-first generation college students (90.3%)
  • #15 Over 40% of the students have attended a leadership lecture/workshop. Almost 40% of the students participated in a leadership conference. Participation rates in leadership courses, leadership certificate or a leadership minor were low.
  • #17 Over 40% of males participated in a leadership conference or a leadership lecture/workshop Participation in the leadership certificate and leadership minor was relatively low
  • #18 Over 40% of females participated in a leadership conference or a leadership lecture/workshop Men and woman both participated in leadership courses at an equal rate Not many woman participated in a leadership minor
  • #22 Performed t-test and the results were that students who belong to a F/S on campus score: Higher on consciousness of self than non F/S students on campus Higher on Citizenship than non F/S students on campus Higher on Overall Leadership Capacity than F/S students on campus
  • #25 Most of men participated in a Leadership Conference (44.8%) Most of women participated in a Leadership lecture/workshop. (44.2%)