Download to read offline

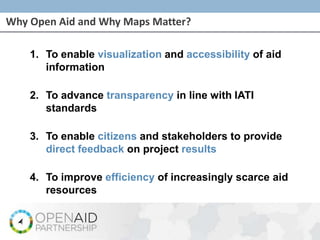
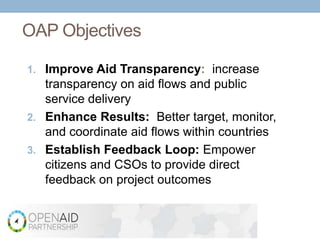
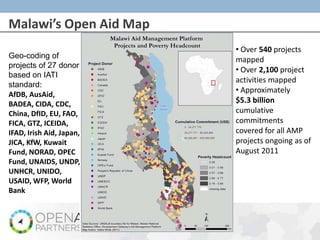
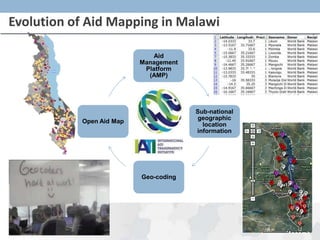
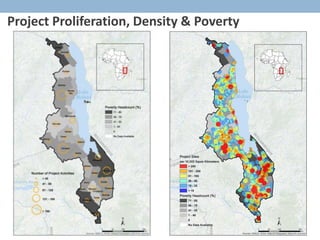
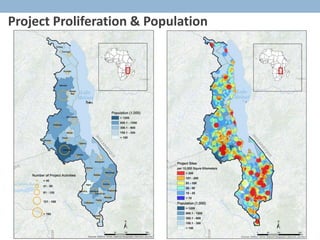
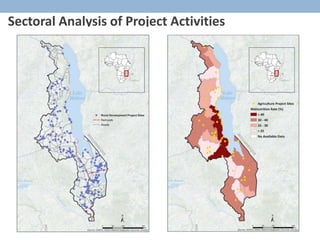
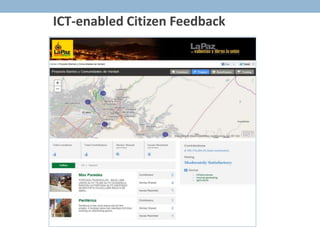
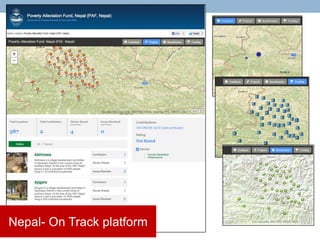
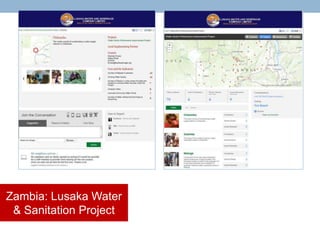

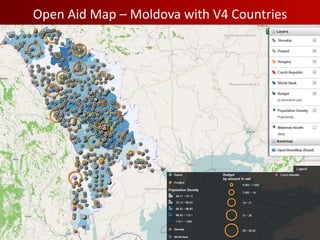

The document details the objectives and components of the Open Aid Partnership (OAP) aimed at enhancing aid transparency and citizen engagement through initiatives like open aid maps and feedback loops. It highlights the importance of visualizing aid information, improving coordination, and assessing development outcomes in various countries. Furthermore, it discusses the implementation of OAP in four countries and the collaboration with multiple partners to further the transparency agenda.