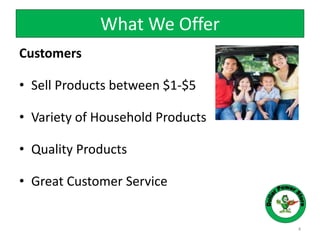
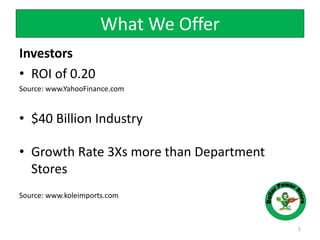
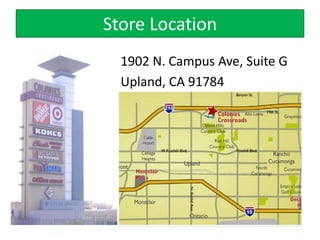
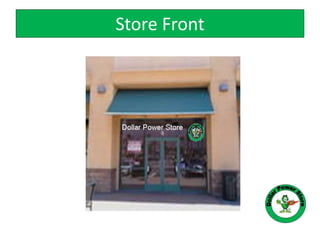
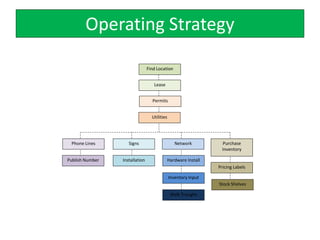
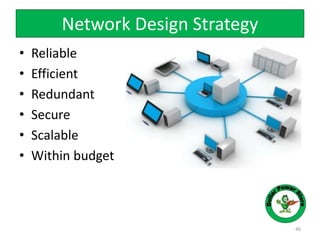
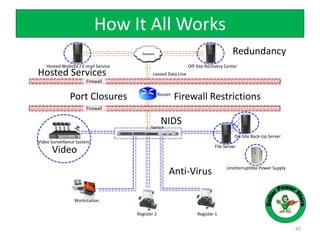
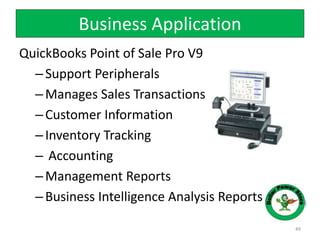
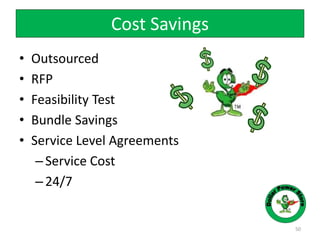
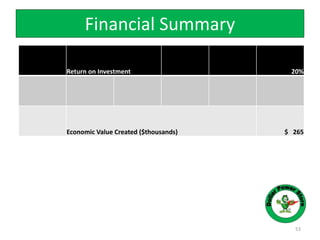
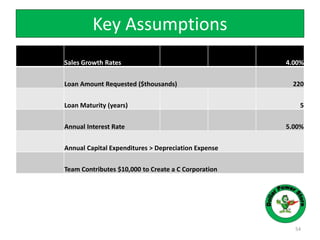
Dollar Power
Where your Dollar has Real Power
By Lupe Gomez-CEO, Eric Andrews-CFO,
John Smith-COO and Luis Valentin-CIO
1
El Que Compra
Barato, Compra
Cada Rato.
2
What does that mean?
You Get What
You Pay For!
3
Customers
• Sell Products between $1-$5
• Variety of Household Products
• Quality Products
• Great Customer Service
4
What We Offer
Investors
• ROI of 0.20
Source: www.YahooFinance.com
• $40 Billion Industry
• Growth Rate 3Xs more than Department
Stores
Source: www.koleimports.com
5
What We Offer
What We Offer
• “Best Year Ever in 2008 & Success Continues in
2009.”
• “Since 2001 Dollar Stores have grown 54%.”
Source: en-us.nielsen.com
• “Fastest growing and most Profitable business
opportunities today.”
According to The Wall Street, USA Today & LA Times
6
Map Location
7
• 1902 N. Campus Ave
Suite G in
Upland Ca. 91785
•5,000 sq. ft.
Hook
8
• We are the Nordstrom Rack of the dollar stores.
• Where your Dollar has real Power.
Target Market
Ideal Customer
• Bargain Shoppers
• Families of 2 or more
• Income of $70,000 +
• Age 35+
9
Demographics
Source: US Census & Yahoo.com
10
City
Average
Income
Average
Age
Average # in
Household
Growth Rate Of
Population
Upland $76,856 34 3 5.20%
Claremont $107,287 37 3 2.60%
Rancho Cucamonga $80,897 33 3 31.80%
Market Research
Survey by MarketResearch.com
• Who was surveyed? Residents of Upland, Rancho
Cucamonga, and Claremont.
• How many Surveyed? 4,000
• Response Rate 76%
11
Survey Questions
How often do you shop at a discount store?
12
Results
Weekly-10%
Bi-Weekly 25%
Monthly 50%
Never 15%
Market Analysis
Quality merchandise is important to me.
13
Results
Highly Important-55%
Somewhat Important-25%
Not Important-15%
Don't Care-5%
Market Analysis
Competitive Analysis
Who’s the Competition?
Dollar Tree 99 Cent Stores
Family Dollar Dollar General
14
Competitive Analysis
14
Stores
More Price
Range
Higher
Quality
Name Brands
Food
Products
Wide Variety
of Products
99 Cent
Stores
Dollar Tree
Family
Dollar
Dollar
General
Dollar
Power Store
Merchandise
Products
Our Price
Dollar Power
Competitor
Family Dollar
Party Supplies-Party Bag $1.00 $1.00
Cleaning Products-Bleach $2.00 $2.50
Baby Products-Shampoo $1.00 $1.50
Pet Supplies-Dog Treats $1.00 $1.85
Household Items-Hangers $1.00 $1.25
16
Price vs Cost
Gross Margin
• Price $1.00
• Cost (0.65)
• Gross Margin: $0.35
17
Advertising
• Internet
www.GoDaddy.com
18
• Printed Ads
PennySaver
Inland Valley Daily Bulletin
19
Advertising
Promotion Events
Opening Day
Community Events
Side Walk Sale
Senior Citizen Day
20
Marketing Budget
21
Media Monthly Yearly
Other Events $1,000 $12,000
Inland Valley Daily Bulletin $314 $3,768
PennySaver $740 $9,620
Hosted Website-GoDaddy.com $15 $180
Business Cards (2,500 Qty) $34
Even Costs-Opening Day $6,500
Total $32,102
Channel Members
Partner with:
17
John F. Smith
Chief Operating Officer
Presenting
Store Location
1902 N. Campus Ave, Suite G
Upland, CA 91784
Store Front
Floor Plan
Store Picture
Store Picture
Schedule
Risk Matrix
Cost Analysis
Item Cost X Subtotal Total
Rental Deposit $4,000.00 $4,000.00
Rent $19,000.00 $19,000.00
Business
License/Permit
$663.00 $663.00
Marketing $32,102.00 $32,102.00
Info. Tech. $12,815.00 $12,815.00
Payroll $10,720.00 $10,720.00
Inventory $25,000.00 $5sq.ft*5000sq
.ft.
$25,000.00
Store Sign $3,000.00 $3,000.00
Total Start Up $107,300.00
Operating Strategy
Find Location
Lease
Permits
Utilities
Phone Lines Signs Network Purchase
Inventory
Stock Shelves
Publish Number
Walk Troughs
Inventory Input
Installation Hardware Install
Pricing Labels
Presenting
John F. Smith
Chief Human Resource Officer
HR Core Values
• Customer Service
• Customer Appreciation
• Customer Satisfaction
• Rapid response to customer needs
• Engage the Customer
• Hire and Train Employees to adhere to these
values
Employee Recognition
• Training
• Workforce Development and Empowerment
• Pep Rallies/Meetings
• Evaluations
• Promotional Appraisals
• Rewards, Employee of the Month
Organizational Chart
Eric Andrews, CFO Luis Valentin, CIO John F. Smith, COO
Lupe Gomez, CEO
Store Manager
Cashier Cashier
Floor Person Floor Person Floor Person
Wage and Cost Breakdown
Position Monthly Salary Hr. Rate Hrs. Tax (30.1%) Total Salary
Manager $15.00 40 $180.00 $600.00
Cashier $10.00 40 $120.40 $400.00
Cashier $8.00 40 $96.32 $320.00
Stock $8.00 40 $96.32 $320.00
• Lupe Gomez
• Chief Executive Officer
• 9 Years Marketing Experience
• Keller Graduate School of
Management
• Master’s in Business Administration
Dollar Power Team
• John F Smith
• Chief Operations Officer
• 10 years Operations Manager
• 8 Years Human Resource Specialist
• Keller Graduate School of
Management
• Master’s in Project Management
Dollar Power Team
• Luis Valentin
• Chief Information Officer
• 15 years Information Technology
• C.I.S.S.P. Certified
• Keller Graduate School of
Management
• Master’s in Information Systems
Management
Dollar Power Team
• Eric Andrews
• Chief Financial Officer
• 9 Years Certified Public Accountant
• Keller Graduate School of
Management
• Master of Accounting and Financial
management
Dollar Power Team
Presenting
Luis Valentin
Chief Information Officer
42
Presentation
• Logo Design
• Problem Analysis
• Network Design Strategy
• Driving Business Application
• Cost Savings
43
Dollar Power Logo
• Let us renew your faith in the mighty dollar
• Let us empower you
• Let us provide big savings
• Let us help you
44
Starbucks Like
Mr. Bottom Dollar
Problem Analysis
• Facilitate the Business Process
• Capture Information
• Management Information
• Business Intelligence
• Business Strategic Planning
45
•Credit Card Purchases
•ATM Purchases
•Cash Transactions
•Returns
•Customer Information
•Transaction Information
•Inventory Tracking
•Sales
•Inventory
•Returns
•Best Selling Item
•Customer Demographics
•Returned Inventory
•Merchandise Inventory
•Advertisement
•Sales
Network Design Strategy
• Reliable
• Efficient
• Redundant
• Secure
• Scalable
• Within budget
46
How It All Works
47
Router
Switch
File Server
On-Site Back-Up Server
Register 1Register 2
Workstation
Leased Data Line
Hosted Website / E-mail Service Off-Site Recovery Center
Video Surveillance System
Anti-Virus
NIDS
Video
Uninterruptible Power Supply
Port Closures Firewall Restrictions
Redundancy
Hosted Services
Firewall
Firewall
Network Architectural Plan
48
Business Application
49
QuickBooks Point of Sale Pro V9
–Support Peripherals
–Manages Sales Transactions
–Customer Information
–Inventory Tracking
– Accounting
–Management Reports
–Business Intelligence Analysis Reports
Cost Savings
• Outsourced
• RFP
• Feasibility Test
• Bundle Savings
• Service Level Agreements
–Service Cost
–24/7
50
What Does It Mean To You
• Sound Network
• Strategic design
• Business process support
– Efficient and Reliable
– Secure
– Protect business assets
• Real business value / Business Intelligence
• Increase the ROI potential
51
Presenting
Eric Andrews
Chief Financial Officer
52
Financial Summary
53
Return on Investment 20%
Economic Value Created ($thousands) $ 265
Key Assumptions
54
Sales Growth Rates 4.00%
Loan Amount Requested ($thousands) 220
Loan Maturity (years) 5
Annual Interest Rate 5.00%
Annual Capital Expenditures > Depreciation Expense
Team Contributes $10,000 to Create a C Corporation
Income Statement
55
2011 2012 2013 2014 2015
Sales 10,000 10,040 10,082 11,125 11,170
Operating
Income 2,105 2,189 2,277 2,368 2,463
Net Income 1,256 1,307 1,359 1,414 1,471
Balance Sheet
56
2011 2012 2013 2014 2015
Total Assets 1,496 2,804 4,164 5,578 7,050
Liabilities 230 230 231 231 232
Owner's Equity 1,266 2,573 3,933 5,347 6,818
Liabilities & O/E 1,496 2,804 4,164 5,578 7,050
Key Ratios
57
2011 2012 2013 2014 2015
ROI 83.96% 46.61% 32.65% 25.35% 20.87%
Net Income Margin 12.57% 12.57% 12.57% 12.57% 12.57%
Gross Margin 25.00% 25.00% 25.00% 25.00% 25.00%
Tax Rate 40.00% 40.00% 40.00% 40.00% 40.00%
Net Income Growth - 4.02% 4.02% 4.02% 4.02%
Times Int. Earned 191.36 199.02 206.98 215.26 223.87
Break Even Analysis
58
2011 2012 2013 2014 2015
Operating Expenses $395,000 $410,800 $427,232 $444,321 $462,094
Avg. Price per Unit $ 1.00 $ 1.00 $ 1.00 $ 1.00 $ 1.00
Cost per Unit $ .65 $ .65 $ .65 $ .65 $ .65
Units to Breakeven 1,128,571 1,173,714 1,220,663 1,269,489 1,320,269
Breakeven Revenues $ 1,129 $ 1,174 $ 1,221 $ 1,269 $ 1,320
Expected Revenues $ 10,000 $ 10,400 $ 10,816 $ 11,249 $ 11,699
Required Investment
• The Total Startup Investment Required:
$220,000
• Loan Details:
Maturity: 5 years
Interest rate: 5%
59
Plan B
Selling Business
60
The Next Step
Franchising
61
Any Questions?
62

Final Dollar Power Presentation

  • 1.
    Dollar Power Where yourDollar has Real Power By Lupe Gomez-CEO, Eric Andrews-CFO, John Smith-COO and Luis Valentin-CIO 1
  • 2.
    El Que Compra Barato,Compra Cada Rato. 2
  • 3.
    What does thatmean? You Get What You Pay For! 3
  • 4.
    Customers • Sell Productsbetween $1-$5 • Variety of Household Products • Quality Products • Great Customer Service 4 What We Offer
  • 5.
    Investors • ROI of0.20 Source: www.YahooFinance.com • $40 Billion Industry • Growth Rate 3Xs more than Department Stores Source: www.koleimports.com 5 What We Offer
  • 6.
    What We Offer •“Best Year Ever in 2008 & Success Continues in 2009.” • “Since 2001 Dollar Stores have grown 54%.” Source: en-us.nielsen.com • “Fastest growing and most Profitable business opportunities today.” According to The Wall Street, USA Today & LA Times 6
  • 7.
    Map Location 7 • 1902N. Campus Ave Suite G in Upland Ca. 91785 •5,000 sq. ft.
  • 8.
    Hook 8 • We arethe Nordstrom Rack of the dollar stores. • Where your Dollar has real Power.
  • 9.
    Target Market Ideal Customer •Bargain Shoppers • Families of 2 or more • Income of $70,000 + • Age 35+ 9
  • 10.
    Demographics Source: US Census& Yahoo.com 10 City Average Income Average Age Average # in Household Growth Rate Of Population Upland $76,856 34 3 5.20% Claremont $107,287 37 3 2.60% Rancho Cucamonga $80,897 33 3 31.80%
  • 11.
    Market Research Survey byMarketResearch.com • Who was surveyed? Residents of Upland, Rancho Cucamonga, and Claremont. • How many Surveyed? 4,000 • Response Rate 76% 11
  • 12.
    Survey Questions How oftendo you shop at a discount store? 12 Results Weekly-10% Bi-Weekly 25% Monthly 50% Never 15% Market Analysis
  • 13.
    Quality merchandise isimportant to me. 13 Results Highly Important-55% Somewhat Important-25% Not Important-15% Don't Care-5% Market Analysis
  • 14.
    Competitive Analysis Who’s theCompetition? Dollar Tree 99 Cent Stores Family Dollar Dollar General 14
  • 15.
    Competitive Analysis 14 Stores More Price Range Higher Quality NameBrands Food Products Wide Variety of Products 99 Cent Stores Dollar Tree Family Dollar Dollar General Dollar Power Store
  • 16.
    Merchandise Products Our Price Dollar Power Competitor FamilyDollar Party Supplies-Party Bag $1.00 $1.00 Cleaning Products-Bleach $2.00 $2.50 Baby Products-Shampoo $1.00 $1.50 Pet Supplies-Dog Treats $1.00 $1.85 Household Items-Hangers $1.00 $1.25 16
  • 17.
    Price vs Cost GrossMargin • Price $1.00 • Cost (0.65) • Gross Margin: $0.35 17
  • 18.
  • 19.
    • Printed Ads PennySaver InlandValley Daily Bulletin 19 Advertising
  • 20.
    Promotion Events Opening Day CommunityEvents Side Walk Sale Senior Citizen Day 20
  • 21.
    Marketing Budget 21 Media MonthlyYearly Other Events $1,000 $12,000 Inland Valley Daily Bulletin $314 $3,768 PennySaver $740 $9,620 Hosted Website-GoDaddy.com $15 $180 Business Cards (2,500 Qty) $34 Even Costs-Opening Day $6,500 Total $32,102
  • 22.
  • 23.
    John F. Smith ChiefOperating Officer Presenting
  • 24.
    Store Location 1902 N.Campus Ave, Suite G Upland, CA 91784
  • 25.
  • 26.
  • 27.
  • 28.
  • 29.
  • 30.
  • 31.
    Cost Analysis Item CostX Subtotal Total Rental Deposit $4,000.00 $4,000.00 Rent $19,000.00 $19,000.00 Business License/Permit $663.00 $663.00 Marketing $32,102.00 $32,102.00 Info. Tech. $12,815.00 $12,815.00 Payroll $10,720.00 $10,720.00 Inventory $25,000.00 $5sq.ft*5000sq .ft. $25,000.00 Store Sign $3,000.00 $3,000.00 Total Start Up $107,300.00
  • 32.
    Operating Strategy Find Location Lease Permits Utilities PhoneLines Signs Network Purchase Inventory Stock Shelves Publish Number Walk Troughs Inventory Input Installation Hardware Install Pricing Labels
  • 33.
    Presenting John F. Smith ChiefHuman Resource Officer
  • 34.
    HR Core Values •Customer Service • Customer Appreciation • Customer Satisfaction • Rapid response to customer needs • Engage the Customer • Hire and Train Employees to adhere to these values
  • 35.
    Employee Recognition • Training •Workforce Development and Empowerment • Pep Rallies/Meetings • Evaluations • Promotional Appraisals • Rewards, Employee of the Month
  • 36.
    Organizational Chart Eric Andrews,CFO Luis Valentin, CIO John F. Smith, COO Lupe Gomez, CEO Store Manager Cashier Cashier Floor Person Floor Person Floor Person
  • 37.
    Wage and CostBreakdown Position Monthly Salary Hr. Rate Hrs. Tax (30.1%) Total Salary Manager $15.00 40 $180.00 $600.00 Cashier $10.00 40 $120.40 $400.00 Cashier $10.00 40 $120.40 $400.00 Cashier $8.00 40 $96.32 $320.00 Cashier $8.00 40 $96.32 $320.00 Stock $8.00 40 $96.32 $320.00 Stock $8.00 40 $96.32 $320.00
  • 38.
    • Lupe Gomez •Chief Executive Officer • 9 Years Marketing Experience • Keller Graduate School of Management • Master’s in Business Administration Dollar Power Team
  • 39.
    • John FSmith • Chief Operations Officer • 10 years Operations Manager • 8 Years Human Resource Specialist • Keller Graduate School of Management • Master’s in Project Management Dollar Power Team
  • 40.
    • Luis Valentin •Chief Information Officer • 15 years Information Technology • C.I.S.S.P. Certified • Keller Graduate School of Management • Master’s in Information Systems Management Dollar Power Team
  • 41.
    • Eric Andrews •Chief Financial Officer • 9 Years Certified Public Accountant • Keller Graduate School of Management • Master of Accounting and Financial management Dollar Power Team
  • 42.
  • 43.
    Presentation • Logo Design •Problem Analysis • Network Design Strategy • Driving Business Application • Cost Savings 43
  • 44.
    Dollar Power Logo •Let us renew your faith in the mighty dollar • Let us empower you • Let us provide big savings • Let us help you 44 Starbucks Like Mr. Bottom Dollar
  • 45.
    Problem Analysis • Facilitatethe Business Process • Capture Information • Management Information • Business Intelligence • Business Strategic Planning 45 •Credit Card Purchases •ATM Purchases •Cash Transactions •Returns •Customer Information •Transaction Information •Inventory Tracking •Sales •Inventory •Returns •Best Selling Item •Customer Demographics •Returned Inventory •Merchandise Inventory •Advertisement •Sales
  • 46.
    Network Design Strategy •Reliable • Efficient • Redundant • Secure • Scalable • Within budget 46
  • 47.
    How It AllWorks 47 Router Switch File Server On-Site Back-Up Server Register 1Register 2 Workstation Leased Data Line Hosted Website / E-mail Service Off-Site Recovery Center Video Surveillance System Anti-Virus NIDS Video Uninterruptible Power Supply Port Closures Firewall Restrictions Redundancy Hosted Services Firewall Firewall
  • 48.
  • 49.
    Business Application 49 QuickBooks Pointof Sale Pro V9 –Support Peripherals –Manages Sales Transactions –Customer Information –Inventory Tracking – Accounting –Management Reports –Business Intelligence Analysis Reports
  • 50.
    Cost Savings • Outsourced •RFP • Feasibility Test • Bundle Savings • Service Level Agreements –Service Cost –24/7 50
  • 51.
    What Does ItMean To You • Sound Network • Strategic design • Business process support – Efficient and Reliable – Secure – Protect business assets • Real business value / Business Intelligence • Increase the ROI potential 51
  • 52.
  • 53.
    Financial Summary 53 Return onInvestment 20% Economic Value Created ($thousands) $ 265
  • 54.
    Key Assumptions 54 Sales GrowthRates 4.00% Loan Amount Requested ($thousands) 220 Loan Maturity (years) 5 Annual Interest Rate 5.00% Annual Capital Expenditures > Depreciation Expense Team Contributes $10,000 to Create a C Corporation
  • 55.
    Income Statement 55 2011 20122013 2014 2015 Sales 10,000 10,040 10,082 11,125 11,170 Operating Income 2,105 2,189 2,277 2,368 2,463 Net Income 1,256 1,307 1,359 1,414 1,471
  • 56.
    Balance Sheet 56 2011 20122013 2014 2015 Total Assets 1,496 2,804 4,164 5,578 7,050 Liabilities 230 230 231 231 232 Owner's Equity 1,266 2,573 3,933 5,347 6,818 Liabilities & O/E 1,496 2,804 4,164 5,578 7,050
  • 57.
    Key Ratios 57 2011 20122013 2014 2015 ROI 83.96% 46.61% 32.65% 25.35% 20.87% Net Income Margin 12.57% 12.57% 12.57% 12.57% 12.57% Gross Margin 25.00% 25.00% 25.00% 25.00% 25.00% Tax Rate 40.00% 40.00% 40.00% 40.00% 40.00% Net Income Growth - 4.02% 4.02% 4.02% 4.02% Times Int. Earned 191.36 199.02 206.98 215.26 223.87
  • 58.
    Break Even Analysis 58 20112012 2013 2014 2015 Operating Expenses $395,000 $410,800 $427,232 $444,321 $462,094 Avg. Price per Unit $ 1.00 $ 1.00 $ 1.00 $ 1.00 $ 1.00 Cost per Unit $ .65 $ .65 $ .65 $ .65 $ .65 Units to Breakeven 1,128,571 1,173,714 1,220,663 1,269,489 1,320,269 Breakeven Revenues $ 1,129 $ 1,174 $ 1,221 $ 1,269 $ 1,320 Expected Revenues $ 10,000 $ 10,400 $ 10,816 $ 11,249 $ 11,699
  • 59.
    Required Investment • TheTotal Startup Investment Required: $220,000 • Loan Details: Maturity: 5 years Interest rate: 5% 59
  • 60.
  • 61.
  • 62.

Editor's Notes

  • #44 In my presentation I will be discussing the following: Our logo design and what it states about us and our business I will be discussing the proposed network infrastructure and it’s challenges I will touch upon our design strategy Speak on savings and cost analysis And review our timeline schedule
  • #45 Our logo was design to represent our business intention. Which is: Let us Renew your faith in the mighty dollar Let us empower you to shop Let us provide you with big savings and Let us help you through this though economy Aristotle once said:“The aim of art is to present not the outward appearance of things, but their inward significance” I really feel that we have capture that in our business logo today.
  • #46 What were the challenges when designing this network? One challenge was facilitating the business process, such as: Facilitating business transactions Credit and ATM purchases Returns Inventory Cash register processes Capturing business information such as: Business transaction Customer information Business intelligence (what items are selling the best) And it had to have Internet connectivity to assist with business process as well
  • #47 So what was the network design strategy? It had to be? Reliable Efficient Redundant Secure Scalable Within budget Imagine if you will, the analogy that my responsibility was to build you a car. The car has to be reliable, efficient, secure and economical but the chassis has to be great. In this case, the network backbone. As this company starts to grow, we can add different components like in our car new wheels, seats and body parts or in our scenario additional cashier stations, surveillance cameras and applications. But as we start to open new stores, we will use the same chassis thus standardizing our network design saving us time and money.
  • #48 Redundancy is very important when we talk about the business process. It is meant to capture, duplicate and store critical business processes and information in the event that a disaster or critical incident was to occur. Our network is designed to be redundant as well as back-up on-site and off.
  • #49 Our logo was design to represent our business intention. Which is: Let us Renew your faith in the mighty dollar Let us empower you to shop Let us provide you with big savings and Let us help you through this though economy Aristotle once said:“The aim of art is to present not the outward appearance of things, but their inward significance” I really feel that we have capture that in our business logo today.
  • #51 What did we do to save money? We invited vendors to participate and compete in several RFPs to obtain the best services, quality and pricing. We purchased software and hardware components in bundles saving us hundreds if not thousands of dollars in cost savings. Service level agreements with our vendors adds further savings since no IT staff will be needed to support the network or it’s components.
  • #53 Our logo was design to represent our business intention. Which is: Let us Renew your faith in the mighty dollar Let us empower you to shop Let us provide you with big savings and Let us help you through this though economy Aristotle once said:“The aim of art is to present not the outward appearance of things, but their inward significance” I really feel that we have capture that in our business logo today.
  • #54 In my presentation I will be discussing the following: Our logo design and what it states about us and our business I will be discussing the proposed network infrastructure and it’s challenges I will touch upon our design strategy Speak on savings and cost analysis And review our timeline schedule
  • #55 In my presentation I will be discussing the following: Our logo design and what it states about us and our business I will be discussing the proposed network infrastructure and it’s challenges I will touch upon our design strategy Speak on savings and cost analysis And review our timeline schedule
  • #56 In my presentation I will be discussing the following: Our logo design and what it states about us and our business I will be discussing the proposed network infrastructure and it’s challenges I will touch upon our design strategy Speak on savings and cost analysis And review our timeline schedule
  • #57 In my presentation I will be discussing the following: Our logo design and what it states about us and our business I will be discussing the proposed network infrastructure and it’s challenges I will touch upon our design strategy Speak on savings and cost analysis And review our timeline schedule
  • #58 In my presentation I will be discussing the following: Our logo design and what it states about us and our business I will be discussing the proposed network infrastructure and it’s challenges I will touch upon our design strategy Speak on savings and cost analysis And review our timeline schedule
  • #59 In my presentation I will be discussing the following: Our logo design and what it states about us and our business I will be discussing the proposed network infrastructure and it’s challenges I will touch upon our design strategy Speak on savings and cost analysis And review our timeline schedule