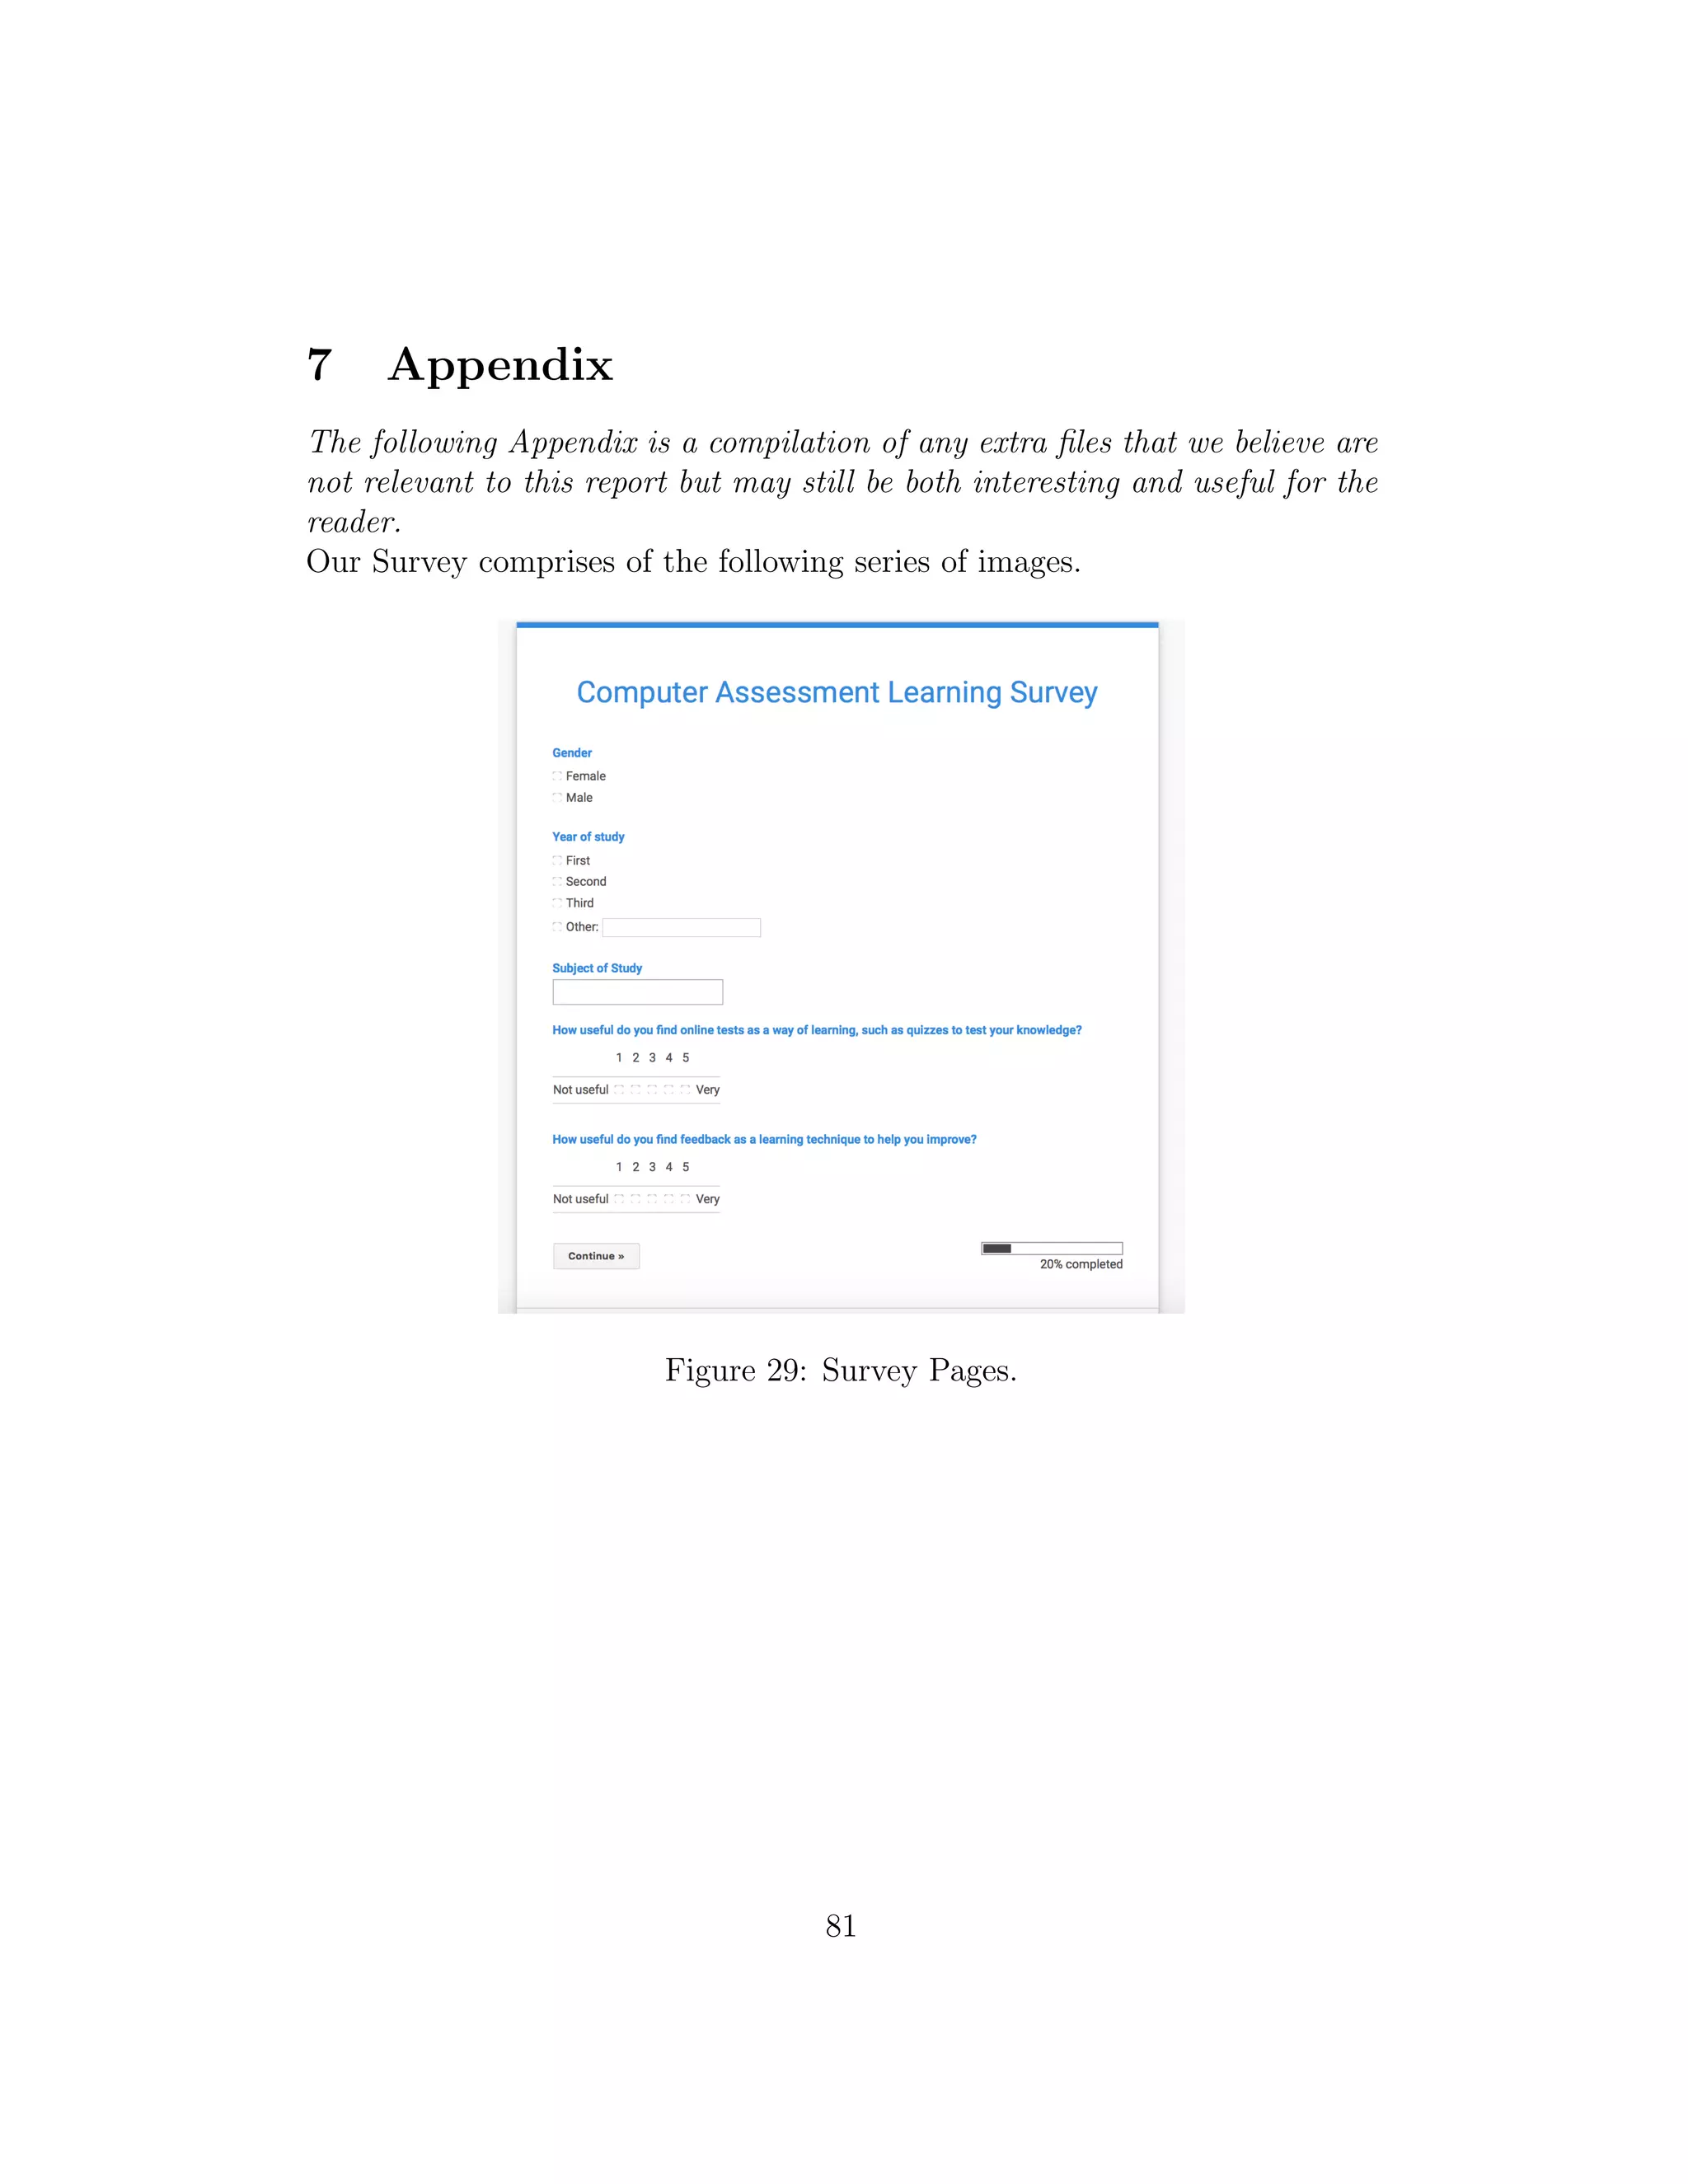
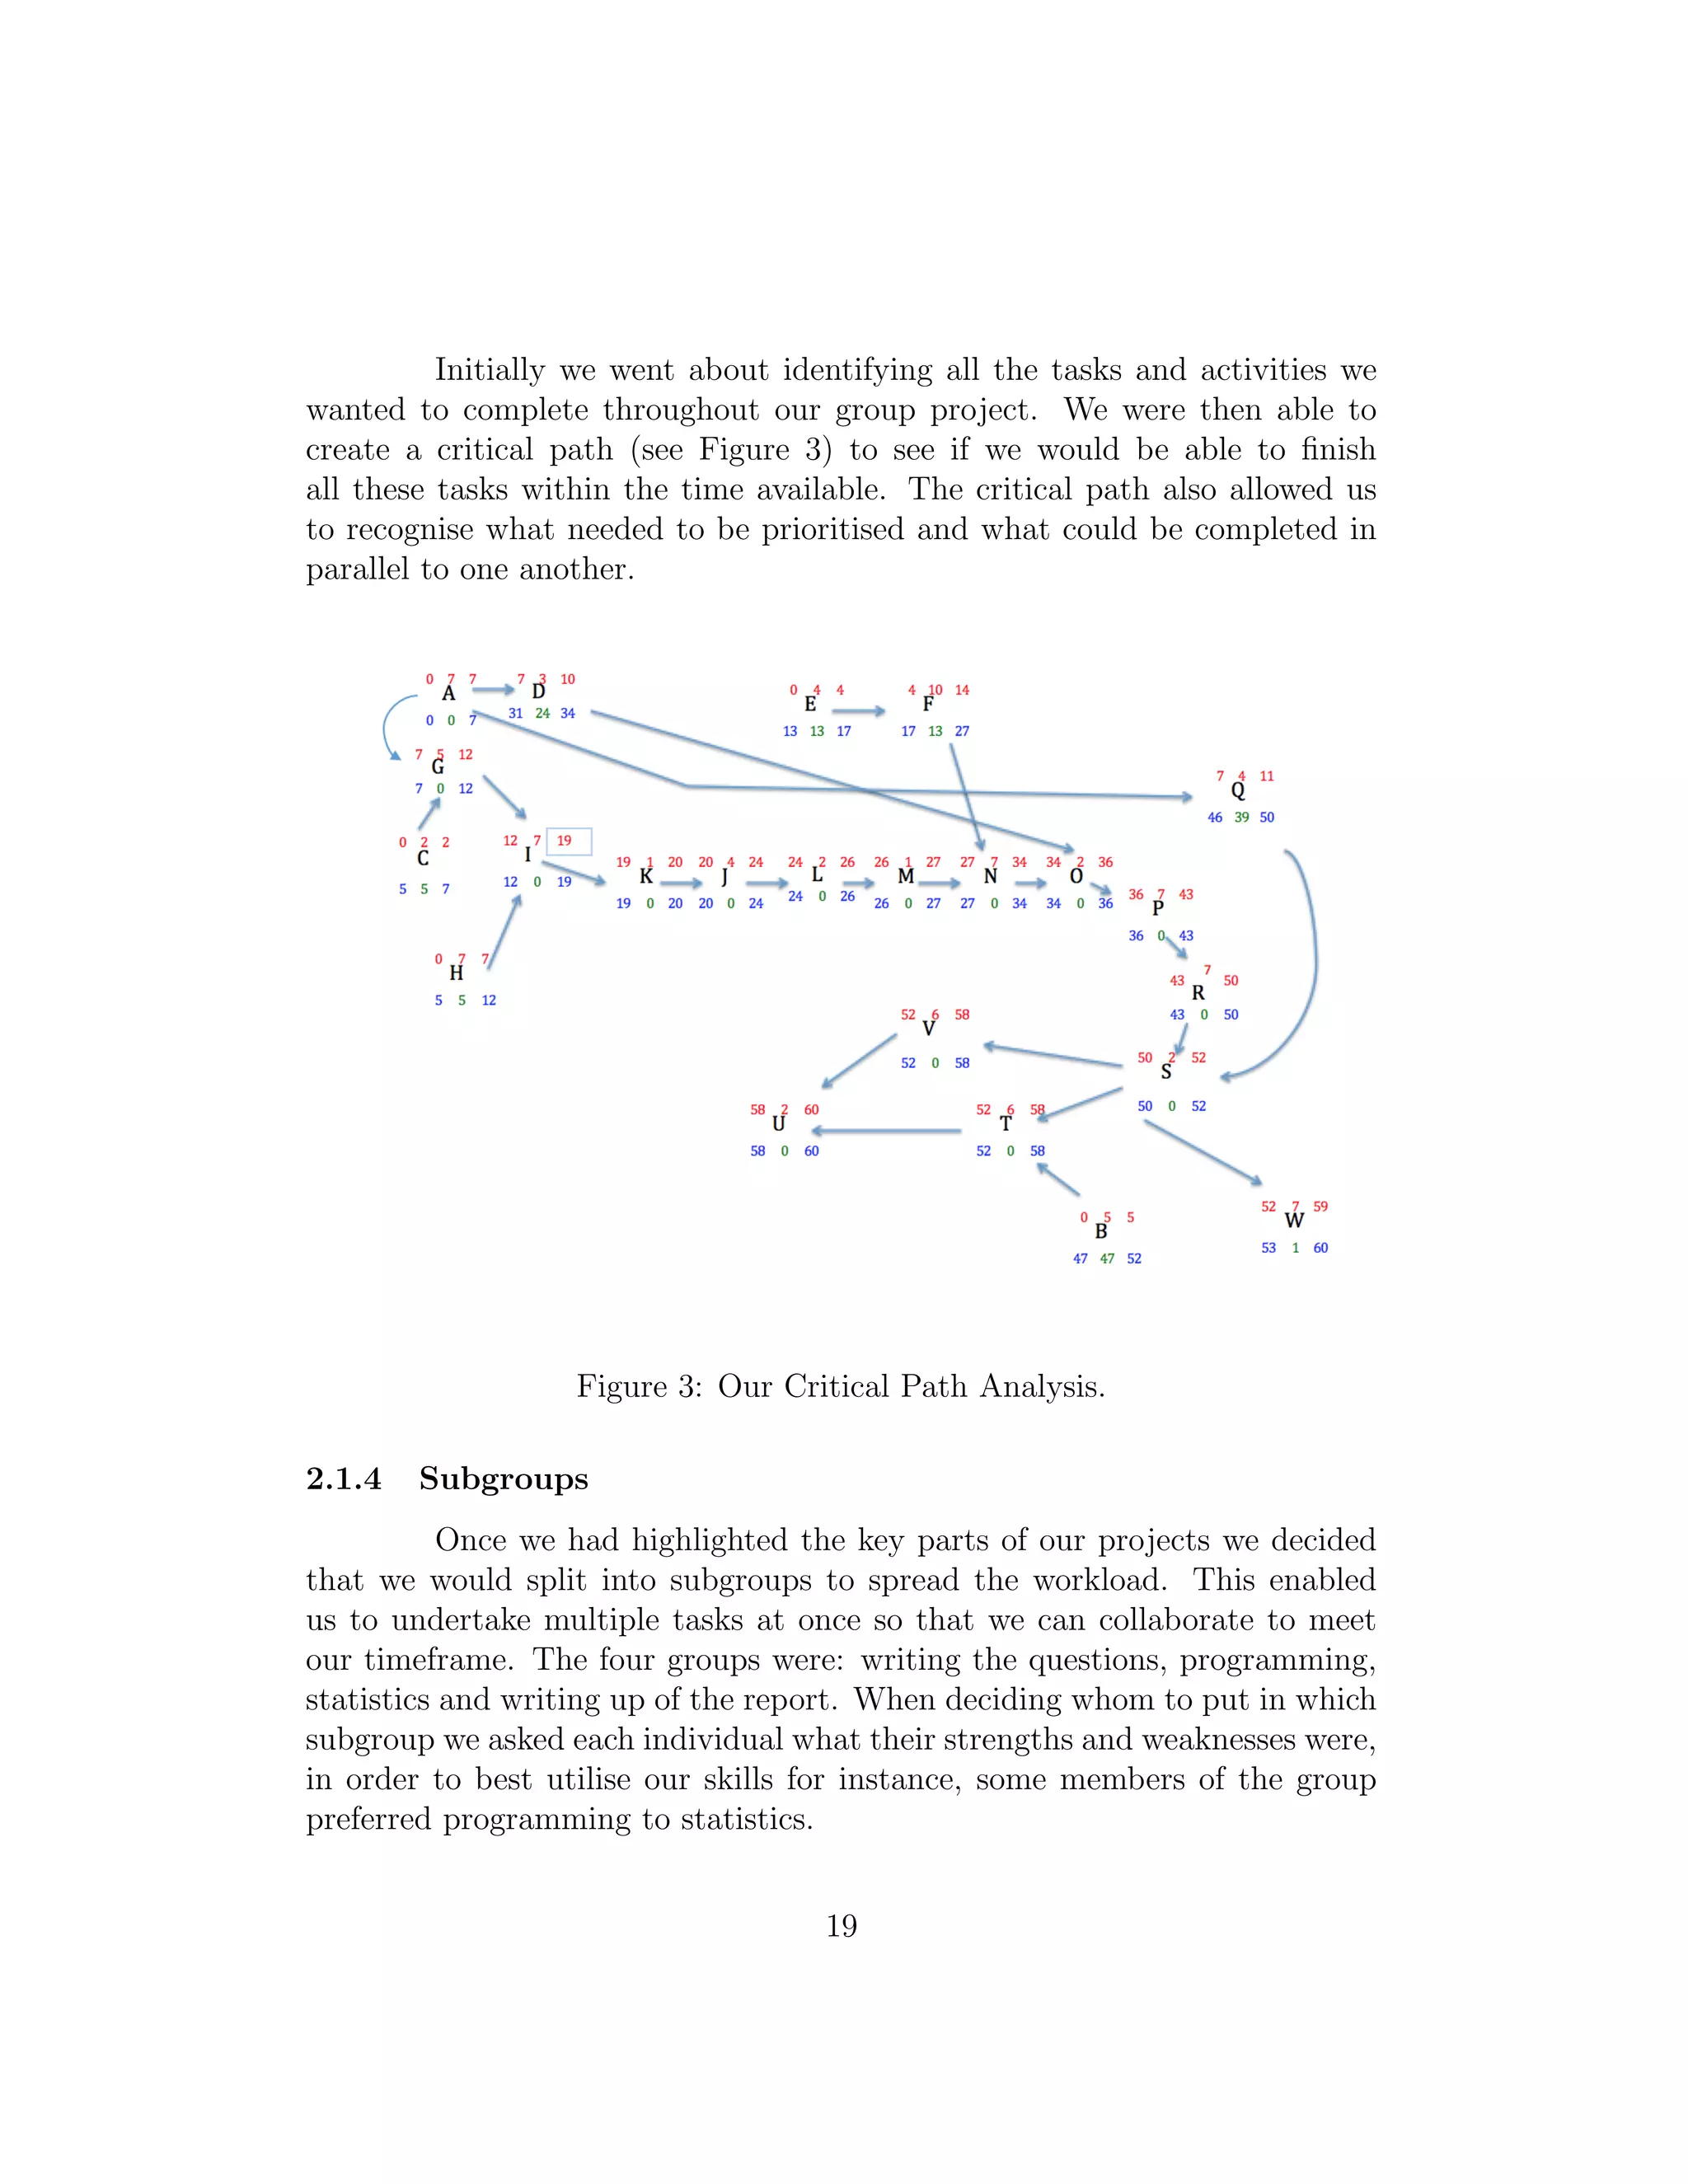
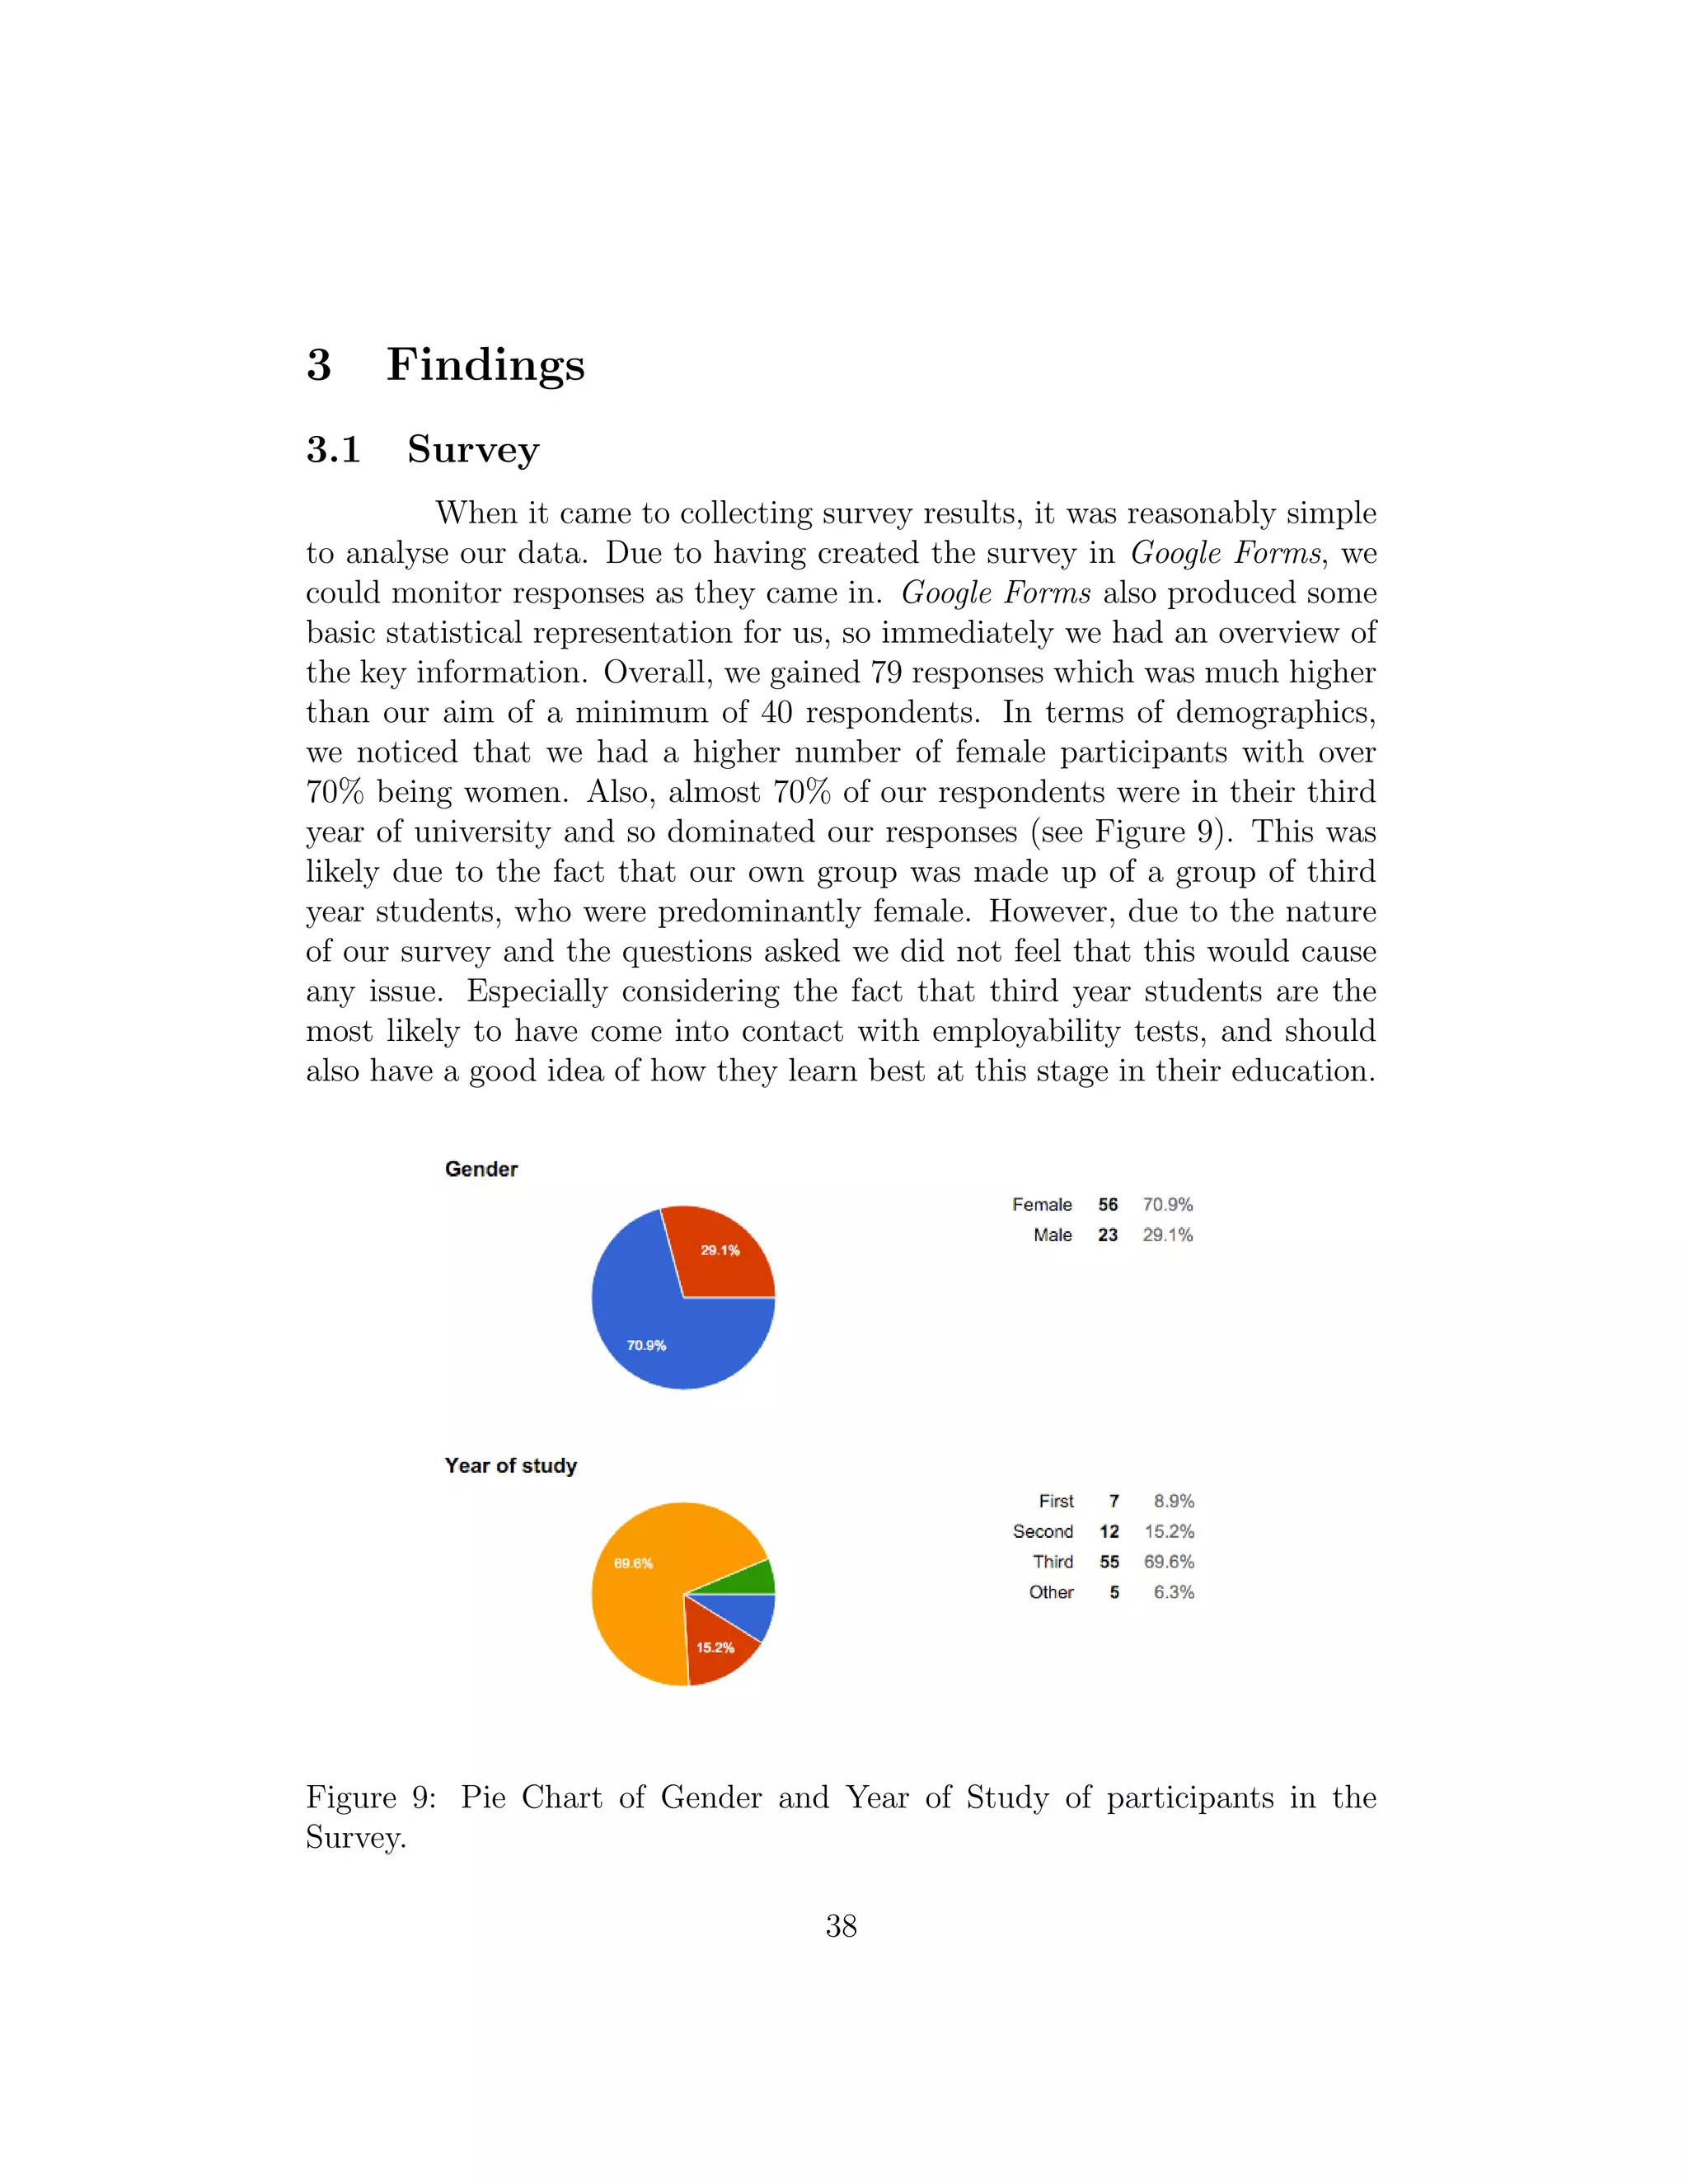
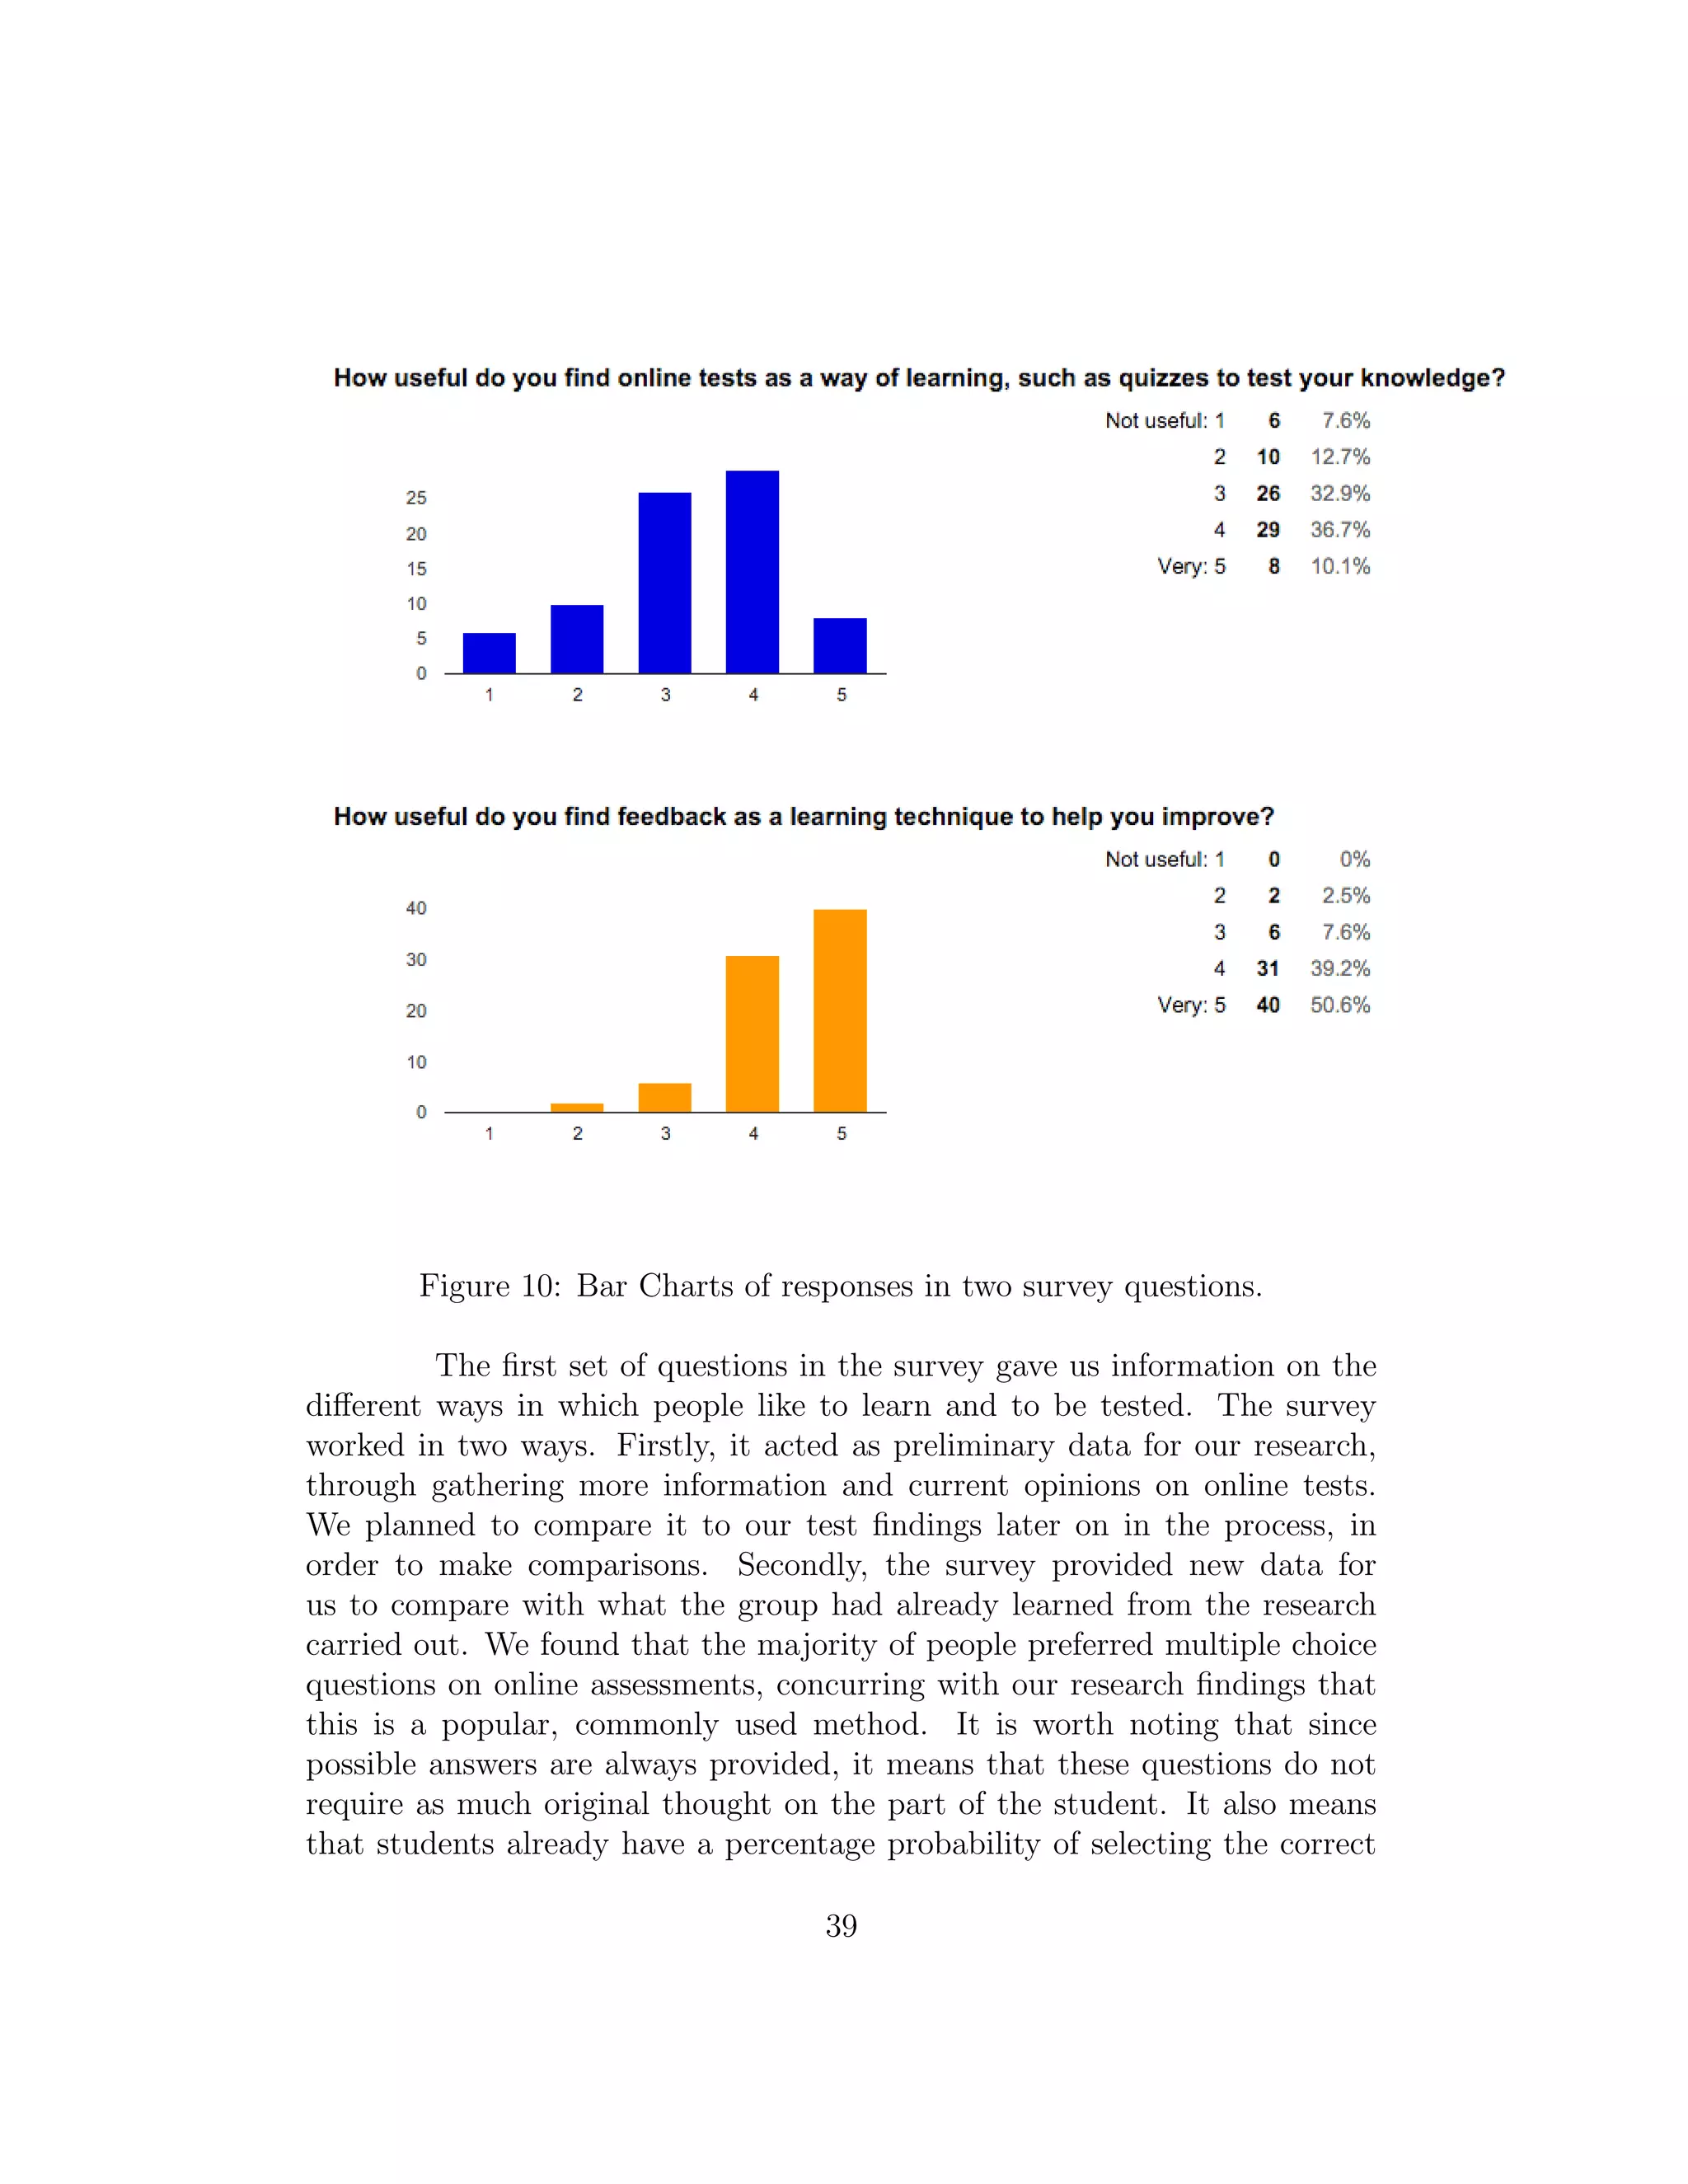
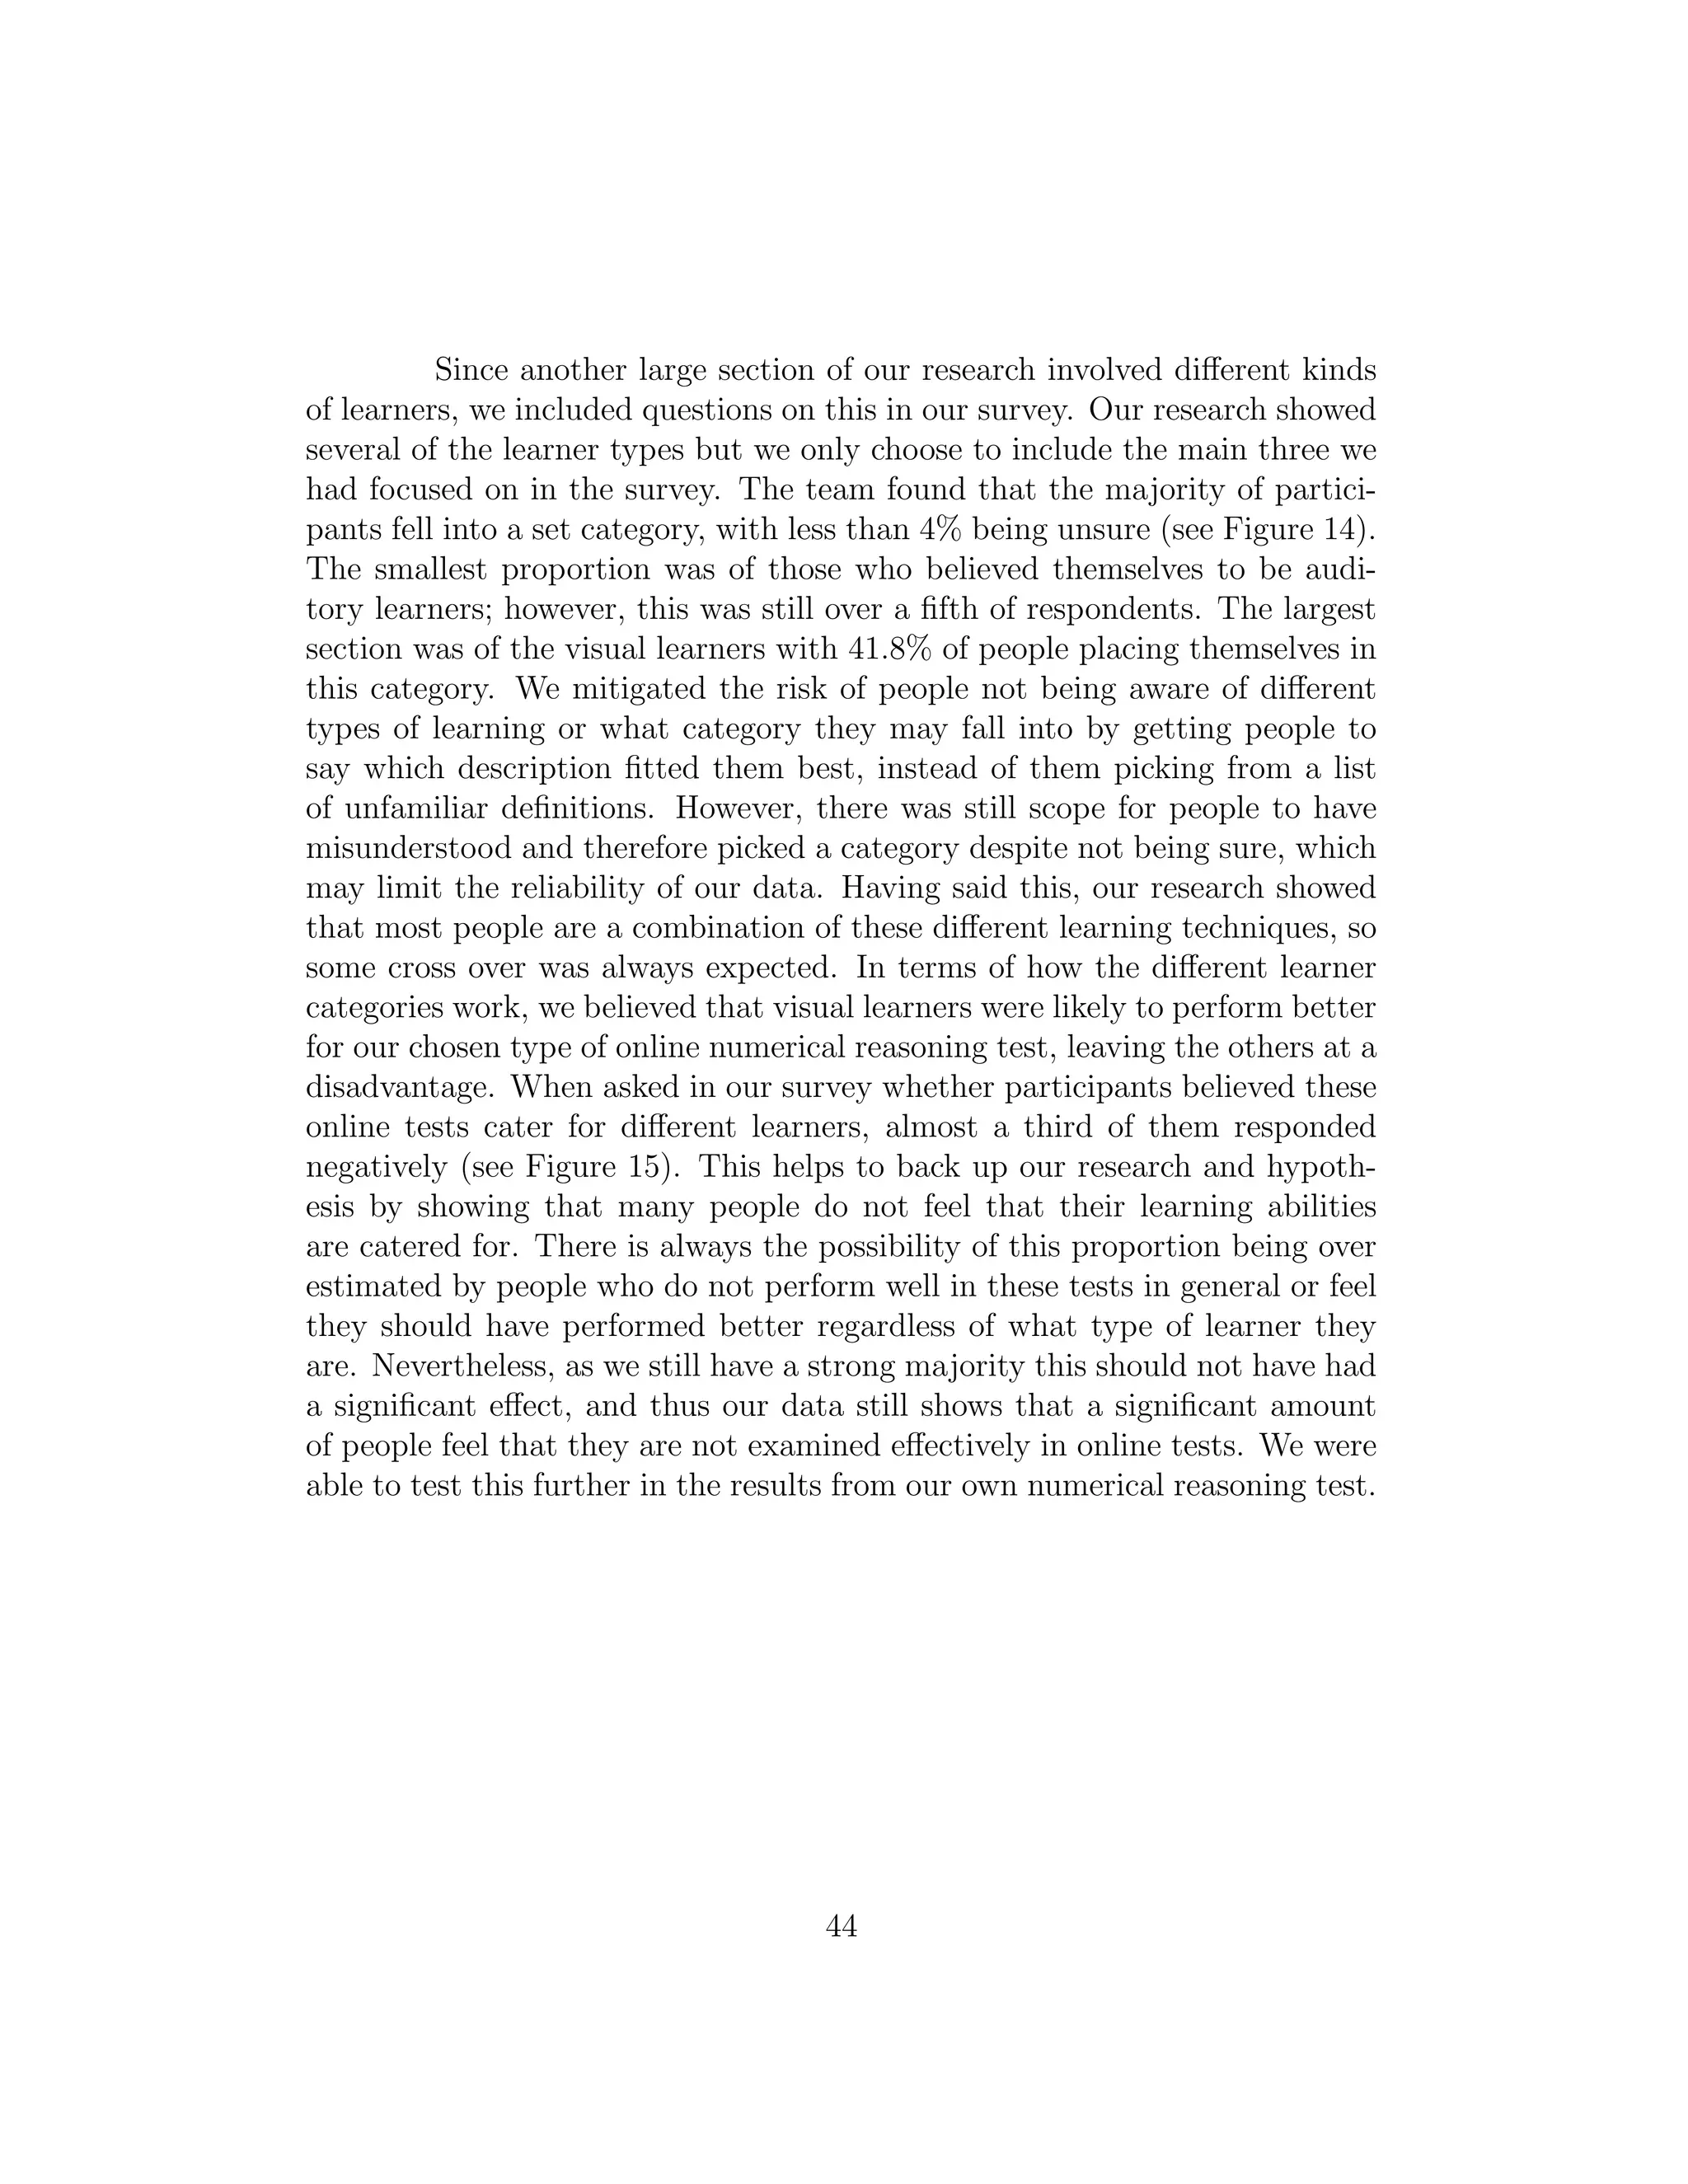
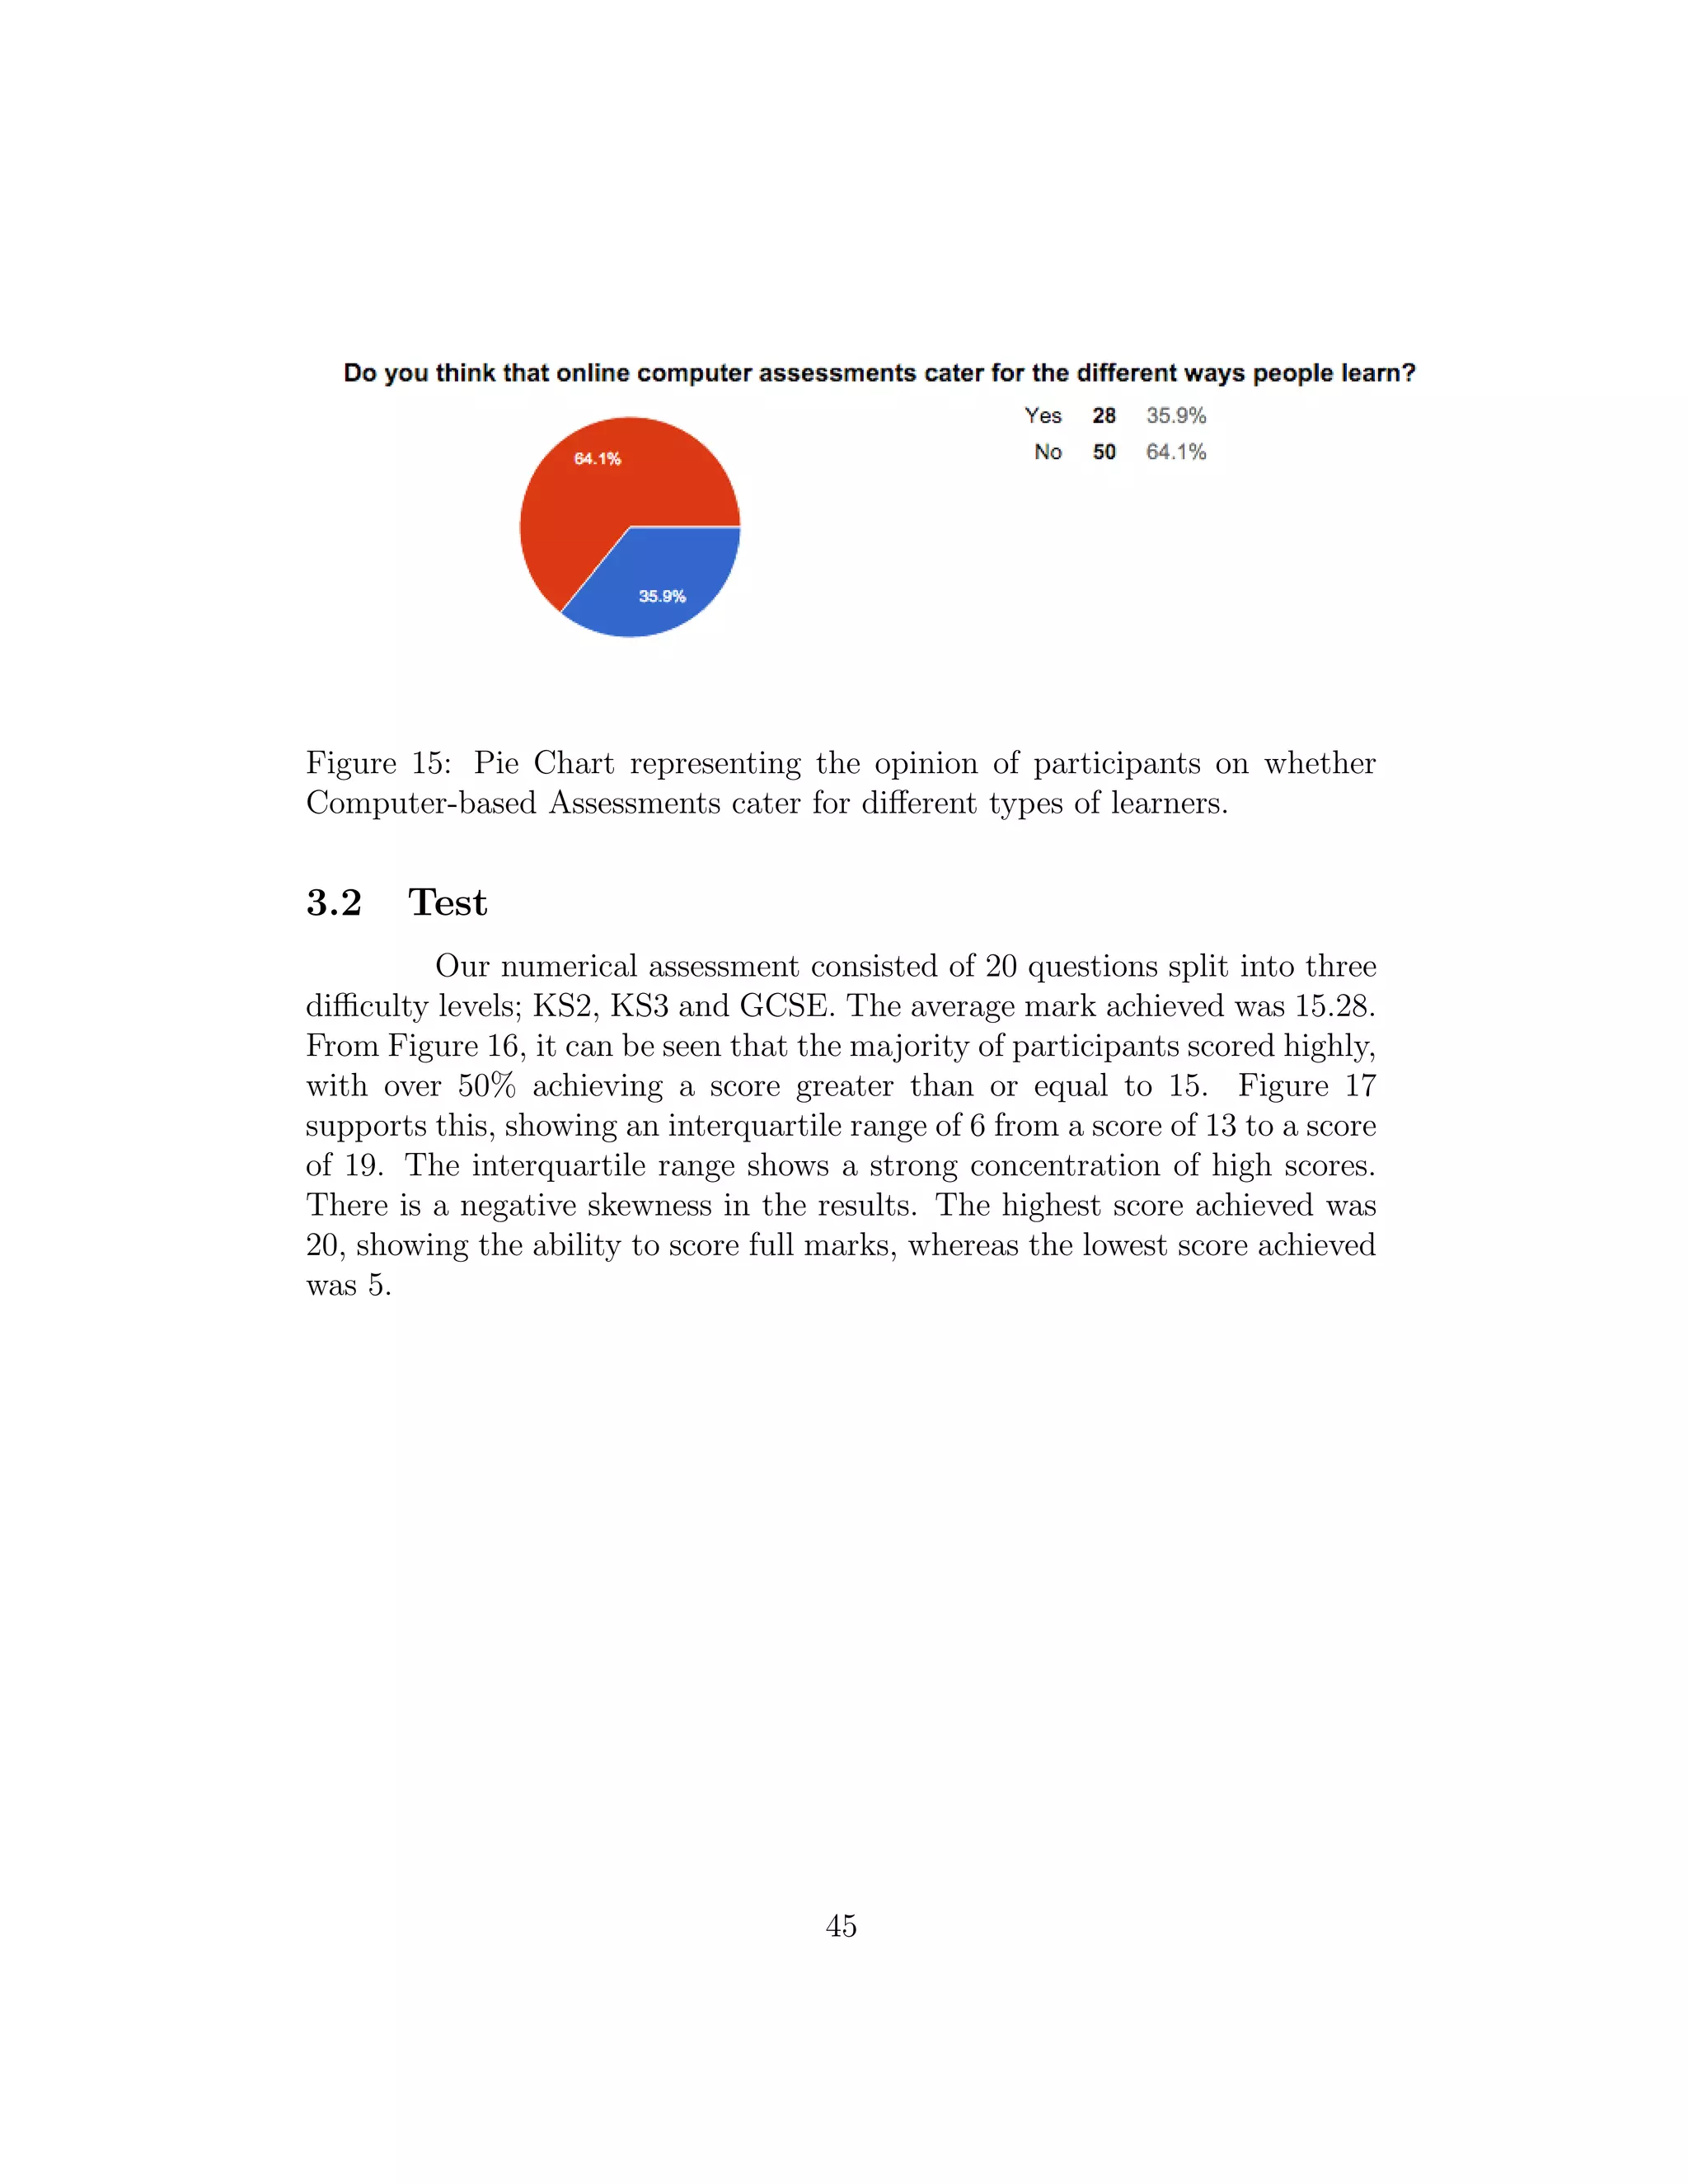
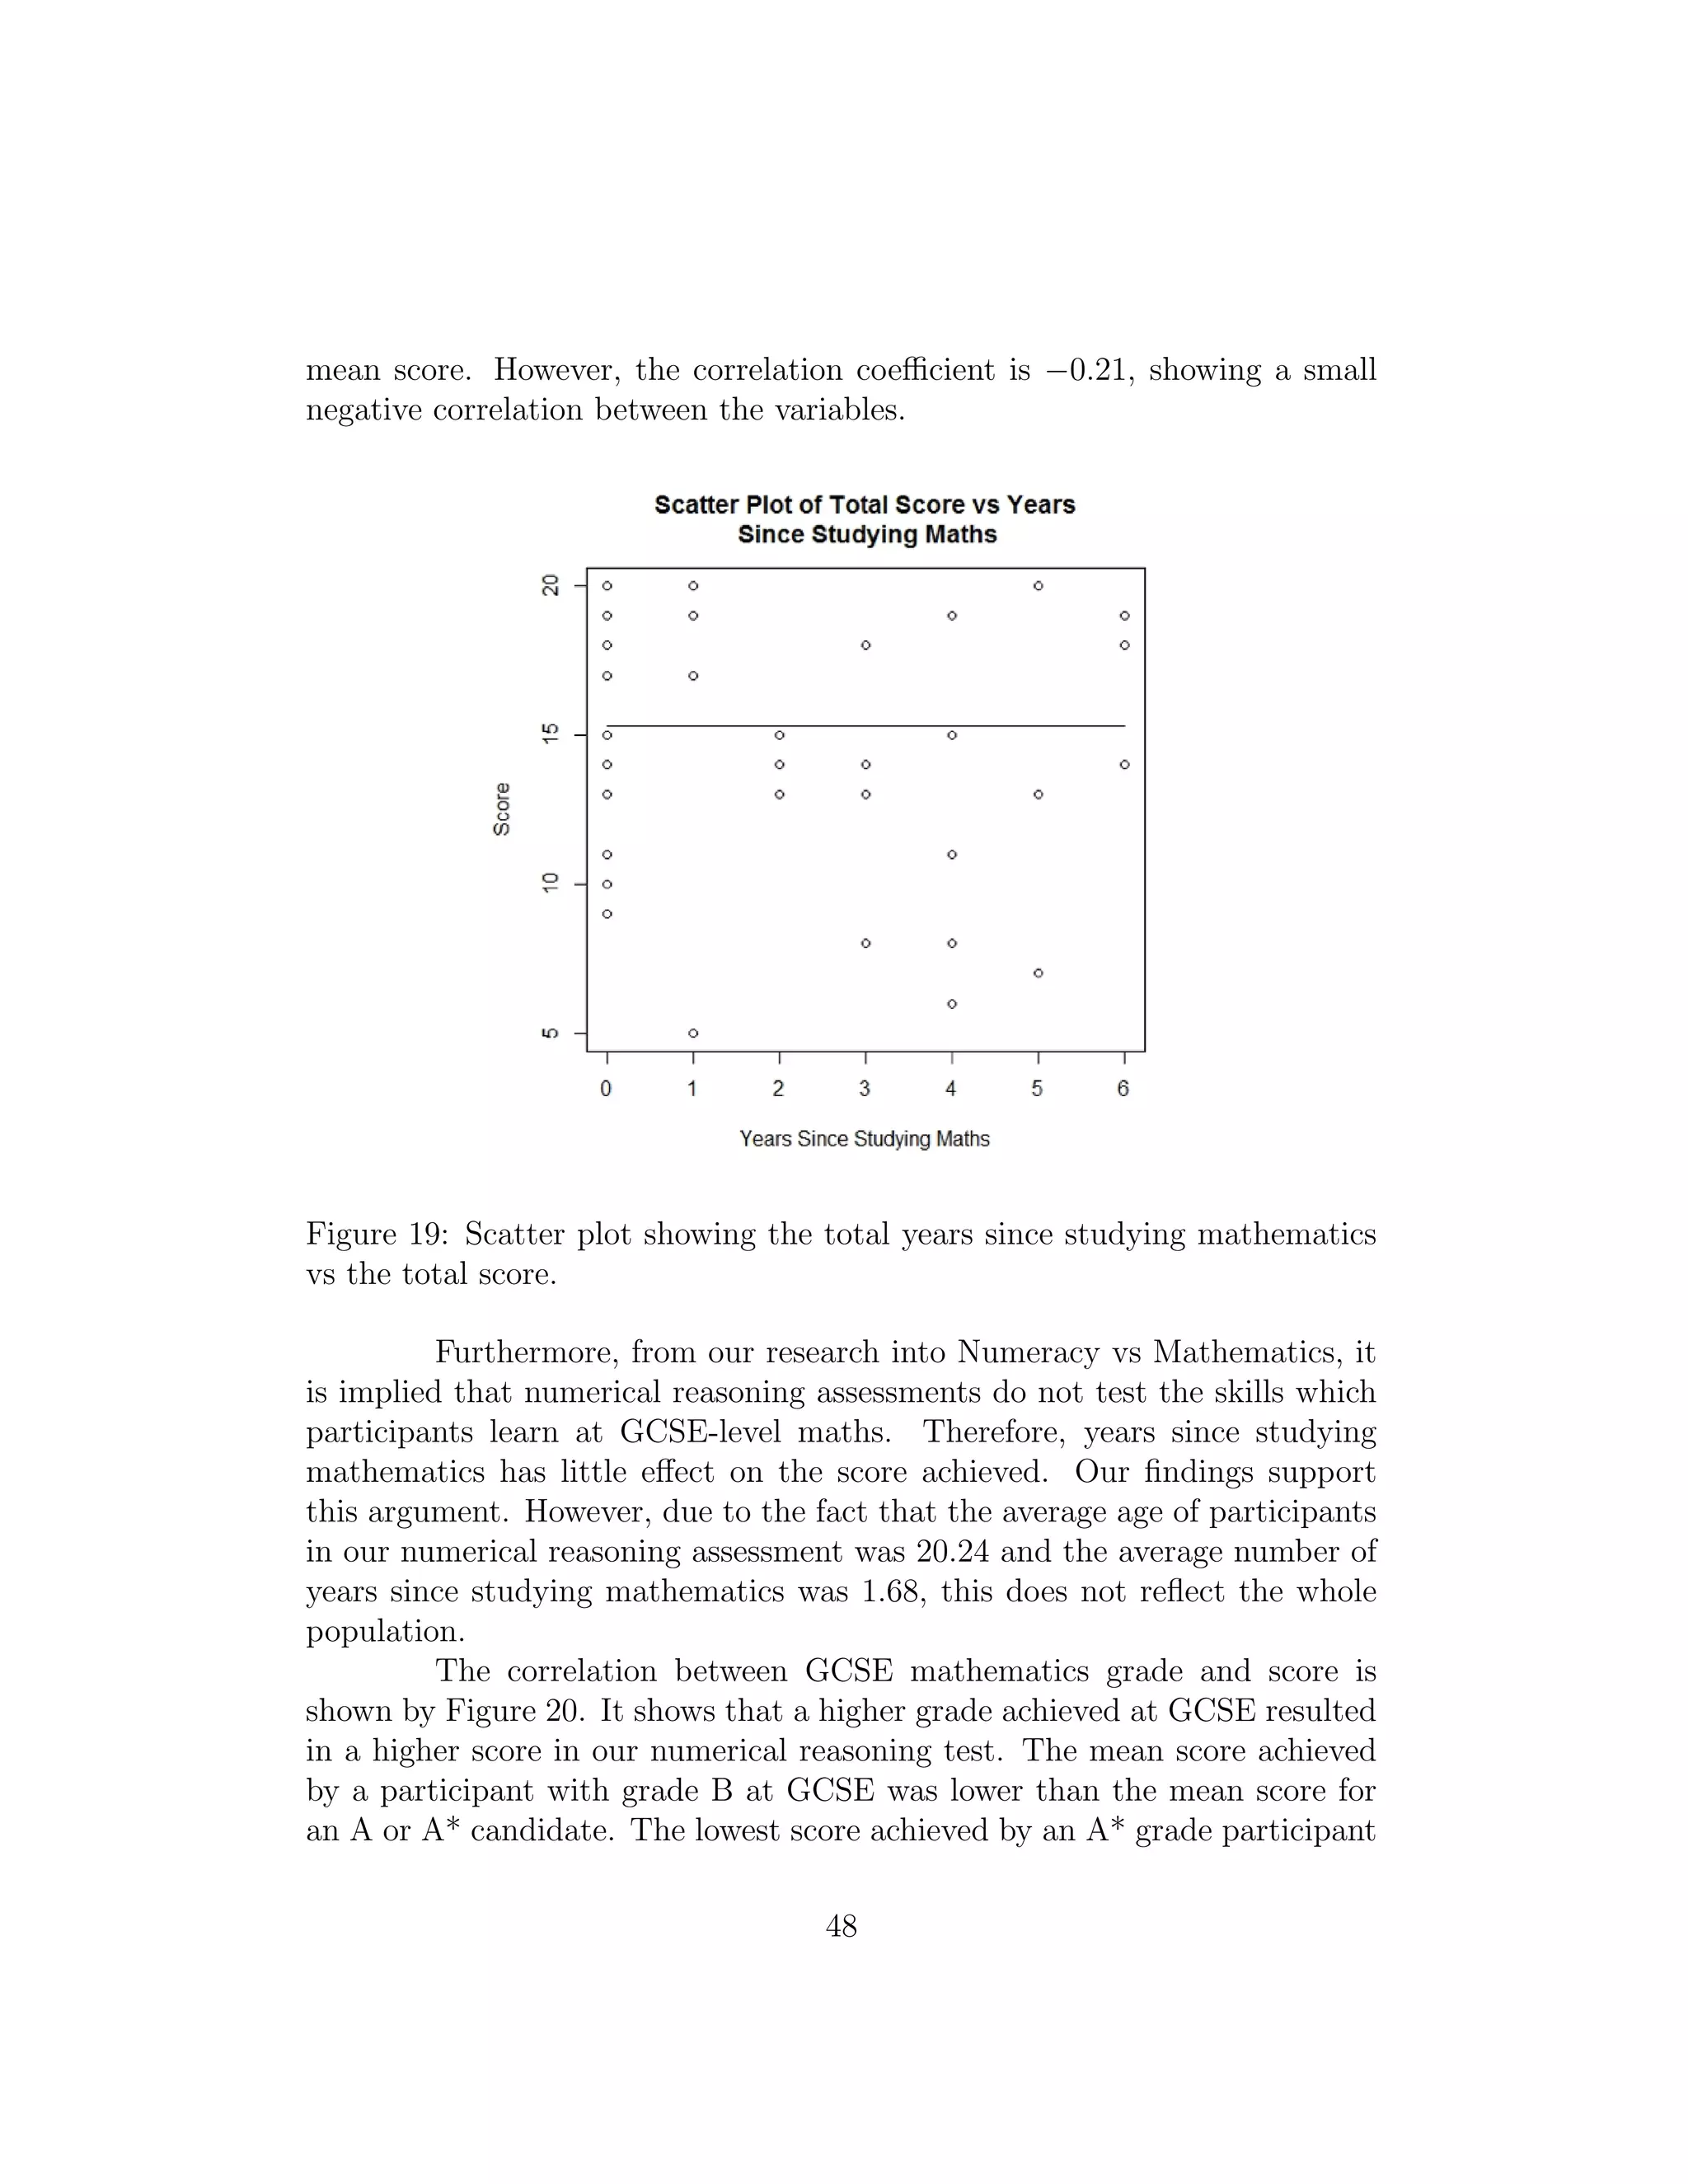
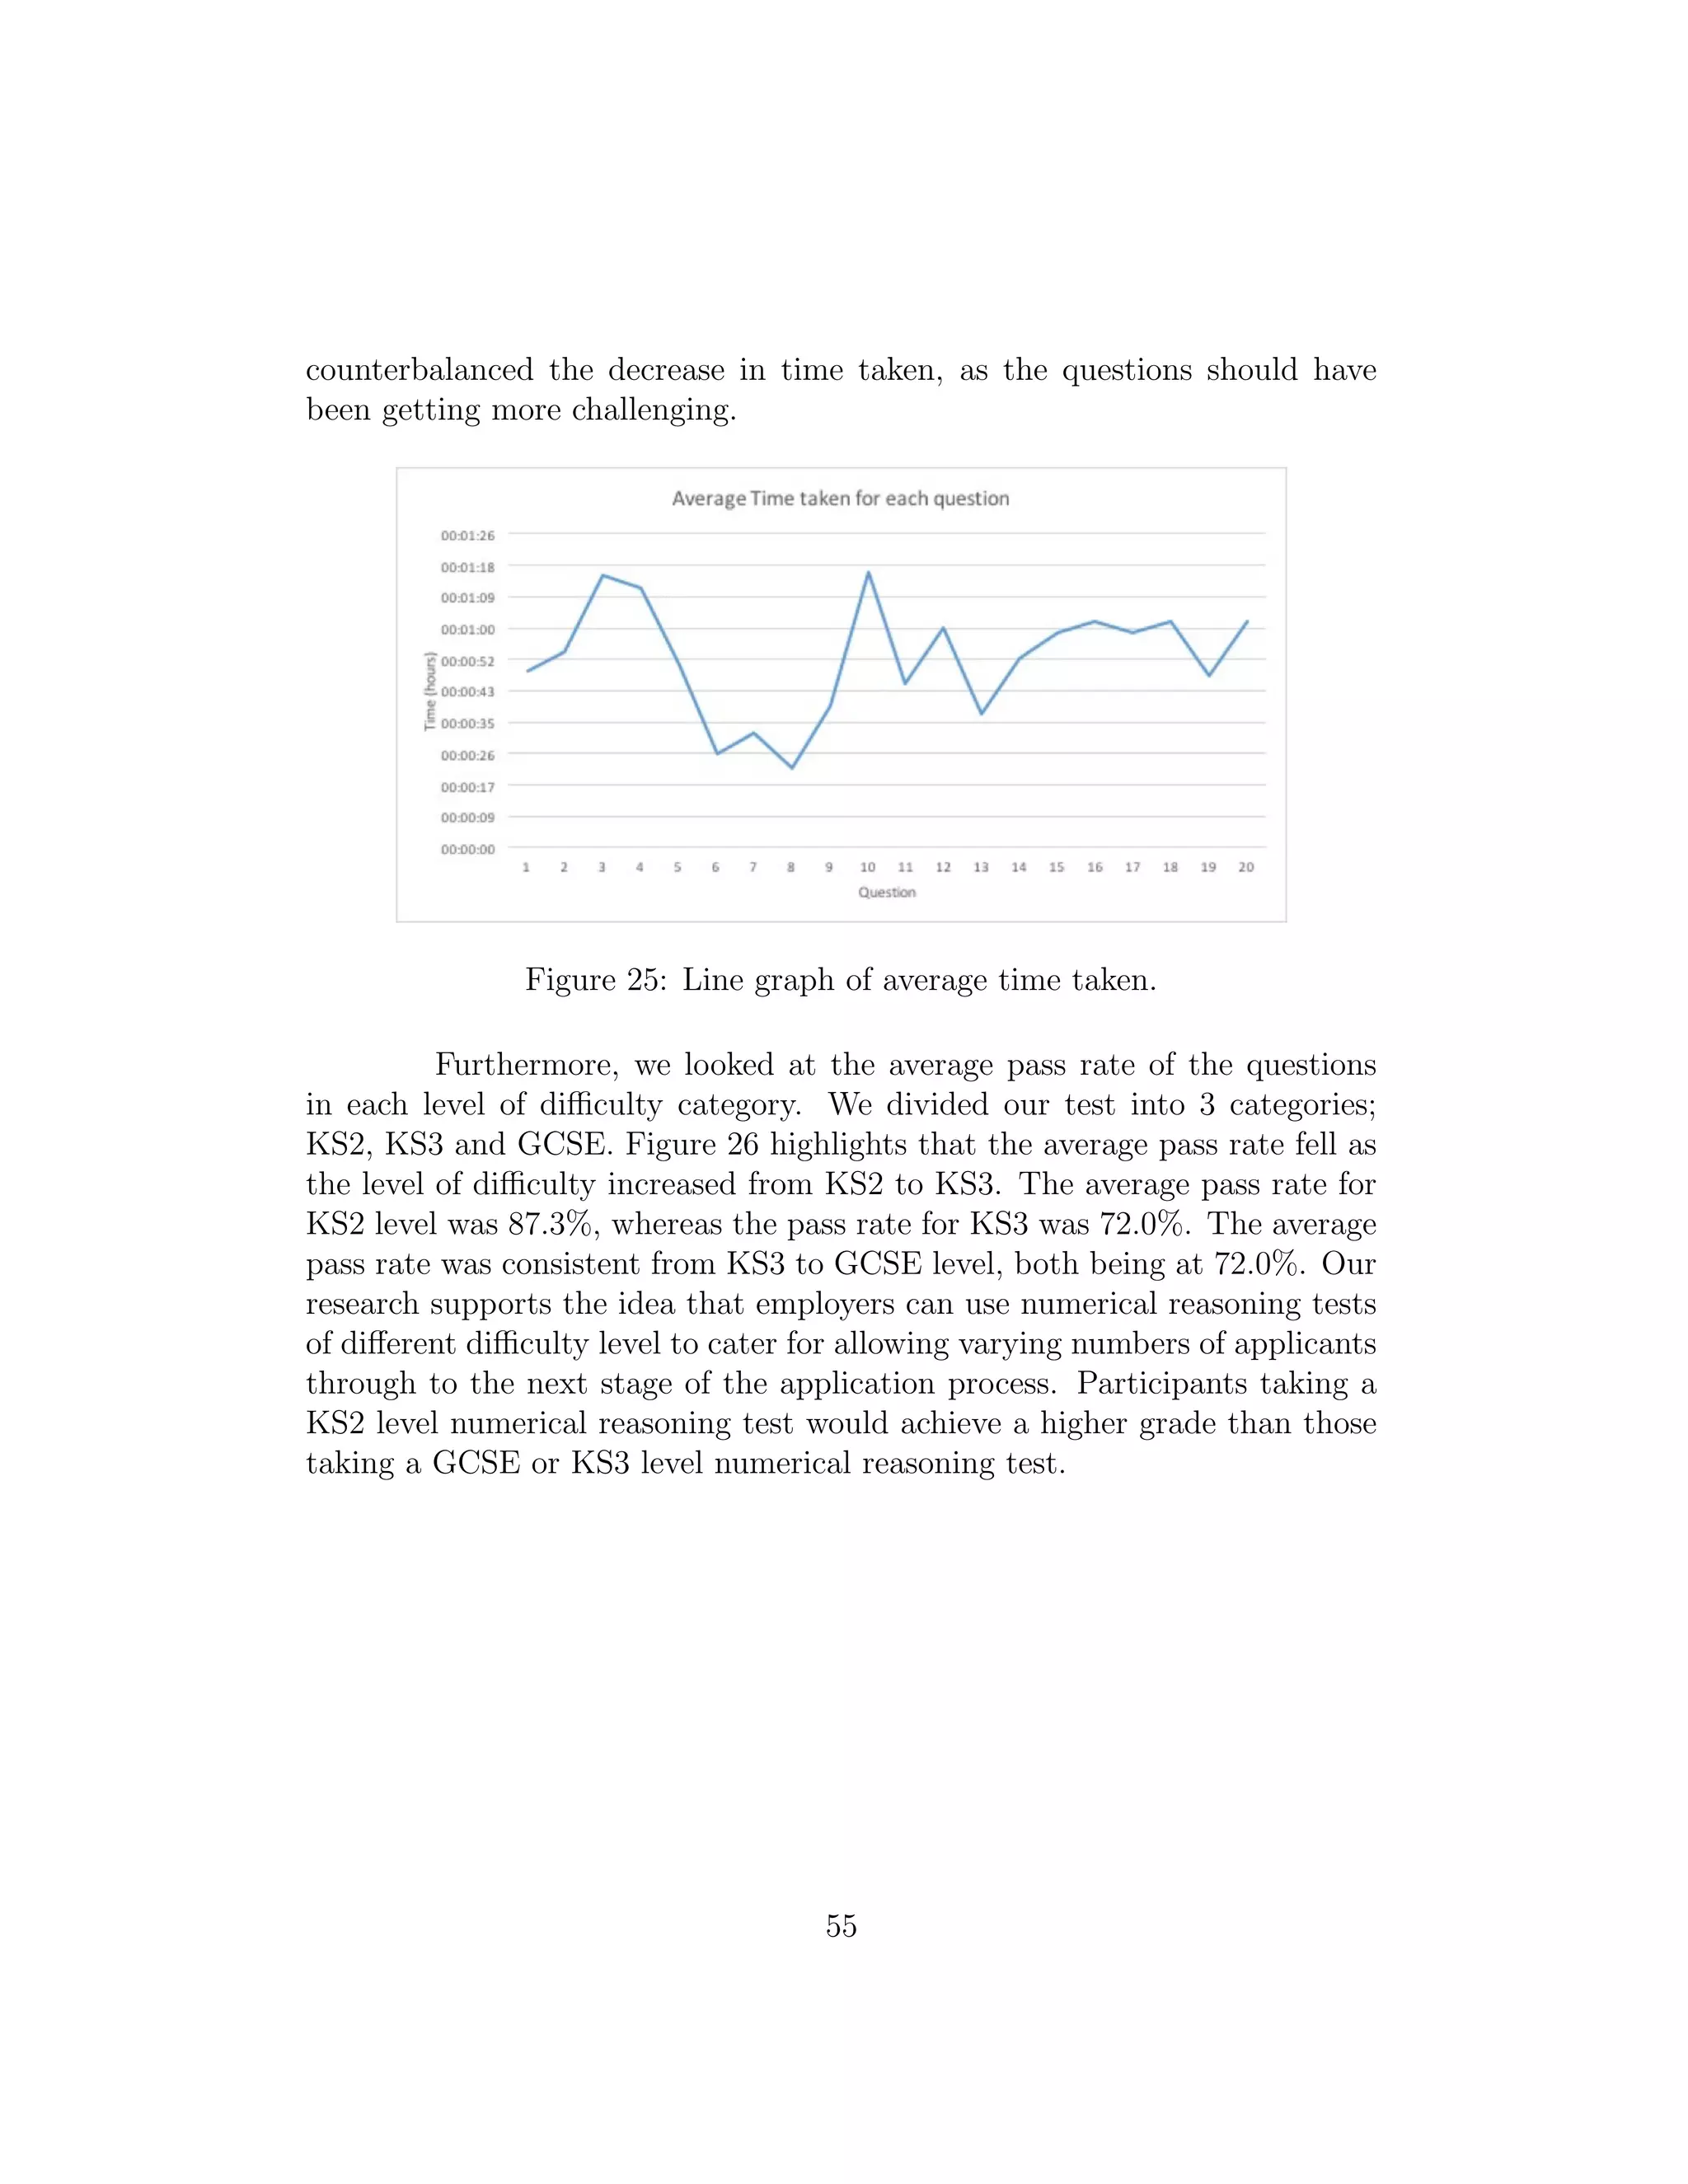
This document summarizes a group project report on the challenges and potential solutions of computer-based assessments. The group created their own numerical reasoning test to gather data and analyze how participants performed. Their objectives were to research different learning types and develop an adaptive test that provided feedback. Key findings from their test supported existing hypotheses, including that different learner types perform differently and current assessments need improved feedback. The report provides recommendations to improve online tests and better accommodate all learners.
![There is a wide spread controversial debate, not only across the aca-
demic community, but also across the world as to whether mathematics and
numeracy are essentially the same thing. It poses the question of whether nu-
meracy skills essentially rely on mathematical skills and vice versa, whether
they are in fact completely separate disciplines. We felt this is a relevant
area to explore since it there has been talk that the UK Government has
plans to change the current mathematics GCSE by removing numeracy from
mathematics and treating them as independent subjects as mentioned above.
We hope to discover whether mathematics students actually have an advan-
tage in numeracy tests, given that this is a skill that is not relevant to, nor
practiced at degree level.
We have modelled the data that we had collected from our test re-
sults, with relevant graphs, and have further analysed it using appropriate
statistical techniques. Modelling our data in appropriate mediums has en-
abled us to efficiently compare our results to those found in the literature.
Finally, we have aimed to assess how useful our findings are relative
to our broader stakeholders. We have set out to measure to what extent,
if any, we had been able to contribute to the current problem of learning
using computer-based assessments. It has been an objective of our’s to both
highlight the problems with what is currently available and possibly improve
it, by providing solutions using our findings. We have planned to approach
professionals and experts in this field with our results in order to get reliable
feedback.
1.2 Preliminary Findings
1.2.1 The ’Mathematics Vs Numeracy’ debate.
An ever greater need for both mathematical and numerical skills
is constantly emerging. However, there is a big debate amongst society as
to whether mathematics and numeracy should be considered to be the same
thing, or whether numeracy should be a subject in its own right. There are
current plans for GCSE Mathematics in the UK to split the subject into two
separate, independent GCSE’s: Mathematics and Numeracy [60].
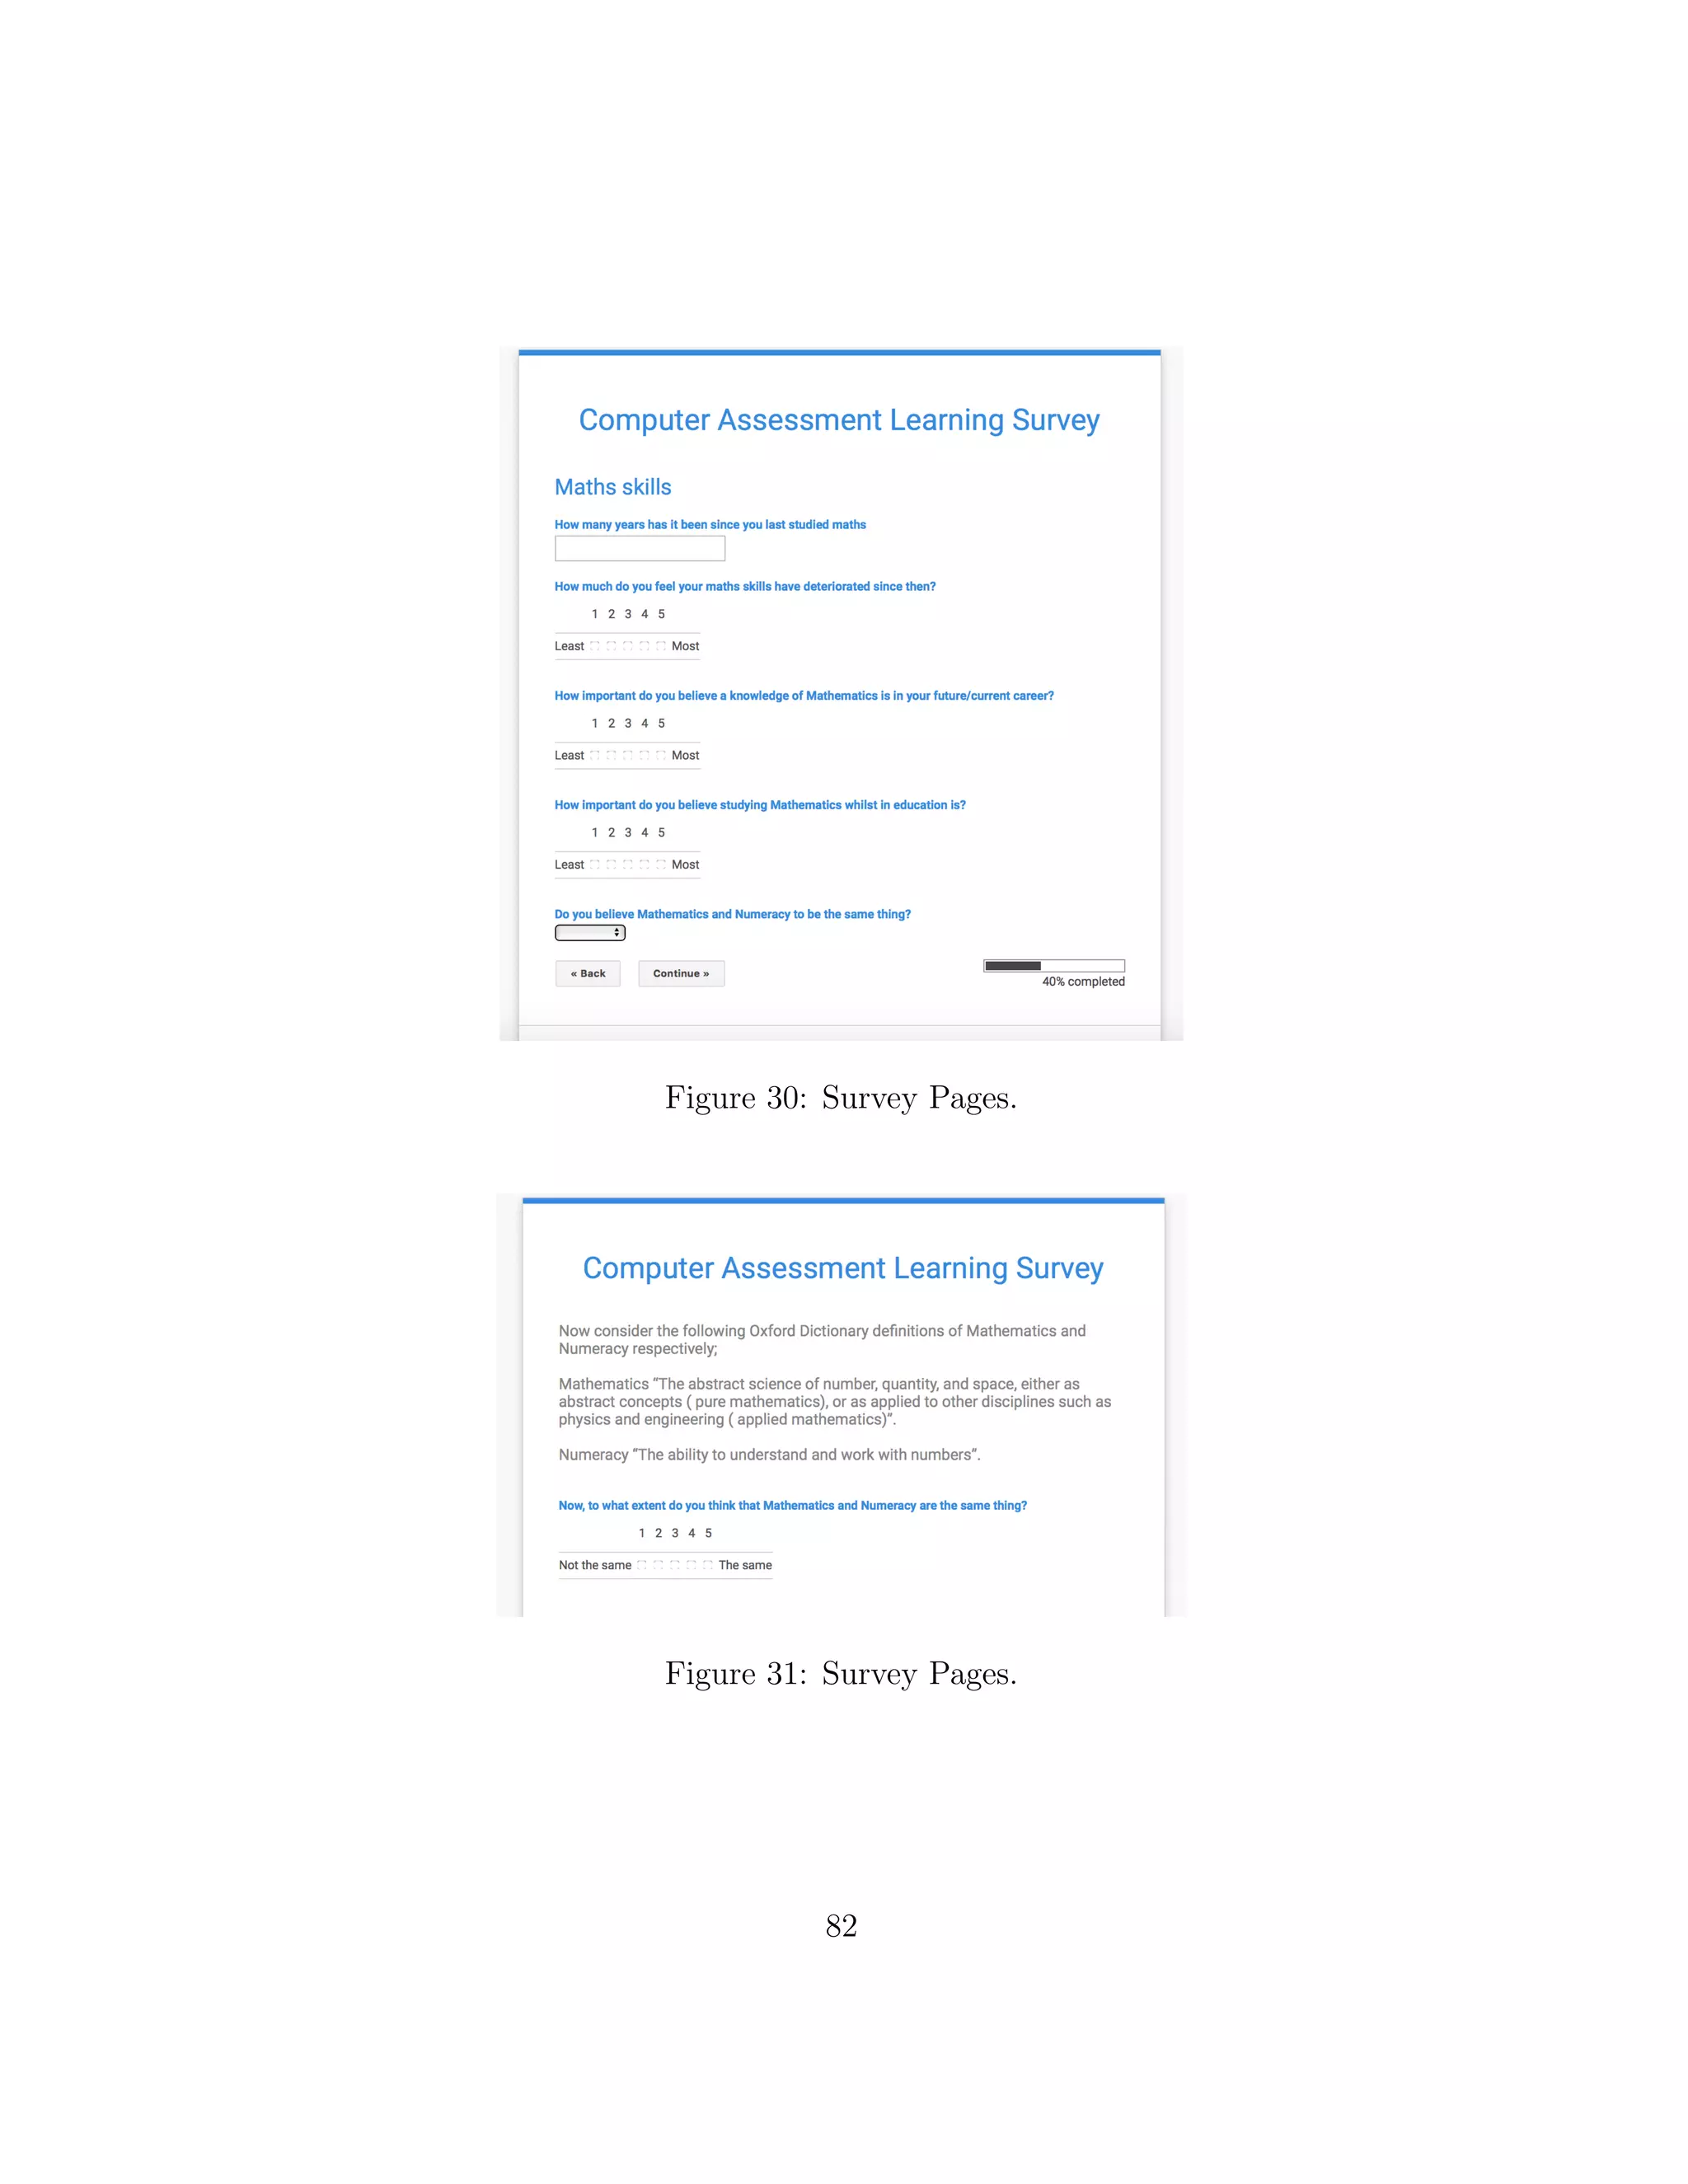
Mathematics is defined by Oxford Dictionary as “the abstract sci-
ence of number, quantity and space, either as abstract concepts (pure math-
ematics), or as applied to other disciplines such as physics and engineering
(applied mathematics)” [18]. Moreover, numeracy is defined by Oxford Dic-
5](https://image.slidesharecdn.com/c3a53d9b-627d-4299-ad78-e2ebdf324238-160113151505/75/final-8-2048.jpg)
![tionary as “the ability to understand and work with numbers” [19]. It may
be concluded from these two definitions that numeracy is a subset of mathe-
matics. However, it can also be argued that numeracy is a subject in its own
right and should be separated from mathematics as it is more applicable in
society and workplace.
Interestingly, a paper on Numeracy and Mathematics from the Uni-
versity of Limerick, Ireland, contained no universally accepted definition of
numeracy [42]. This is backed up by research from the University of Arizona
which found that the difference between numeracy and elementary mathe-
matics is analogous to the difference between quantitative literacy and math-
ematical literacy. [29] More importantly, no universal definition for numeracy
was agreed upon, although there was much overlap between current working
definitions. The most important difference between the two forms of literacy
is that quantitative literacy puts more emphasis on context, whilst mathe-
matical literacy focuses on abstraction [29].
In a paper produced by the University of Stony Brook’s Applied
Mathematics and Statistics Department, it is stated that all mathematics in-
struction should be devoted to developing “deeper mastery” of core topics,
through computation, problem-solving and logical reasoning - which is effec-
tively what a numerical reasoning test examines. Simple proportion problems
can be integrated into fraction calculations early on. In addition, the devel-
opment of arithmetic skills in working with integers, fractions and decimals,
should be matched with increasingly challenging applied problems, many in
the context of measurement. Solving problems in different ways ought to
be an important aspect of mathematical reasoning with both arithmetic and
applied problems in order to ensure a sufficient level of numerical skills for
further progression in society [56].
The Guardian Newspaper produced an article exploring a world-
wide problem associated with the difference between mathematics in edu-
cation and mathematics in the real world. The article states that all over
the world we are mostly teaching the wrong type mathematics [28]. The
Guardian then went on to describe how computers are primarily used for
calculation purposes, despite the fact that we tend to train people for this
use. This is true almost universally [28]. We are able to relate this to the
context of the ’Mathematics Vs Numeracy’ debate, since generally, the math-
ematics taught in education is too pure and distant from the real world, while
on the whole the mathematics used in the everyday life is numeracy.
Many companies require potential employees to sit a numeracy test
6](https://image.slidesharecdn.com/c3a53d9b-627d-4299-ad78-e2ebdf324238-160113151505/75/final-9-2048.jpg)
![before commencing employment, despite the fact they already hold nation-
ally recognised qualifications in mathematics. An article from an electronic
journal for leaders in education explores this. Findings show that although
the term “numeracy” is not widely used across the world, there does ex-
ist a strong consensus that all young people are required to become more
competent and confident in using the mathematics they have been taught.
Furthermore, numeracy is found to bridge the gap between school-learned
mathematics and its applications in everyday life [1]. These findings sup-
port companies in their efforts to use numerical reasoning testing as a way of
seeing whether candidates can efficiently use their formal qualifications in a
practical environment. A candidate may have achieved high results in their
school exams, but this does not necessarily mean that they will be able to use
the gained qualifications for practical problem solving which is recognised as
the main use of mathematics [28].
An insufficient level of numeracy skills has been found to lead to
unemployment, low wages and poor health furthermore highlighting the im-
portance of numeracy [43]. The need for mathematics exists in all aspects of
everyday life within the workplace and in other practical activities such as
schools, hospitals, news and understanding any statistics [14].
1.2.2 Why is mathematics important?
The study of mathematics can lead to a variety of professional ca-
reers such as research, engineering, finance, business and government services
[14]. This is supported by the University of Arizona, Department of Mathe-
matic’s who also added social sciences to the above fields [15]. It should be
noted, however, that these careers are fundamental for the world’s economy.
Therefore, it is important to ensure that people working within those fields
have sufficient skills to ensure correct and efficient problem solving and pre-
vent any detrimental consequences.
Finally, it has been suggested that poor numeracy leads to depres-
sion, low confidence and low self-esteem, leading to social, emotional and
behavioural difficulties increasing social exclusion, truancy and crime rates
[41]. With the digital age, 90% of new graduate jobs require a high level
of digital skills which are built on numeracy. Although computers are able
to reduce the need for human interaction in certain calculations, sufficient
numeracy skills are required to enable efficient use [41].
7](https://image.slidesharecdn.com/c3a53d9b-627d-4299-ad78-e2ebdf324238-160113151505/75/final-10-2048.jpg)
![1.2.3 Do people forget mathematics skills as they get older?
Research has found that a severe loss of both numeracy and lit-
eracy skills often occur in adulthood, with 20% of adults experiencing dif-
ficulties with basic skills needed to function in the modern day society [6]
[20] [38]. Simple numerical calculations, such as percentages and powers, are
found difficult despite being taught and tested to the government’s standard
throughout education.
The effect of being unemployed has been explored for both men
and women and it has been found that numeracy skills get steadily worse
the longer a person is without a job [6]. Interestingly, women experience a
lesser effect than men due to their role in society being more diverse, hence
requiring them to use their numeracy and literacy skills more frequently. It
has also been found that the loss of skill largely depends on the starting level
of knowledge and understanding, and that those who have poor skills to
begin with experience a more severe deterioration. Furthermore, numeracy
skills have a smaller presence in everyday life as more people find themselves
reading than they do performing calculations. However, a decrease in liter-
acy skills leads to an even further loss of numeracy skills as it increases the
difficulty of understanding the posed question.
Important findings have been made amongst a group of nursing stu-
dents, who were asked to sit a numeracy test containing questions similar to
those that they will have to answer as part of their future job [20]. The aver-
age score was 56% with the most common types of errors being arithmetic.
There is expected to be a significant difference in results between students
with those who took a year out before commencing higher education. Those
who started immediately score on average 70%, while those who didn’t aver-
age only 47%. This shows that being in an environment that doesn’t require
the use of numeracy skills, has a deteriorating effect, not only on the ability
to perform simple calculations but also that of being able to extract relevant
information to set up an equation. This means that even with the use of a
calculator, these students are still likely to make mistakes. Students have
also been found unable to identify errors in their work, even when the result
found is unreasonable and unrealistic. Such results are potentially danger-
ous, for example, nursing students must perform calculations such as drug
dosage, which if incorrect will cost both the public in their suffering, and the
employer in having to provide additional training.
Due to the ever increasing importance of skills in the world of work,
8](https://image.slidesharecdn.com/c3a53d9b-627d-4299-ad78-e2ebdf324238-160113151505/75/final-11-2048.jpg)
![especially early on in a career, a lack of numerical competence has an un-
desirable effect on employment of these individuals, which in turn affects
their standard of living [6] [46] [38]. Such requirements are brought about by
the recent changes to the labour market, with less semi- or unskilled manual
jobs available due to technological developments [46]. Unskilled workers have
difficulty in both gaining and retaining employment, and so are the first to
suffer in the case of downsizing or a crisis [6]. A low level skill set also limits
individuals to lower and middle range jobs (bottom 10% to 20%), preventing
them from experiencing career growth, and leading to severe social exclusion
[46] [6] [7]. This causes a downward cycle as low skill level is passed on from
parents to children, therefore, accelerating unemployment through the gen-
erations [7].
The government has recognised this problem and created a ’Skills
for Life’ programme, which aims to provide basic skills to adults in order to
help them gain employment [38]. Other solutions include on-the-job train-
ing, or, as research suggests, we can even prevent such severe skill loss by
ensuring pupils reach a certain skill level whilst still in education [6].
There are, of course, other factors which lead to a low level of nu-
meracy skills, such as family background, learning environment and quality
of education [6] [3]. However, in this report we concentrate on how the low
level of demand for numeracy in everyday life affects a student’s performance
in an online test.
1.2.4 Why do certain employers use numerical reasoning assess-
ments? What skills do they think it will show?
In addition to this, with a constantly changing and advancing busi-
ness world, the way in which people are hired may be a natural result of
shifts in the business environment and modern workforces. A number of
studies mentioned in A. Jenkin’s, 2001 paper speculated that the increase in
numerical tests is due to the greater professionalism of the human resource
sector of many businesses, as well as the inclusion of standard selection pro-
cedures in their business [33]. In the 21st century, Human Resources (HR)
has evolved massively, and is now an integral part of most organisations [58].
All these factors may have led to the rise of assessment centres, due to a con-
tinuous desire amongst companies to gain a professional edge. They do this
by searching for alternatives to traditional methods of employment, much of
which is done through HR. This greater reliance on HR as a business sector
9](https://image.slidesharecdn.com/c3a53d9b-627d-4299-ad78-e2ebdf324238-160113151505/75/final-12-2048.jpg)
![has led to the employment of much stronger recruitment methods, which (for
reasons that will follow) enable them to meet legislation requirements, and
promote a fair practice.
In many work forces, it has been clear in recent years that employ-
ability tests have been used for means other than just performance testing.
It has enabled a platform that assesses based on merit rather than personal
criteria reducing the impact of discriminatory practices [4]. Due to equal
opportunity legislation in many countries, which is most commonly related
to the differing proportions of ethnic groups hired, many employers could be
vulnerable to prosecution [58]. These types of random psychometric tests
can therefore be used as a way to reduce bias and discrimination [33]. One
factor in explaining the increase in the use of these tests may therefore be as
a prudential response to changes in hiring attitudes and legislature. On the
other hand, the opposite has also been said - that companies need to keep
legal compliance in mind when they use psychometric tests [12] so as not to
offend candidates by using irrelevant tests. In addition, when using these
tests, the role of bias has been explored as many psychologists and compa-
nies note that testing is an intrinsically culturally biased procedure that can
cause discrimination against ethnic minorities. This is as a result of cultural
differences leading to consistently different answers across several different
social groups. Although it can be noted that this applies more specifically to
judgement and situational tests, and not to numerical and verbal listening
tests that we are planning to test our research on [30].
The rise of these tests could also be attributed to the workplace’s
lower regards for formal qualifications as a method of streaming candidates
and predicting their future abilities [33]. This may be because young labour
force entrants across the EU have much higher attainments than they previ-
ously did, and hence it is harder to sort applicants out at the top end of the
spectrum based on attainment than in the past. This may lead employers to
screen applicants much more carefully [33]. Potentially this was caused by
the previous decade of education being hailed as ’too easy’ [27], which caused
achievements to be very high. Periods like this can have knock on effects on
recruitment methods, as a reaction to these ’more qualified’ applicants fil-
tering through the recruitment system and into the business environment.
However, this may be subject to change given that recent education reforms
claiming to ’toughen’ up the curriculum, have yet to see their full effect -
particularly in terms of employment. Examples of a lack of belief in the edu-
cation system can be seen by the movements of top employers. An example of
10](https://image.slidesharecdn.com/c3a53d9b-627d-4299-ad78-e2ebdf324238-160113151505/75/final-13-2048.jpg)
![this would be one of the ’big four’ professional services firms, Ernst & Young
[26], who have recently changed their application rules so that educational
attainments, such as degree class, are no longer taken into account. Instead
they believe that their own in-house testing and assessment centres are a
reliable enough indicator of whether candidates will succeed [26]. Another
example of this was with the introduction of the Army’s own mathematics
test for applicants. The reason for its development was the increasingly chal-
lenging task of using GCSE mathematics results as a discriminator amongst
applicants for technician roles [33]. If formal qualifications continue to be an
insufficient indicator of applicant’s abilities, then companies will have to find
new methods to screen them, as is happening already with the increase in
psychometric testing.
When beginning our research, we went down many different routes
to get a broad range of information. Through emails and other means of
correspondence, we identified a few problems that employers encounter with
these psychometric tests. Firstly, they are not always sat in test centres, and
many are done online. This always leaves the possibility that people may
try to cheat on these tests and get other people to sit them on their behalf
[4]. This is unfair on other candidates, as well as misrepresentative, causing
people who may not be suited for a role to progress further in applications
than they otherwise would. Having said this, most of these tests have been
designed in such a way that they are fairly difficult to cheat on - for instance
having time restraints [53]. We have also found that these tests are mostly
used as a means of filtering candidates, so passing them doesn’t necessar-
ily guarantee any further success. Secondly, some companies have said that
tests may potentially be unrepresentative since people only get one chance to
take them[53]. Due to many different circumstances, an employee may well
underperform on the test, and so not demonstrate their full potential. This
could cause companies to miss out on hiring perfectly well-suited candidates,
in which case the tests would be causing a misallocation of their resources.
Some companies have a validation test in place that allows people who got
unexpected results to retake the test. However, obviously not all companies
will guard against inconsistencies in this way [53]. On the contrary, many
recruiters we spoke to stated that these tests and their scores are used only
to assist in the recruitment process, and are not the sole factor for employ-
ing people [51]. Instead they are used as a guidance to help make informed
decisions on applicants, so a well rounded application is essential in addition
to these tests [4].
11](https://image.slidesharecdn.com/c3a53d9b-627d-4299-ad78-e2ebdf324238-160113151505/75/final-14-2048.jpg)
![“Numerical reasoning is the ability to understand, interpret and
logically evaluate numerical information. Numerical reasoning is a major
facet of general cognitive ability, the strongest overall predictor of job per-
formance” [44].
Due to the numerical reasoning skills you exhibit when you take a
numerical reasoning assessment, they are seen to be the ’best overall predic-
tor of job performance’ [44]. Both numerical and verbal reasoning tests are
combined to be an overall aptitude assessment that highlights the most well
rounded, suited people for the job. Aptitude tests show employers skills that
cannot be replicated in interviews, nor be observed by reading CVs and look-
ing at past references. They are a true, accurate and quick assessment of how
candidates perform on the spot in a pressured environment. The ’govern-
ment mathematical report’ [25] alongside Careers’ websites, such as Assess-
ment Day Ltd [37] and Inside Careers [31], agree that the only mathemati-
cal abilities being tested on numerical assessments are addition/subtraction,
multiplication, percentages, currency conversions, fractions and ratios. In
addition, they are testing the ability to “interpret the tables and graphs
correctly in order to find the right numbers to work with” [31]. Numerical
reasoning tests are normally timed, in order to measure applicants’ ability to
think on their feet and problem solve under time pressure.
Prospects [45], a website designed to help people looking for jobs,
stated that employers in most industries are looking for applicants with plan-
ning and research skills, i.e. those applicants with the ability to find relevant
information from a variety of different sources. Information can be presented
in a variety of ways, such as with numbers, statistics or text in tables, graphs
and reports. Employees need to be able to understand, analyse and interpret
research and appropriately use it. Numerical assessments are testing these
exact skills.
In addition, tests can have varied levels of difficulty, to represent
the levels of numerical skill that will be needed for the specific job. SHL
Talent Measurement Assessments create a wide range of tests, ranging from
aptitude and personality tests, to customised tests for individual companies
[8]. They create a variety of tests appropriate for different job levels and
industries. Numerical reasoning tests can be adapted to have more complex
questions, requiring a more advanced level of numerical knowledge and skill.
Another way of making them more challenging is to shorten the time avail-
able to complete the test. SHL have quoted that their tests represent the
’level of work and academic experience’ [8] required for a specific job role.
12](https://image.slidesharecdn.com/c3a53d9b-627d-4299-ad78-e2ebdf324238-160113151505/75/final-15-2048.jpg)
![For example, SHL released an ’Aptitude: Identify the Best Talent Faster and
at Less Cost’ brochure [9] stating that a Semi-Skilled staff job will require
a VERIFY Calculation Test, where as a Director or Senior managerial job
will need to be tested using the VERIFY Numerical Test, which is far more
advanced.
Furthermore, as numerical reasoning is just one aspect of an apti-
tude assessment it means applicants applying for highly numerical jobs may
also get asked to take a verbal reasoning test. In all jobs, an ability to com-
municate with colleagues is essential. This reiterates the fact that aptitude
tests are used to find the overall highest-calibre applicant.
A job application process is not a simple task. For many job appli-
cations candidates must spend hours researching the company, before writing
the application form and preparing for interview. Practising the skills ex-
amined in numerical tests is just another aspect of a job application that
requires preparation. Does an applicant’s mark improve with practice? If so,
then applicants can practise in order to achieve high results, no matter what
degree they study or how long it’s been since they last studied mathemat-
ics. For example, even an applicant that stopped studying mathematics at
GCSE level can use the numerous online resources available to practice and
prepare for numerical tests, and hence could easily ’revise’ for such a test
and potentially perform very well.
The overall consensus from our sources, is that numerical tests used
by large companies (especially those with large numbers applicants), are gen-
erally a candidate streaming process. With UK education standards rising
and a larger number of students receiving higher education (In January 2015,
592,000 people had applied to University, up 2% from the year before) [11],
more people are eligible to apply for graduate scheme jobs. High Fliers Re-
search presented their findings in a report, ’The Graduate Market in 2014’
the Telegraph [49] and stated that graduate schemes now receive approxi-
mately 39 applications to every available job. With the number of students
applying to such schemes high and rising, it is extremely hard to differenti-
ate between candidates who have all achieved high grades and well regarded
university degrees. How do you select the ’best’ candidate from thousands
of similar applications? Due to this difficulty, companies use these to reduce
the number of applicants they consider in the next application step. Accord-
ing to Personnel Today [47], 80% of companies use standard off-the-counter
numerical tests provided by companies such as SHL. Only 18% use a test
which they have tailored to measure unique, customised skills that they are
13](https://image.slidesharecdn.com/c3a53d9b-627d-4299-ad78-e2ebdf324238-160113151505/75/final-16-2048.jpg)
![looking for. Some would argue that since off the counter tests aren’t unique
to a company, then such a numerical test will not truly assess competency
for a specific job role.
1.2.5 How do people learn through computer-based assessment?
What works and what does not?
Another topic we explored was how people learn through computer-
based assessment. There are many methods that aid learning on a com-
puter. The most popular and commonly used forms of these are multiple
choice or true/false questions, labelling images, rank ordering and gap fill-
ing. Computer-based assessment can be very popular with both students and
teachers. They increase student confidence and are liked by students due to
the fact that they get rapid, if not immediate results. They can even be com-
pleted in a student’s own time when they are ready to do so. A teacher is
also likely to use these methods as a way of administering frequent formative
or summative assessments, since less time is spent marking. Then not only
can they spend more time adapting their teaching methods (depending on
the results of these assessments), but they can do so reasonably soon after
the test is taken [39].
Feedback is crucial to the learning process and, as mentioned, one
of the advantages of immediate feedback is that the student receives their
result straight away, rather than after they’ve moved on from a particular
topic. A study conducted at the University of Plymouth [36] compared two
groups of students; one using several online materials with two levels of feed-
back and another using none of them, to see how they performed in an end
of module summative assessment. The group using the available study ma-
terials performed significantly better than the other group.
Although computer-based assessments can greatly benefit a stu-
dent’s learning, there are concerns that online tasks, especially multiple-
choice questions don’t encourage deep thinking about a topic, and so don’t
aid learning [34]. In order to be as beneficial as possible, these assessments
need to both engage and motivate students.
14](https://image.slidesharecdn.com/c3a53d9b-627d-4299-ad78-e2ebdf324238-160113151505/75/final-17-2048.jpg)
![1.2.6 Will different types of learners (kinaesthetic, visual etc.)
have different levels of numeracy?
Our final area of research was different learner types, and whether
some of them would be better at numeracy than others. According to ESL
kid stuff, there are many different types of learners, such as Tactile, Global
and Analytic. However most people fall into at least one of the following
three categories: Kinaesthetic, Visual and Auditory [52]. Katie Lepi [35]
describes these types of learners in her article, “The 7 Styles of Learning:
Which Works For You?”. She describes kinaesthetic (or physical) learners
as people who prefer using their bodies, hands and sense of touch. Writing
and drawing diagrams are physical activities, so this sort of activity really
helps them learn. Role-play is another commonly used activity for these
types of learners. They often have a ’hands-on’ approach, so learn best from
partaking in physical activities. On the other hand, visual learners do better
by looking at graphs, watching someone do a demonstration or simply by
reading. Finally, auditory learners are the kind of people who would rather
listen to something being explained to them than read about it themselves.
A common way for them to study is to recite information aloud, or to listen
to recordings. They also usually like to listen to music while they study [57].
There are many different types of learner styles, and even though
most people use a combination of all three techniques, they usually have an
idea of how they learn best. If you know what type of learner you are from
a young age, then it puts you at an advantage. However, it is also important
to adapt your learning techniques whilst you are young so that you are able
to use each learning technique effectively [48]. Our aim is to see if there is
a correlation between numerical ability (based on our test results) and type
of learner. We understand that online computer-based assessments mainly
cater for visual types of learner, and so we do not aim to change the online
test in order to reflect this, but instead hope to test this theory as part of
our analysis.
15](https://image.slidesharecdn.com/c3a53d9b-627d-4299-ad78-e2ebdf324238-160113151505/75/final-18-2048.jpg)

![Figure 1: An example of us using Doodle to decide on suitable times for our
group meetings.
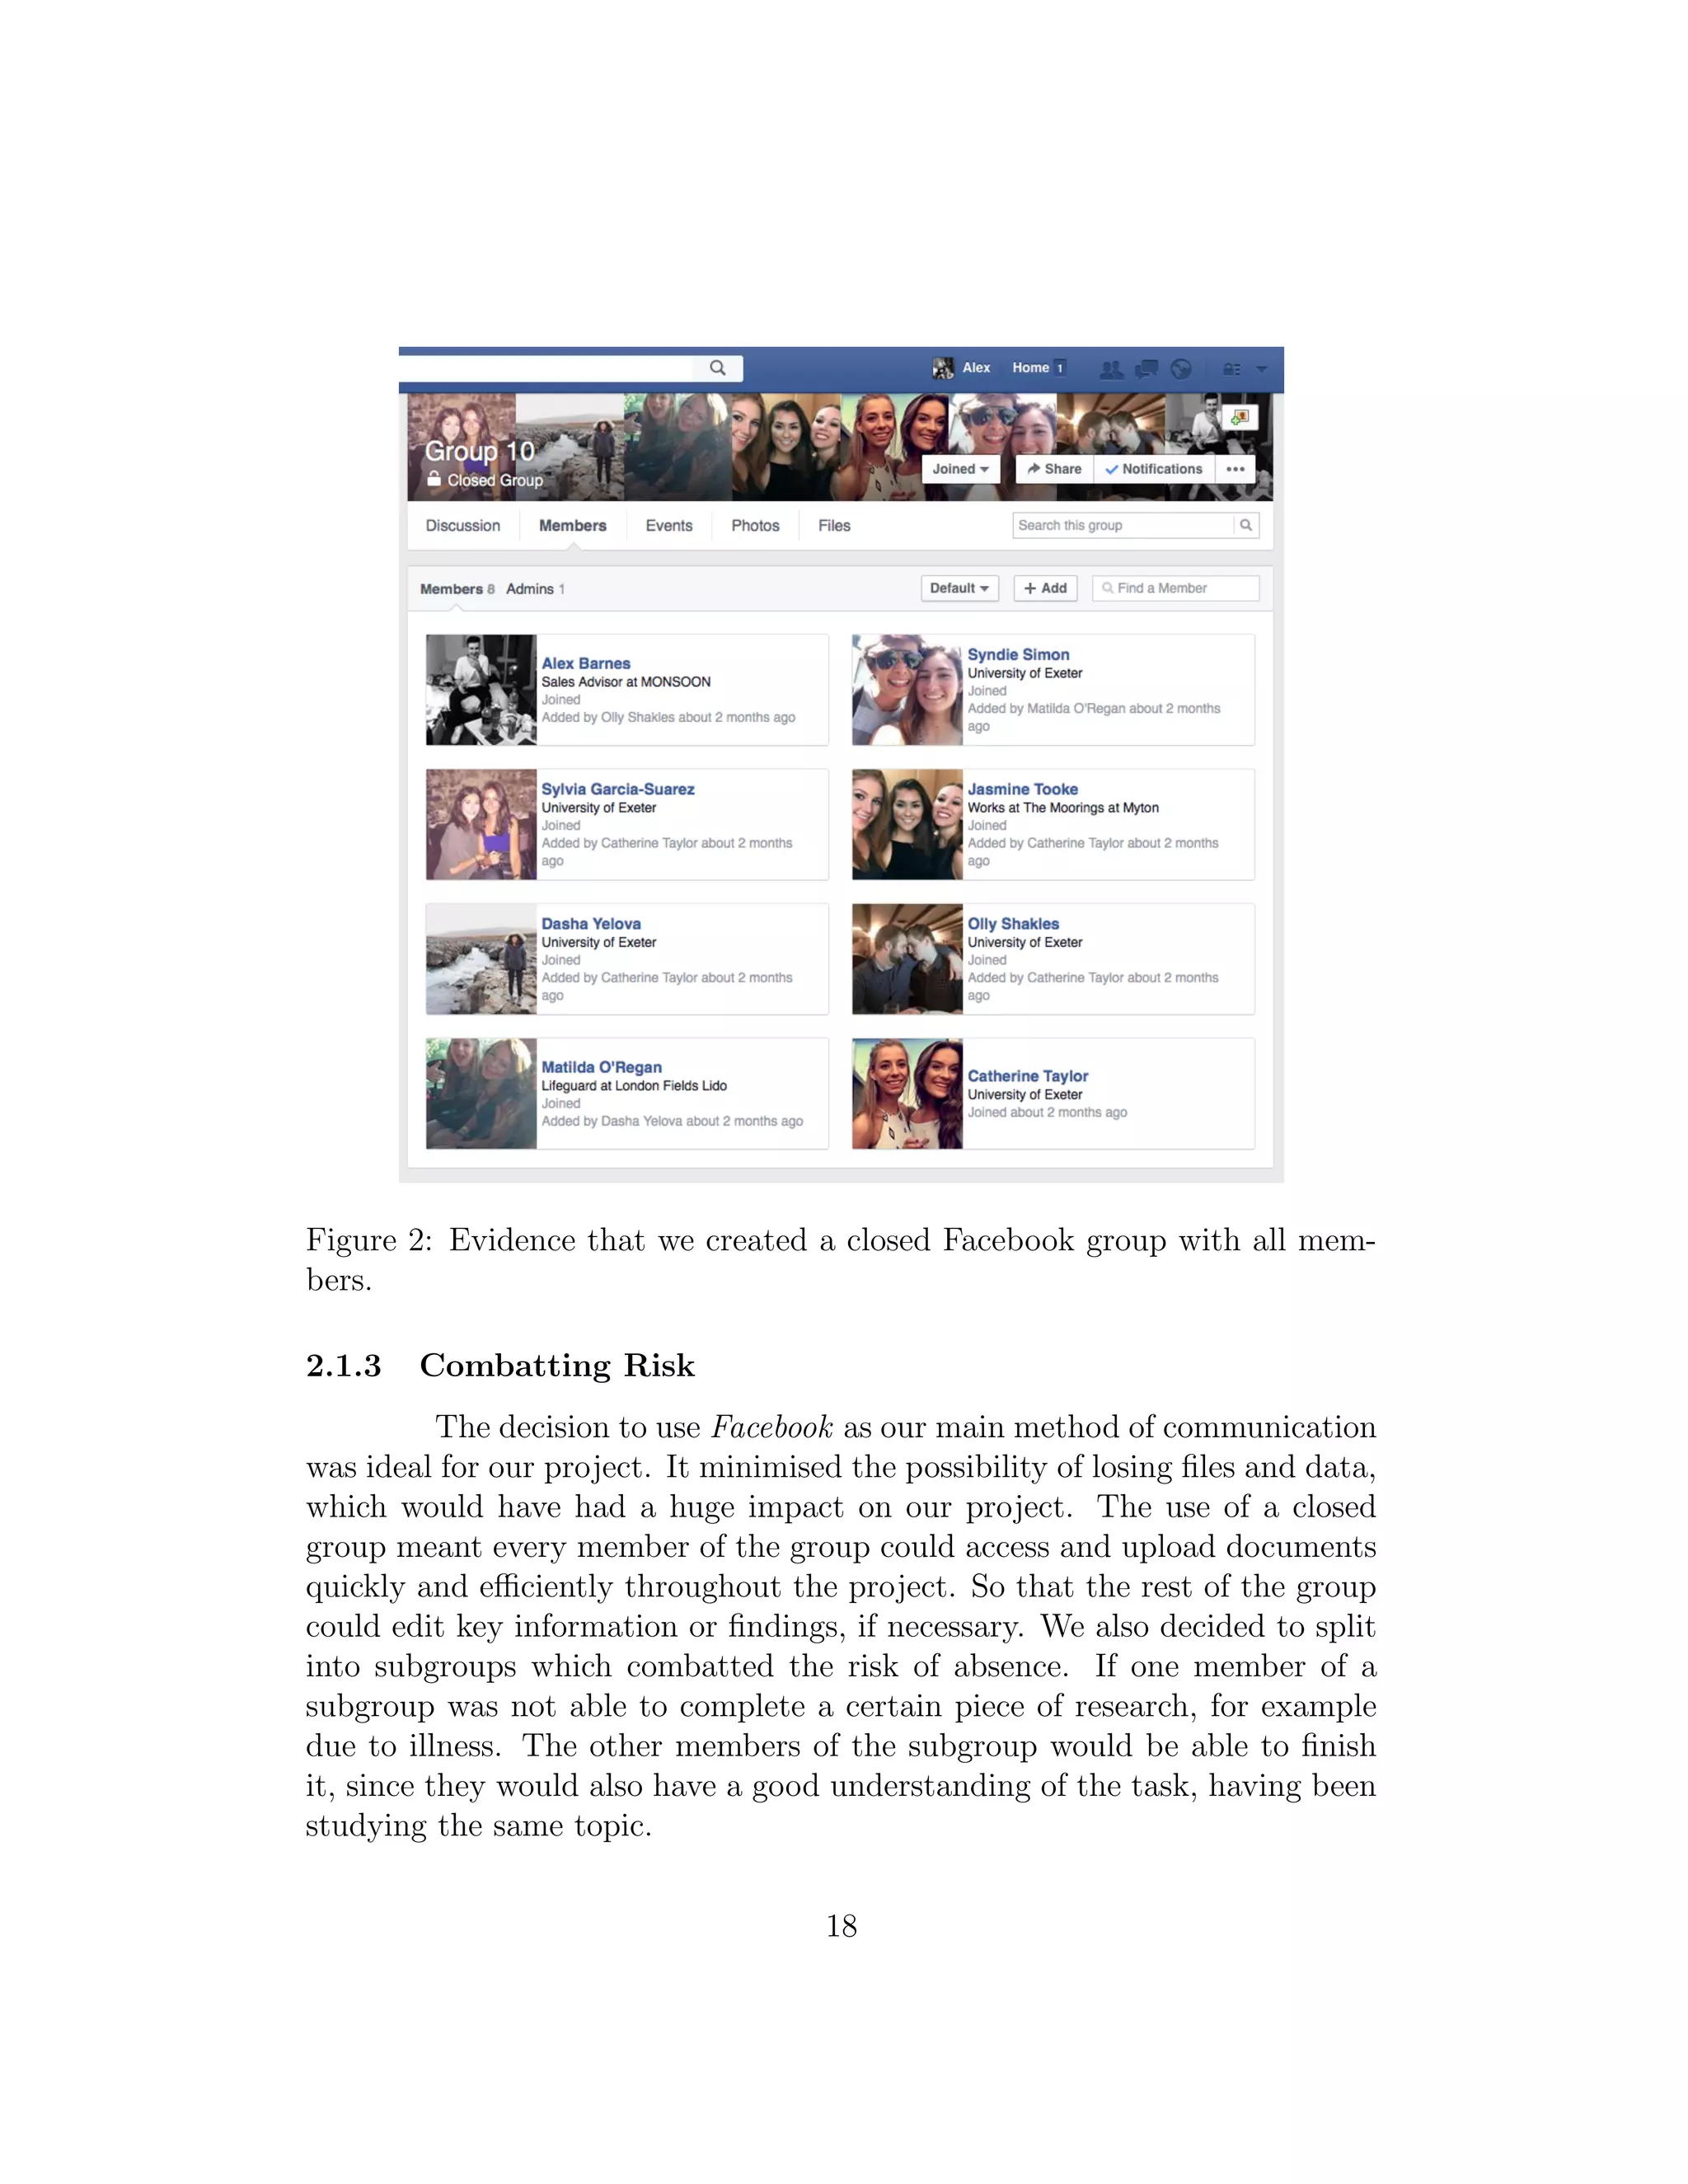
2.1.2 Communication
One in seven people now use Facebook to connect to their family
and friends [32]. It is the most popular form of social media. As a result,
we decided the best form of communication between group members, would
be through Facebook. We created a closed group (see Figure 2) so that we
could share files containing any work we had completed. We also exchanged
numbers and created a ’Group Chat’ on Whatsapp, an instant messaging
application. The team looked into using Google Documents to keep and edit
our work. We found we were limited by this as the site required a Google ac-
count which not all group members had. It also was more difficult to facilitate
comments and project related discussions. In contrast, our Facebook group
allowed all these things and it was quickly decided that this site would be our
main form of communication, as no other platform worked more efficiently.
17](https://image.slidesharecdn.com/c3a53d9b-627d-4299-ad78-e2ebdf324238-160113151505/75/final-20-2048.jpg)


![The next stage was to decide what topics to base our questions on.
We wanted to focus on the numerical reasoning style of questions just like
on the currently available employability tests. We did this by researching
these numerical reasoning tests and replicating their style of questions. This
ensured our test was relevant and had the potential of preparing people for
such testing.
Some initial points raised focused on the types of questions we would
have to ask, what topics we would focus on, and how many levels of difficulty
we should have. It was also noted that our questions would have to be both
realistic to program and relevant to research, in order for the results to pro-
vide us with useful information that the statistics group would then be able
to analyse. Each member of the subgroup was then tasked with a different
research assignment. One member focused on how to effectively test different
learner types, while the other two members focused on looking up example
questions at different levels of difficulty. Having done this, it emerged that
online tests naturally cater more for visual learners and not for the other two
learner types [10] [40] [50]. We took the decision not to focus on this aspect
when writing our questions, as we would not be able to created different
types of questions for a specific learning style, other than visual.
Having established that a variety of levels was essential to fulfil our
aim of creating an adaptive test, it remained to decide which difficulties we
would pick. Since we knew that all participants would have a minimum of
GCSE-level mathematics or an equivalent qualification, but not necessarily
any further qualifications, we decided to make this our top level of difficulty.
However, after their preliminary discussion with statistician - Dr Ben Young-
man, the statistics subgroup informed us that having any more than three
levels of difficulty in our test would significantly hinder statistical analysis
of data later on in the study. This is due to the fact we would be unable to
create an effective model. On the other hand, we were concerned that this
would reduce the range of results, as if we had six similar questions at the
same level, and it was likely that if a participant could answer one question
correctly, then they could complete them all. For this reason, we decided to
incorporate both KS2, KS3 and GCSE level mathematics. The final element
of the decision making process involved reading through the current curricu-
lum for KS2, KS3, as well as GCSE-level Mathematics.
The final element of the decision process involved reading through
the curriculum for Key Stages 2 and 3, as well as GCSE-level mathematics,
in order to single out the recurring, most important topics so that we could
24](https://image.slidesharecdn.com/c3a53d9b-627d-4299-ad78-e2ebdf324238-160113151505/75/final-27-2048.jpg)
![base our test questions around them[22] [24] [23]. The final decision we made
was to write two questions for each of ’percentages’, ’ratios’ and ’algebra’ at
Key stages 2 and 3, and then to write six statistics GCSE questions, which
would incorporate these topics. In this way, we would have 3 multiple choice,
and 3 gap-fill questions at each level of difficulty.?
Once we?d made all the relevant choices, it was time to write the
questions. We found examples of questions on the topics we were focusing
on, by looking at teaching resources websites, such as TES [2] [54]. We
then adapted these to suit our own needs ? not only did we want to model
questions to resemble currently available online assessments, we also had to
generate wrong answers for every question that was to be multiple choice.
This was the hardest element of the process, as it involved deliberately mak-
ing common mistakes with the aim of generating possible wrong answers.
Luckily, this was achievable, and due to diligently writing down our thought
processes, we were able to relate how we?d created these wrong answers to
the programming team, so that they had an algorithm to use in the randomi-
sation of questions later in the process.
2.3.2 Programming the Test
In this section, we discuss the writing of our online test.
Our test acted as a vehicle to provide relevant data in order to help
answer the theories we had posed from our research. This meant it was an
integral part of our project outcome and was therefore very important to us.
We began meetings regarding the creation of the test very early on as we
were aware that it would be a very time consuming part of our project. In
these, we discussed how we were going to approach the programming aspect.
Firstly, we had to choose the programming languages that we would
use. We looked into a few different methods. Our first idea involved using the
Exeter Learning Environment so that all Exeter students would be able to
easily access the test. We thought this would help with distribution, as this
website is used by all students at the university, however, the programming
behind the website was far too restricting in terms of what we had planned
with regards to coding. It also presented the problem that our results would
be restricted to one university. Another language we could have used was
a version of Maple that would both code and present our questions. It
became apparent that it wouldn’t facilitate certain aspects of our test, such
as feedback and randomisation. After exploring these different options with
25](https://image.slidesharecdn.com/c3a53d9b-627d-4299-ad78-e2ebdf324238-160113151505/75/final-28-2048.jpg)


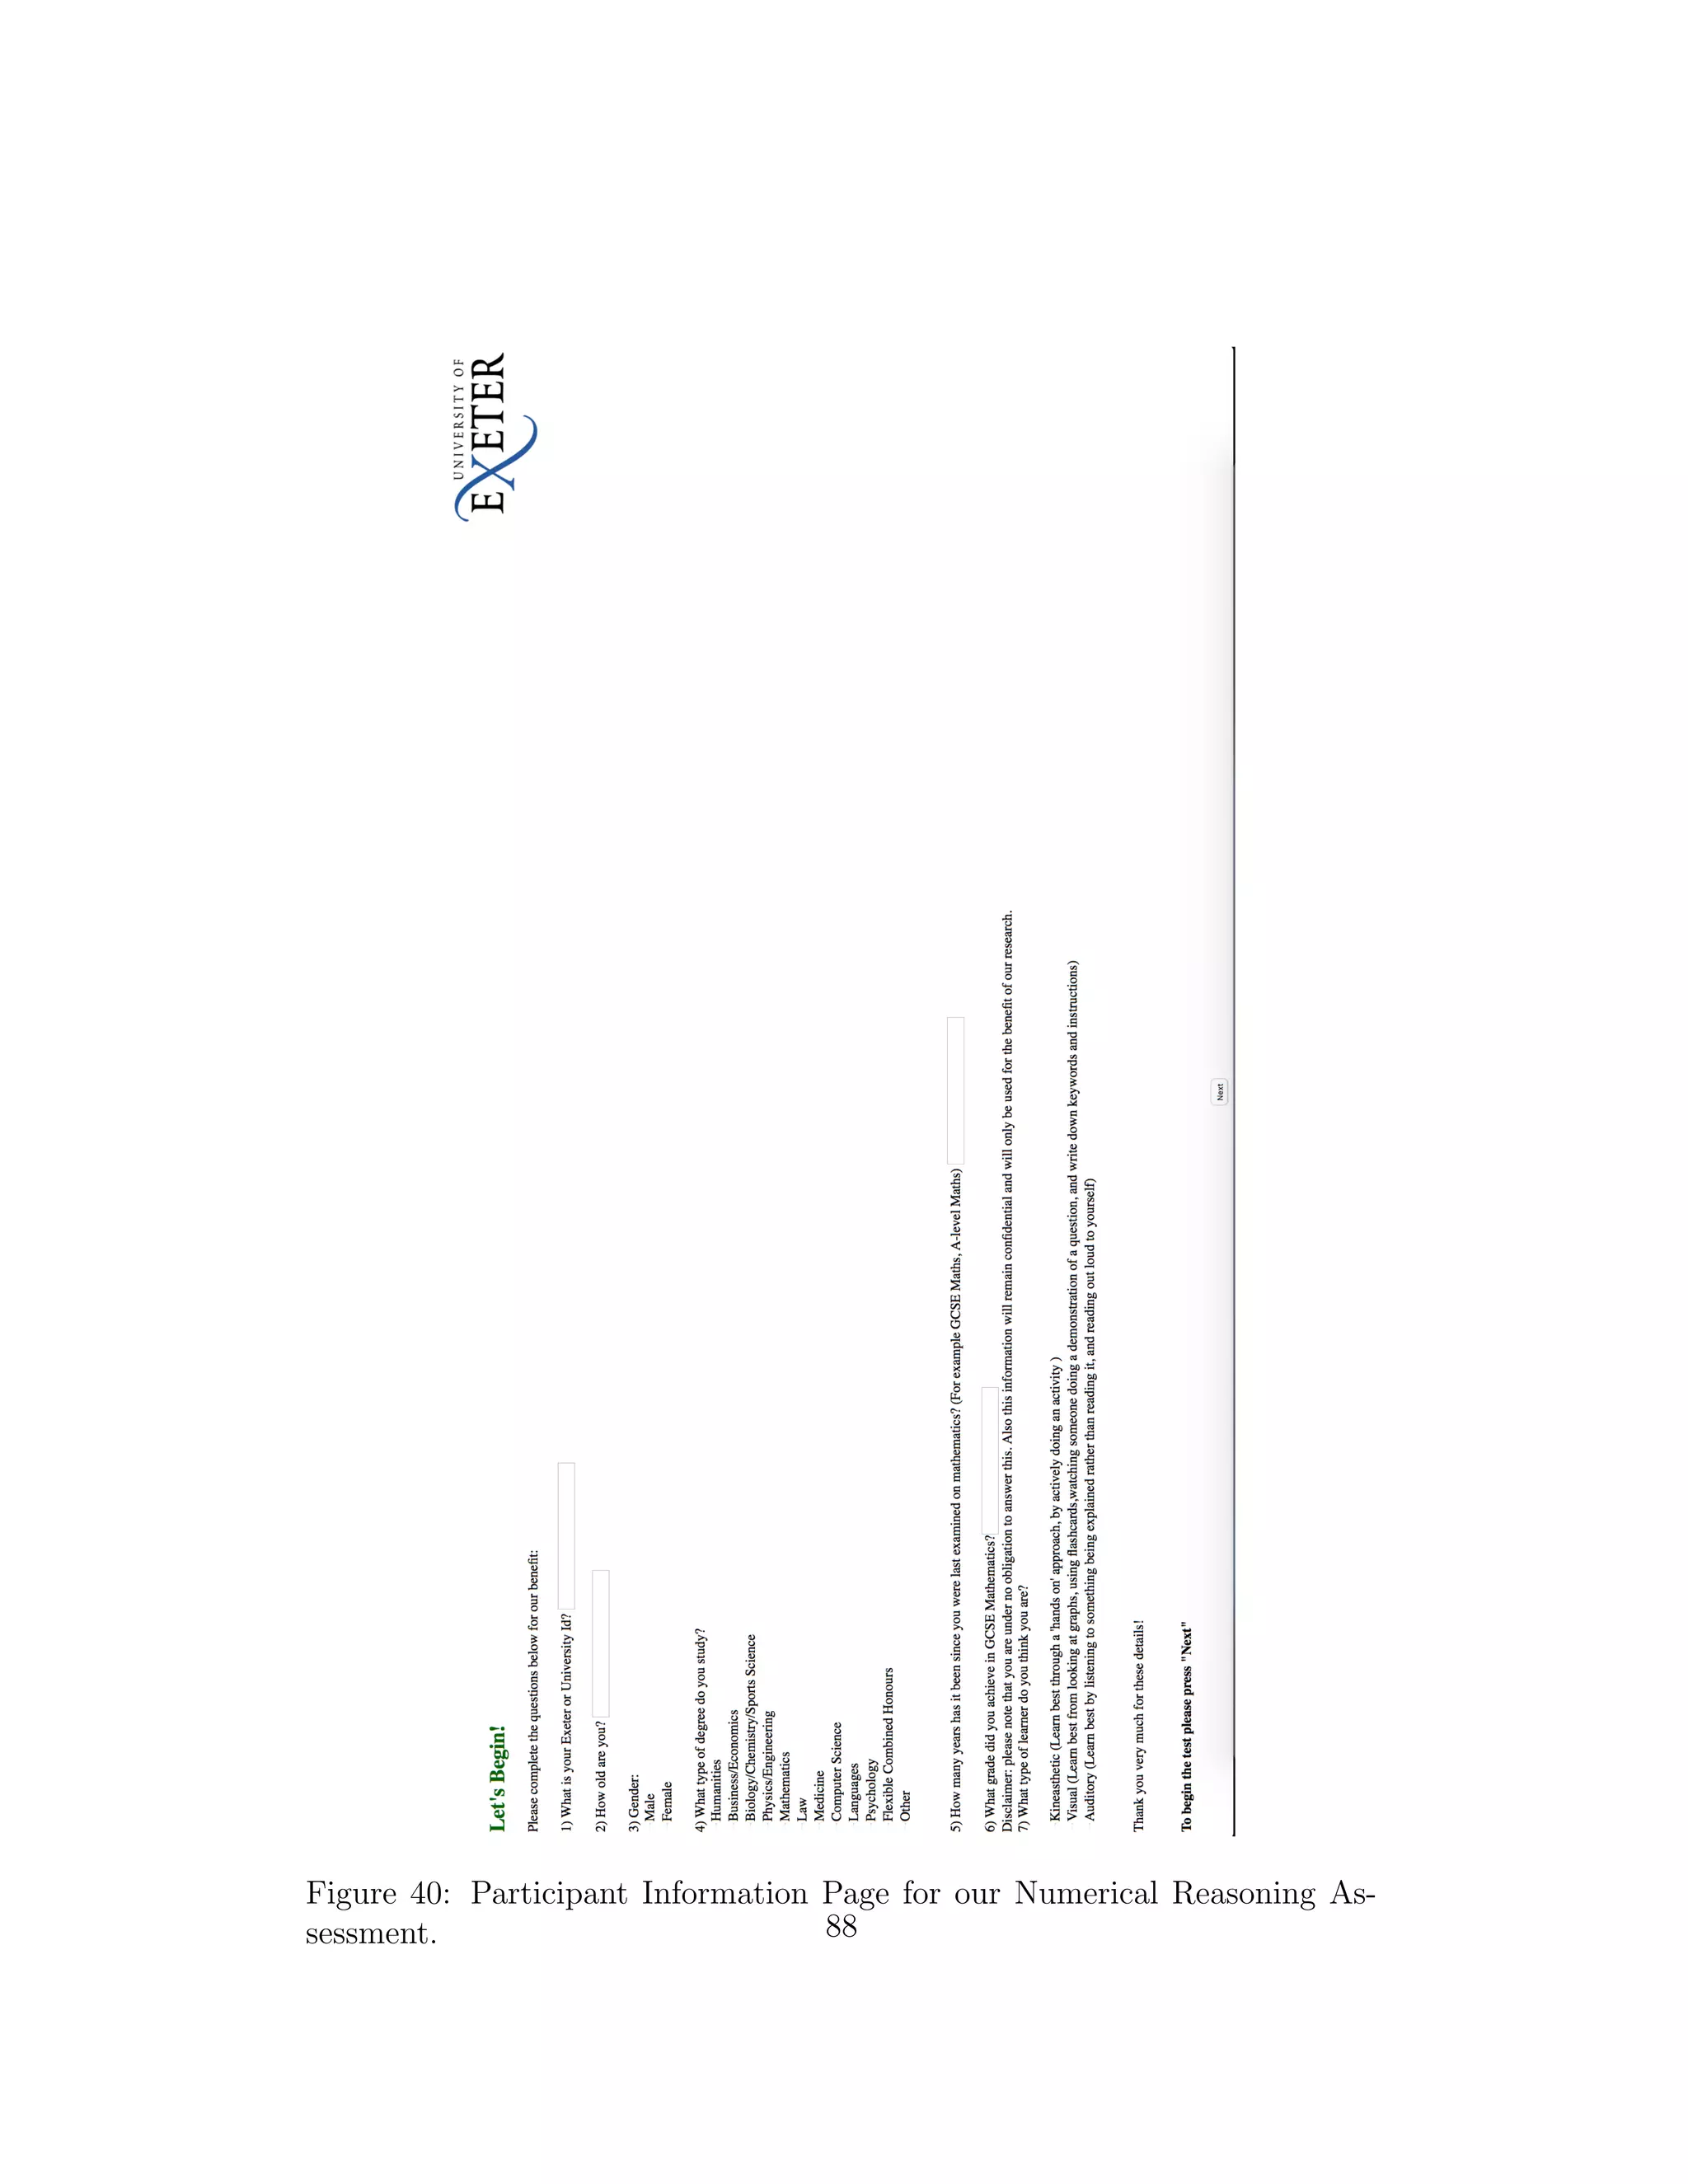
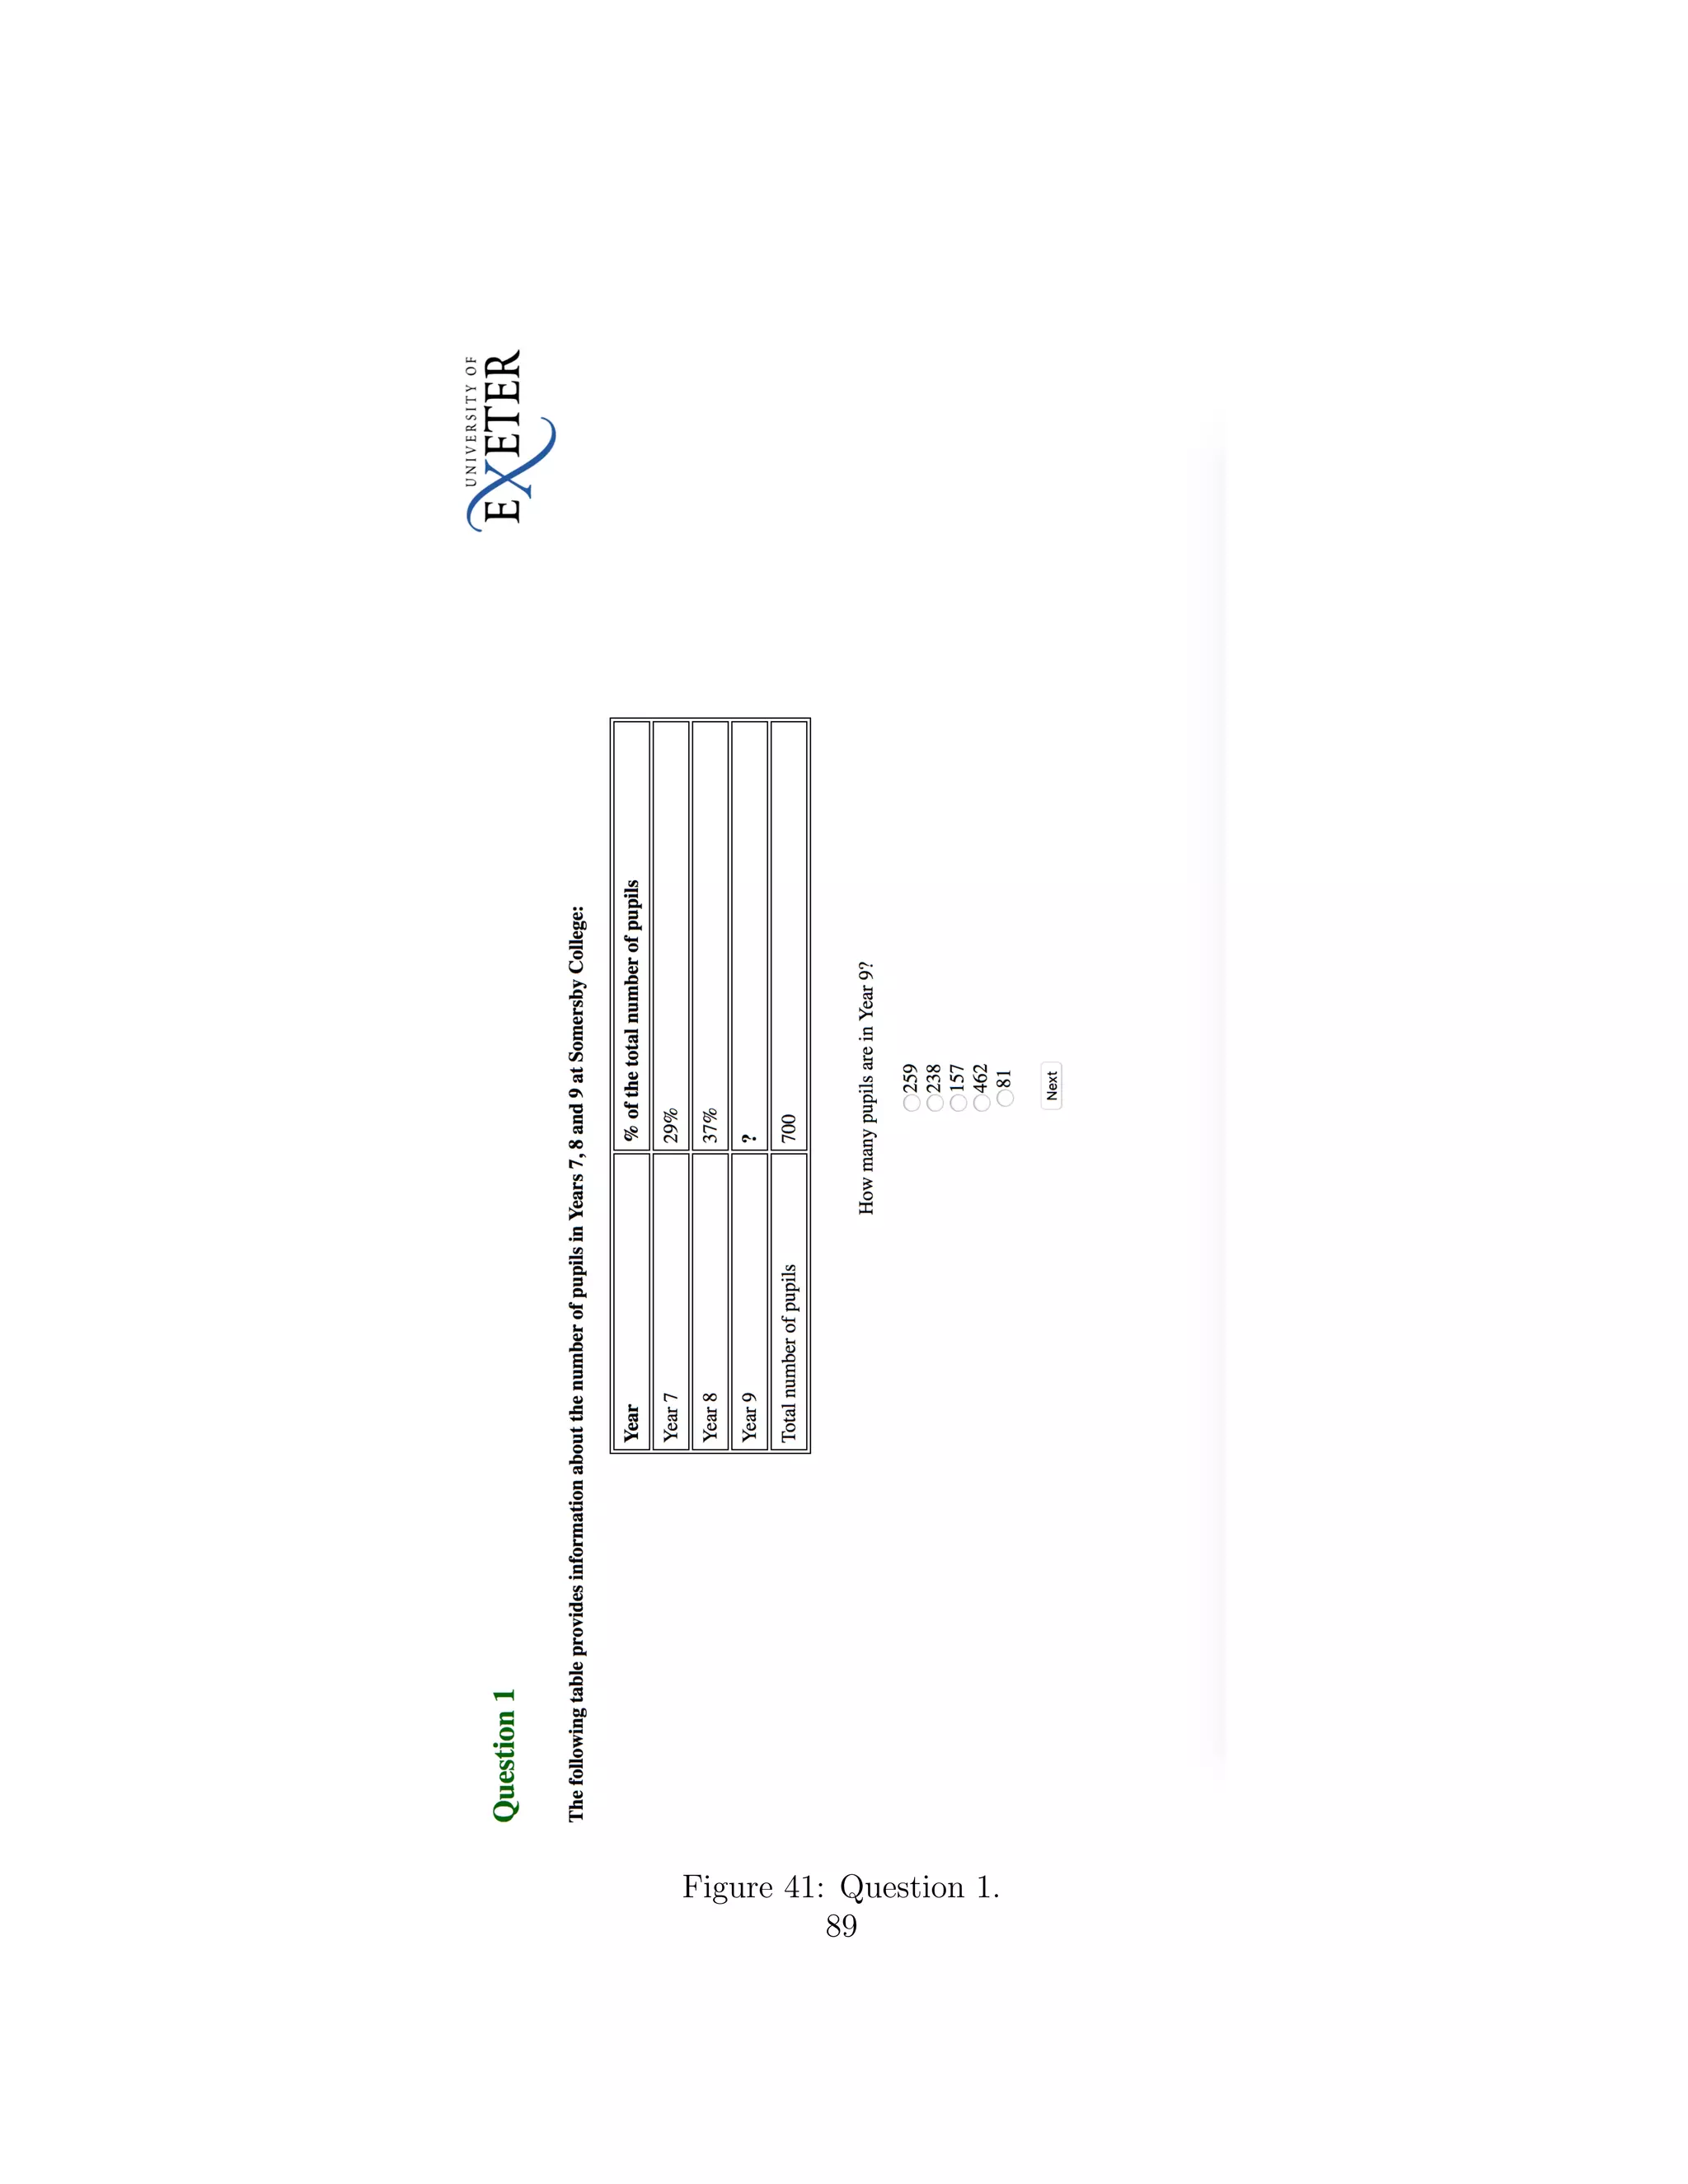
![Figure 6: Above is an example of HTML code being echoed in PHP which
we used to submit Question 1 in our Numerical Reasoning Assessment.
The subgroups had researched the current curriculums, decided on
the layout and the contents of the test, so the next step was for the program-
ming team to create it. Firstly, we familiarised ourselves with both PHP
and HTML and got used to writing functions. We used a variety of resources
from the library [13] and the internet [59], as well as using our own previously
acquired skills. We aimed to understand how to print text, show images and
generate tables using HTML so that we could write a well-presented and pro-
fessional looking test. We also had to learn how to interact with our online
database, move data on and off it and store our results. Following this, we
split up the workload between five people, each person being in charge of cer-
tain questions and aspects of the test. The limitations we came across were
28](https://image.slidesharecdn.com/c3a53d9b-627d-4299-ad78-e2ebdf324238-160113151505/75/final-31-2048.jpg)


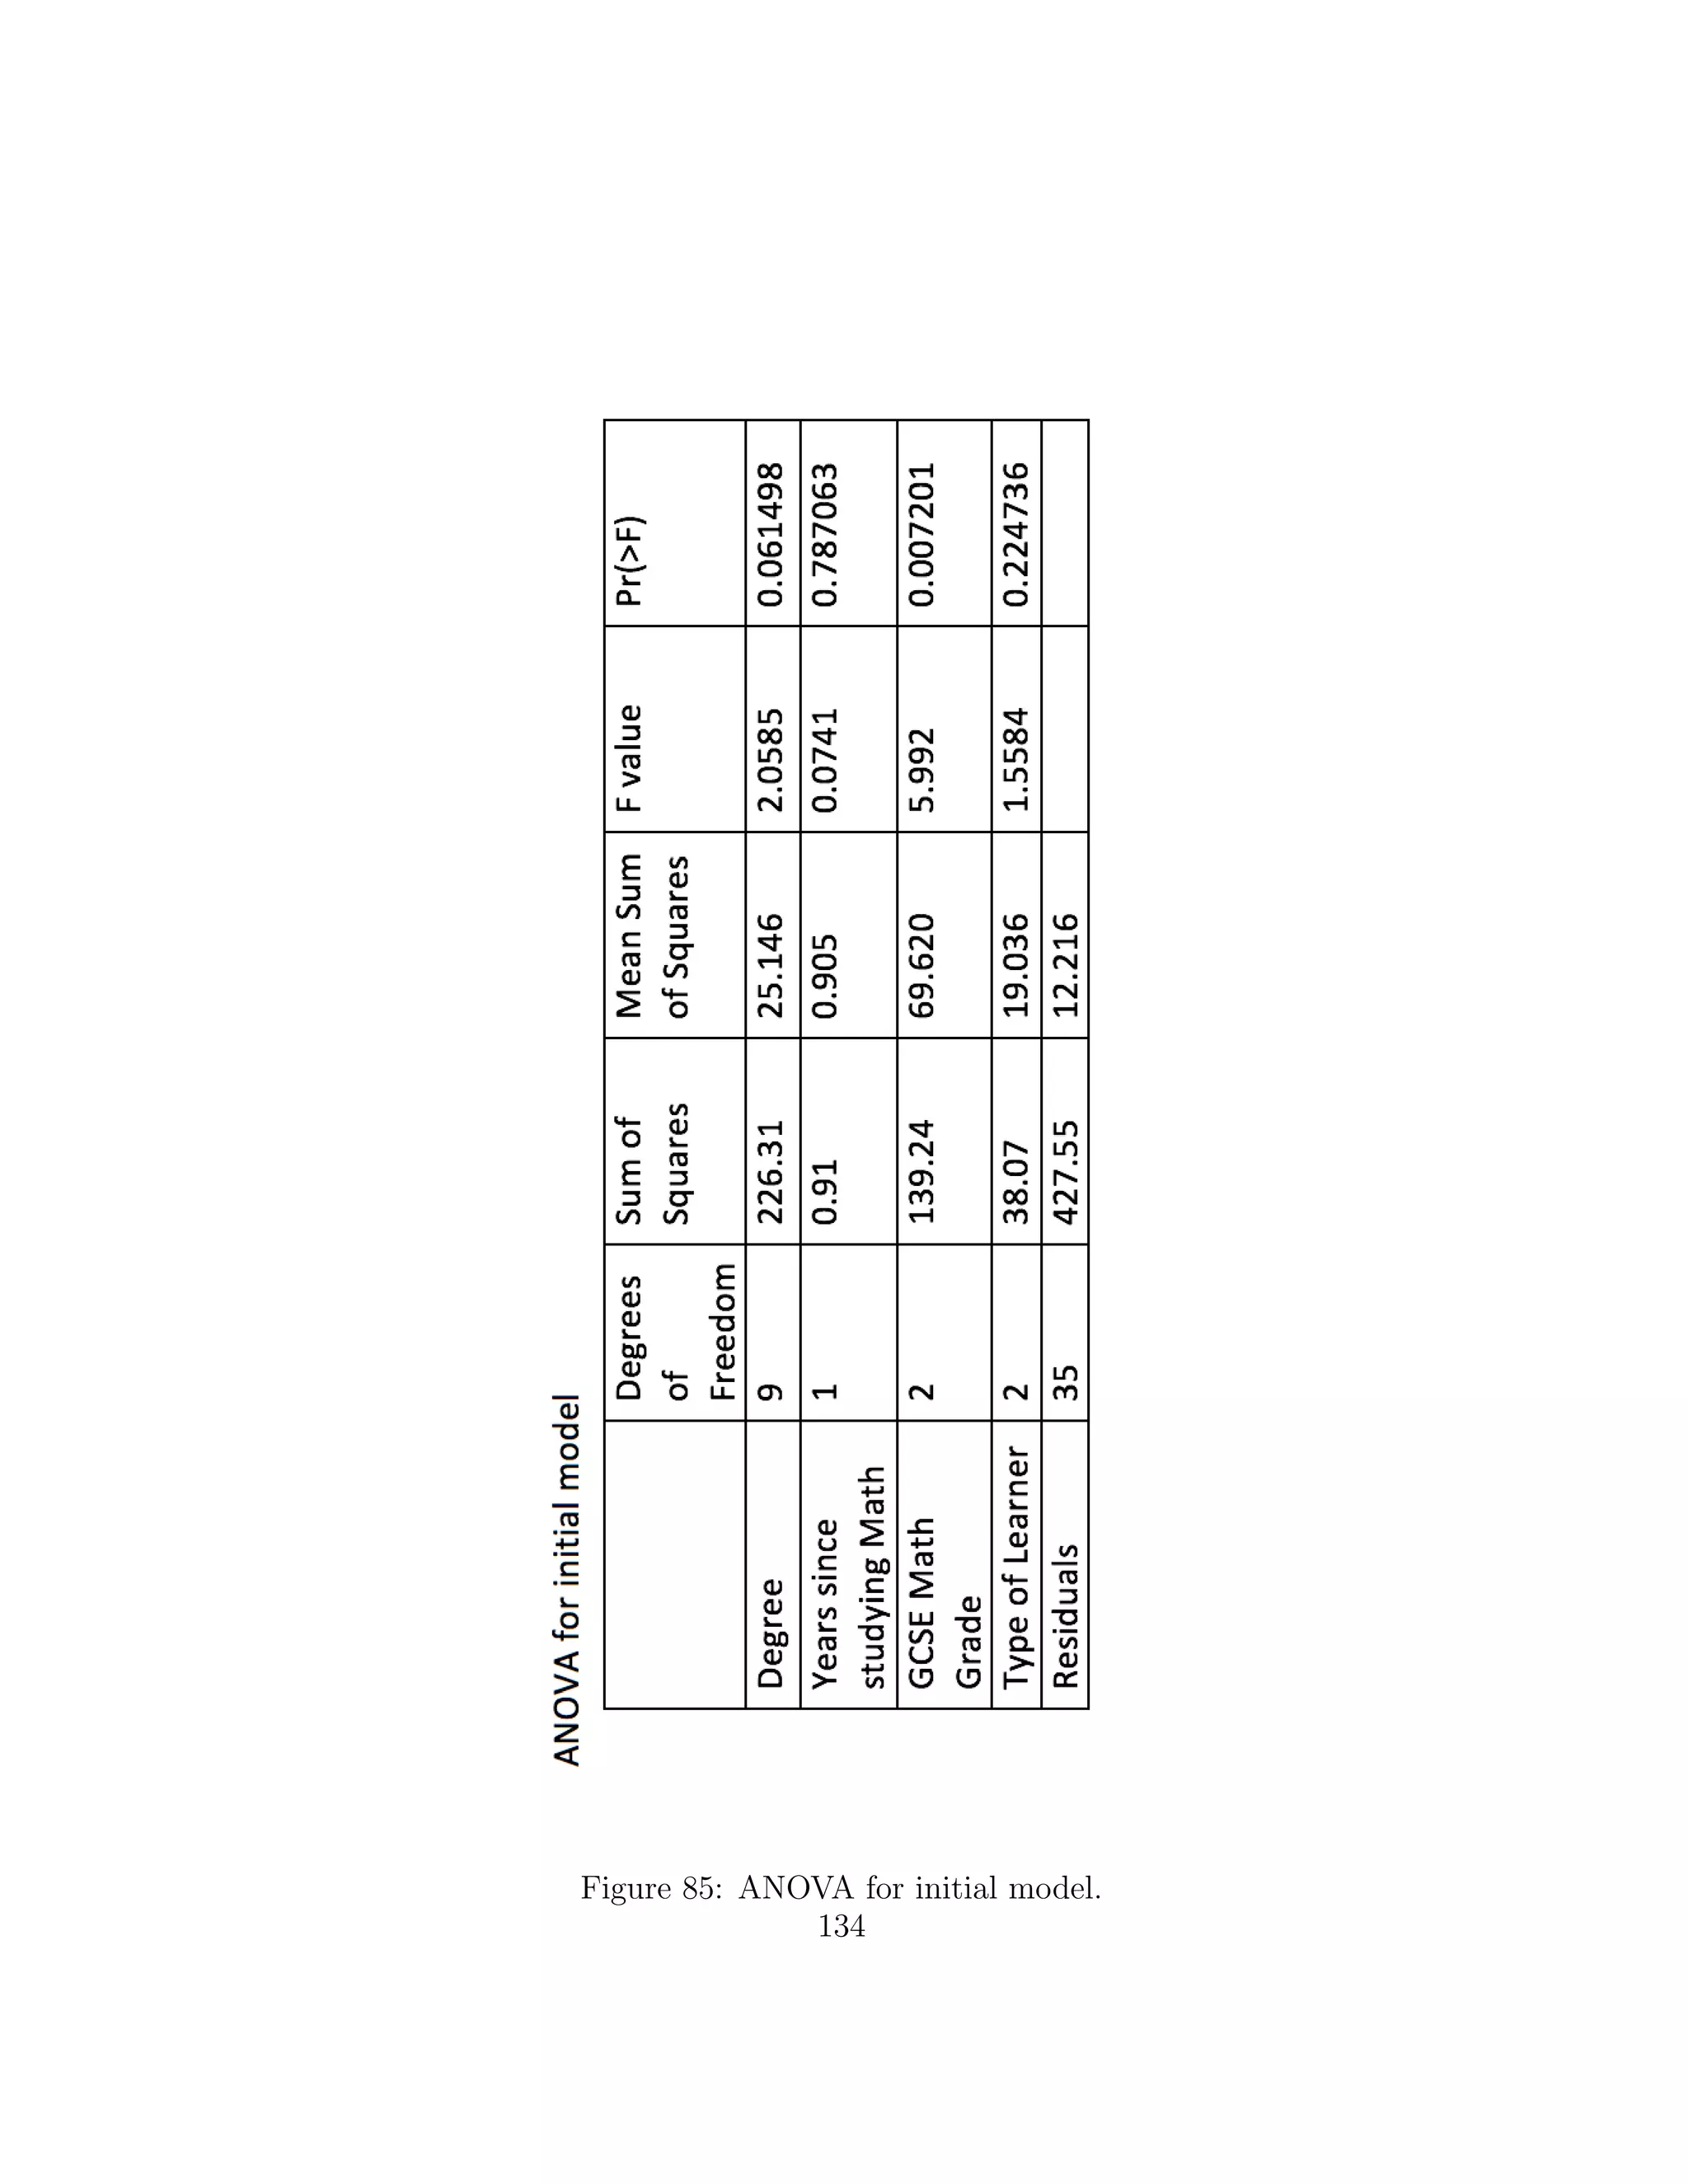
![’Practical Regression and Anova using R’, [21] stated that regression analysis
is beneficial because firstly, predictions of future observations can be made.
Secondly, the relationship and effect of multiple variables can be assessed and
finally, a general understanding of structure of all the data analysed can be
gathered. Therefore, for all the statistics we required in each research topic,
it was necessary to make a regression model for the test scores. The same
article also identified that the steps taken in regression analysis are:
1. Identifying the distribution of the data.
2. Identifying the initial regression model.
3. Carrying out an initial assessment of the goodness of fit of the model.
This would be through hypothesis tests on the variables and numerous
diagnostic plots.
4. Using methods to identify the best model fit.
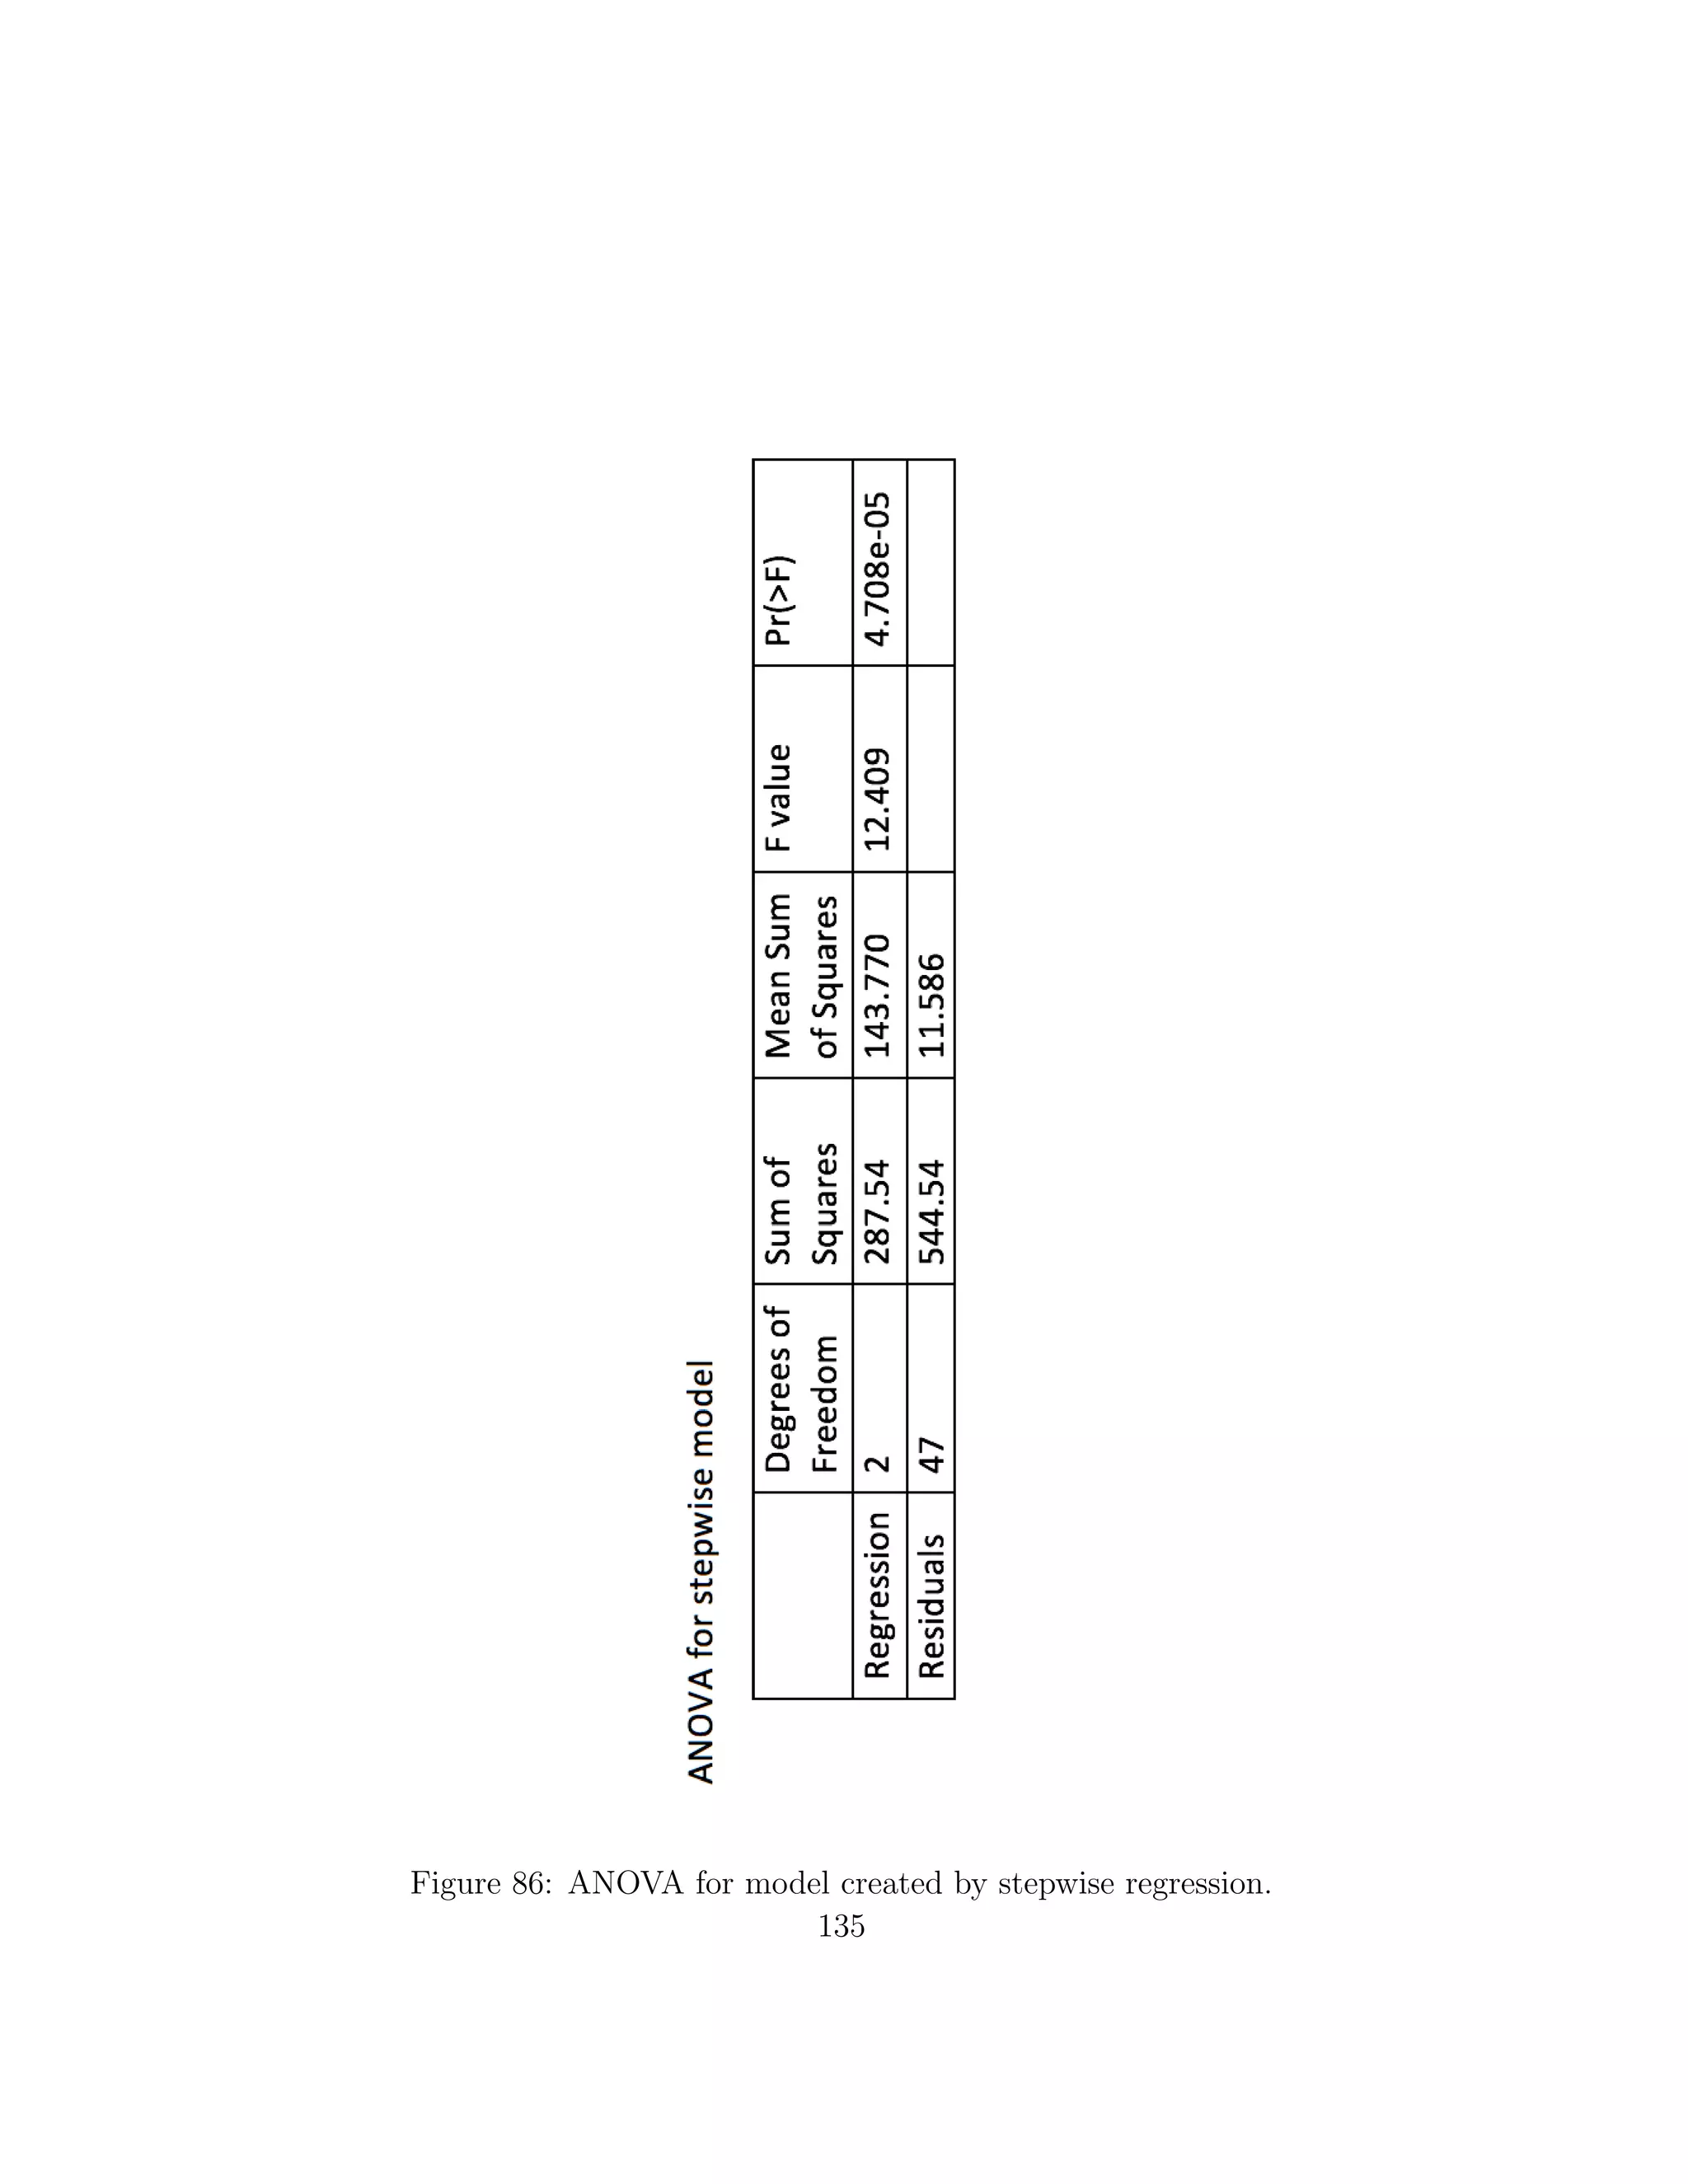
’Applied Regression Analysis’ [5] proposed using stepwise regres-
sion to achieve the ’best’ regression fit. This is because working with more
variables than necessary is avoided whilst still improving the regression fit.
Stepwise regression starts with a regression model with one variable. It sub-
sequently adds and removes various variables until the largest coefficient of
determinant is achieved. Hence, the model with the largest significance is
identified. After this best regression is found, we will be able to identify
which variables have the most significant effect on test scores. This is vital
for answering our four research topics. We will also be able to make pre-
dictions on future scores, such as what score would a ’visual learning girl,
studying law, with a grade B in GSCE mathematics and who hasn’t studied
mathematics since GCSE’ achieve?
It was realised that we would need to collect as many responses
from our test as possible. We posed a question to ourselves, ’How many peo-
ple need to take our test in order for the results to be significant?’. Having
spoken to Dr. Ben Youngman, a University of Exeter Statistic Lecturer, we
agreed we cannot create a ’minimum number’ and that the distribution of
the scores will depend on the scores of those who take the test. It was clear
that as little as four scores would be insufficient to create strong arguments
from our findings so, as a group we made a personal aim to get at least 60
entries.
34](https://image.slidesharecdn.com/c3a53d9b-627d-4299-ad78-e2ebdf324238-160113151505/75/final-37-2048.jpg)
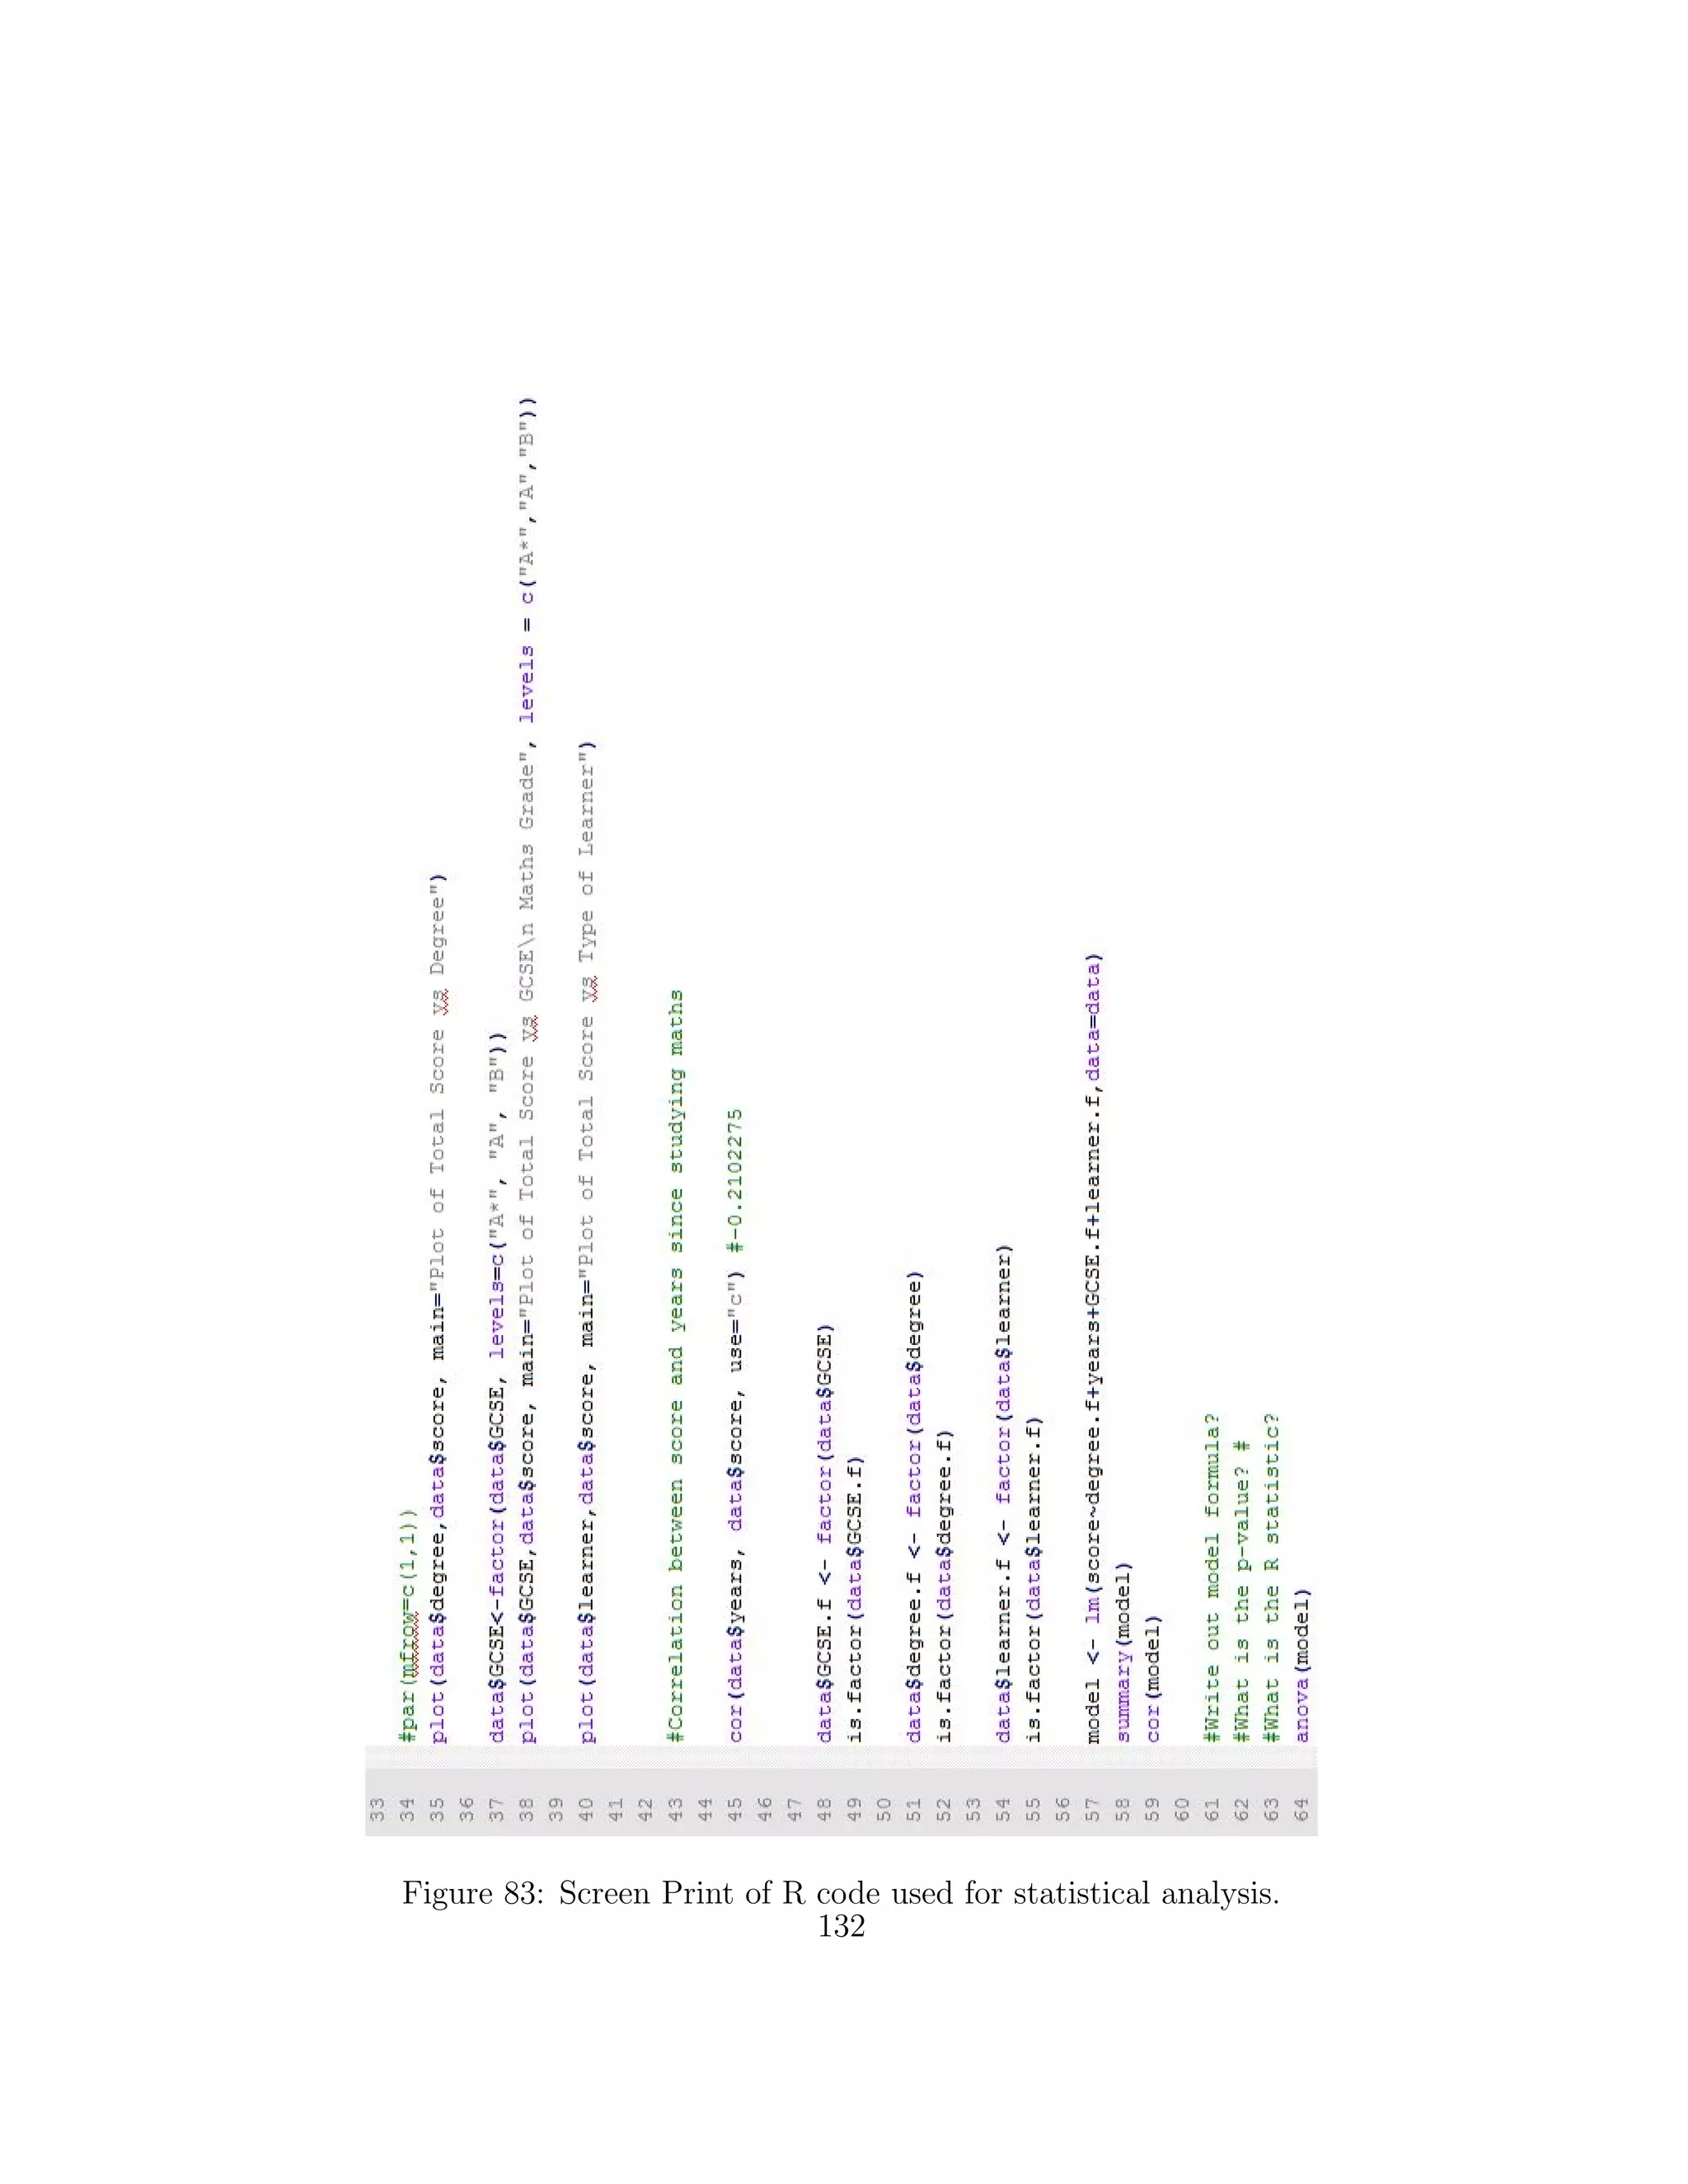
![We decided to use R-statistic to run all of our statistic analysis.
R-statistic is a leading tool for statistics and data analysis. It very efficiently
performs the type analysis that we required, such as producing correlation
matrices and modelling data. R-statistic also easily integrates with other
packages such as Microsoft Excel. Hence, making it easy for us to export
our MySQL database, containing all the test data into an Microsoft Excel
spreadsheet and perform our analysis using R-statistic from that. Output
in R-statistic is presented in a very clear way that is easy to interpret. Our
final reason for using R-statistic was that everyone in the statistics team had
used it before, making us very familiar with the built in functions and pro-
gramming language. Additional reading in ’Practical Regression and ANOVA
using R’ [21] was also used to refresh and improve our R-statistic knowledge.
Figure 8: Above is an example of R-statistic code.
2.4 Report Feedback
As a group, we recognised the importance of getting external feed-
back on our report. Our project’s main aim was not just to create a test, but
also to see how our findings related to literature and to observe their poten-
tial impact on future students. Receiving opinions on our results would give
us a more comprehensive view of our work and would enable us to perform a
35](https://image.slidesharecdn.com/c3a53d9b-627d-4299-ad78-e2ebdf324238-160113151505/75/final-38-2048.jpg)

![answer, in our case on average 20%, something that may influence people’s
preference for this style, based on perceived comparative ease. The fact that
this style was preferred was passed along to the subgroup tasked with writing
the online assessment questions, so that this could be taken into account.
It was also seen that people feel they benefit significantly from feedback.
This matches the opinion we found when conducting research, based on a
Plymouth study [36]. This suggests that not only do people want feedback,
but that a student’s results can improve significantly as a result of it. This
confirmed our decision to include feedback as a major component of our own
online test, to ensure that people would be able to learn from their mistakes
in previous questions.
In terms of Mathematics vs. Numeracy, there was a mixture of
results. There were originally mixed opinions from people when asked if they
believed their mathematical skills had deteriorated since they had stopped
studying mathematics, with the majority of people taking a neutral stance
(see Figure 11). The second largest response was ’slightly agree with the
statement’, implying that slightly more people may feel this to be true. This
may be slightly skewed, as people still currently studying mathematics are
likely to strongly disagree that their abilities have deteriorated, due to the
fact they are still using them. This surpassed the purpose of the question
- to investigate people who have stopped studying maths, and consequently
do not use it as often. This may have been the reason for the large spike
in people strongly disagreeing with the statement, which made it harder to
analyse how people perceived their maths skills, as many of the results shown
were not relevant.
Figure 11: Bar Chart of responses on deterioration of mathematical skills.
40](https://image.slidesharecdn.com/c3a53d9b-627d-4299-ad78-e2ebdf324238-160113151505/75/final-43-2048.jpg)
![Figure 12: Bar Chart of responses on deterioration of mathematical skills,
excluding mathematics students.
To combat this problem, we decided to exclude mathematicians
from our data and to repeat our statistics (see Figure 12). This ensured that
all respondents tested had all finished studying mathematics and so we could
give a full representation of deterioration of mathematics skills. From our new
calculations, we then produced a graph similar to our expectations, showing
that most people felt that their skills had somewhat deteriorated since they
had last used mathematics. This clearly agreed with our research, which
showed a strong difference between people who currently study mathematics
and those that had stopped. We could compare this with the same effect that
results from being unemployed showed us in our research. It was also similar
to the study on nurses [20], who performed worse on a similar test after
a gap year. However, our data consisted more of qualitative opinions than
quantitative results. This slight difference meant that we could not draw any
solid conclusions from comparing the two, but could, however, take note of
the strong similarities. One limitation of our data may have come from the
differing opinions on when participants classed themselves as having stopped
studying maths. Some students who study more scientific or quantitative
degrees may regard themselves as still using mathematics in their degree,
given that they use it regularly in their university work. While others will
claim not to study mathematics any more, since the subject itself is not
41](https://image.slidesharecdn.com/c3a53d9b-627d-4299-ad78-e2ebdf324238-160113151505/75/final-44-2048.jpg)


![Figure 23: Boxplot of Test Scores and Learner Type.
Generally, people performed better in questions involving a visual
aspect, such as a chart or graph. The average pass rate on these questions
was 81.7%, whereas for text questions it was slightly lower, at 68.6%. This
may be because the image or table breaks down the information making it
easier for all learners to digest the figures, whereas paragraphs of text and
figures cater more towards visual learners.
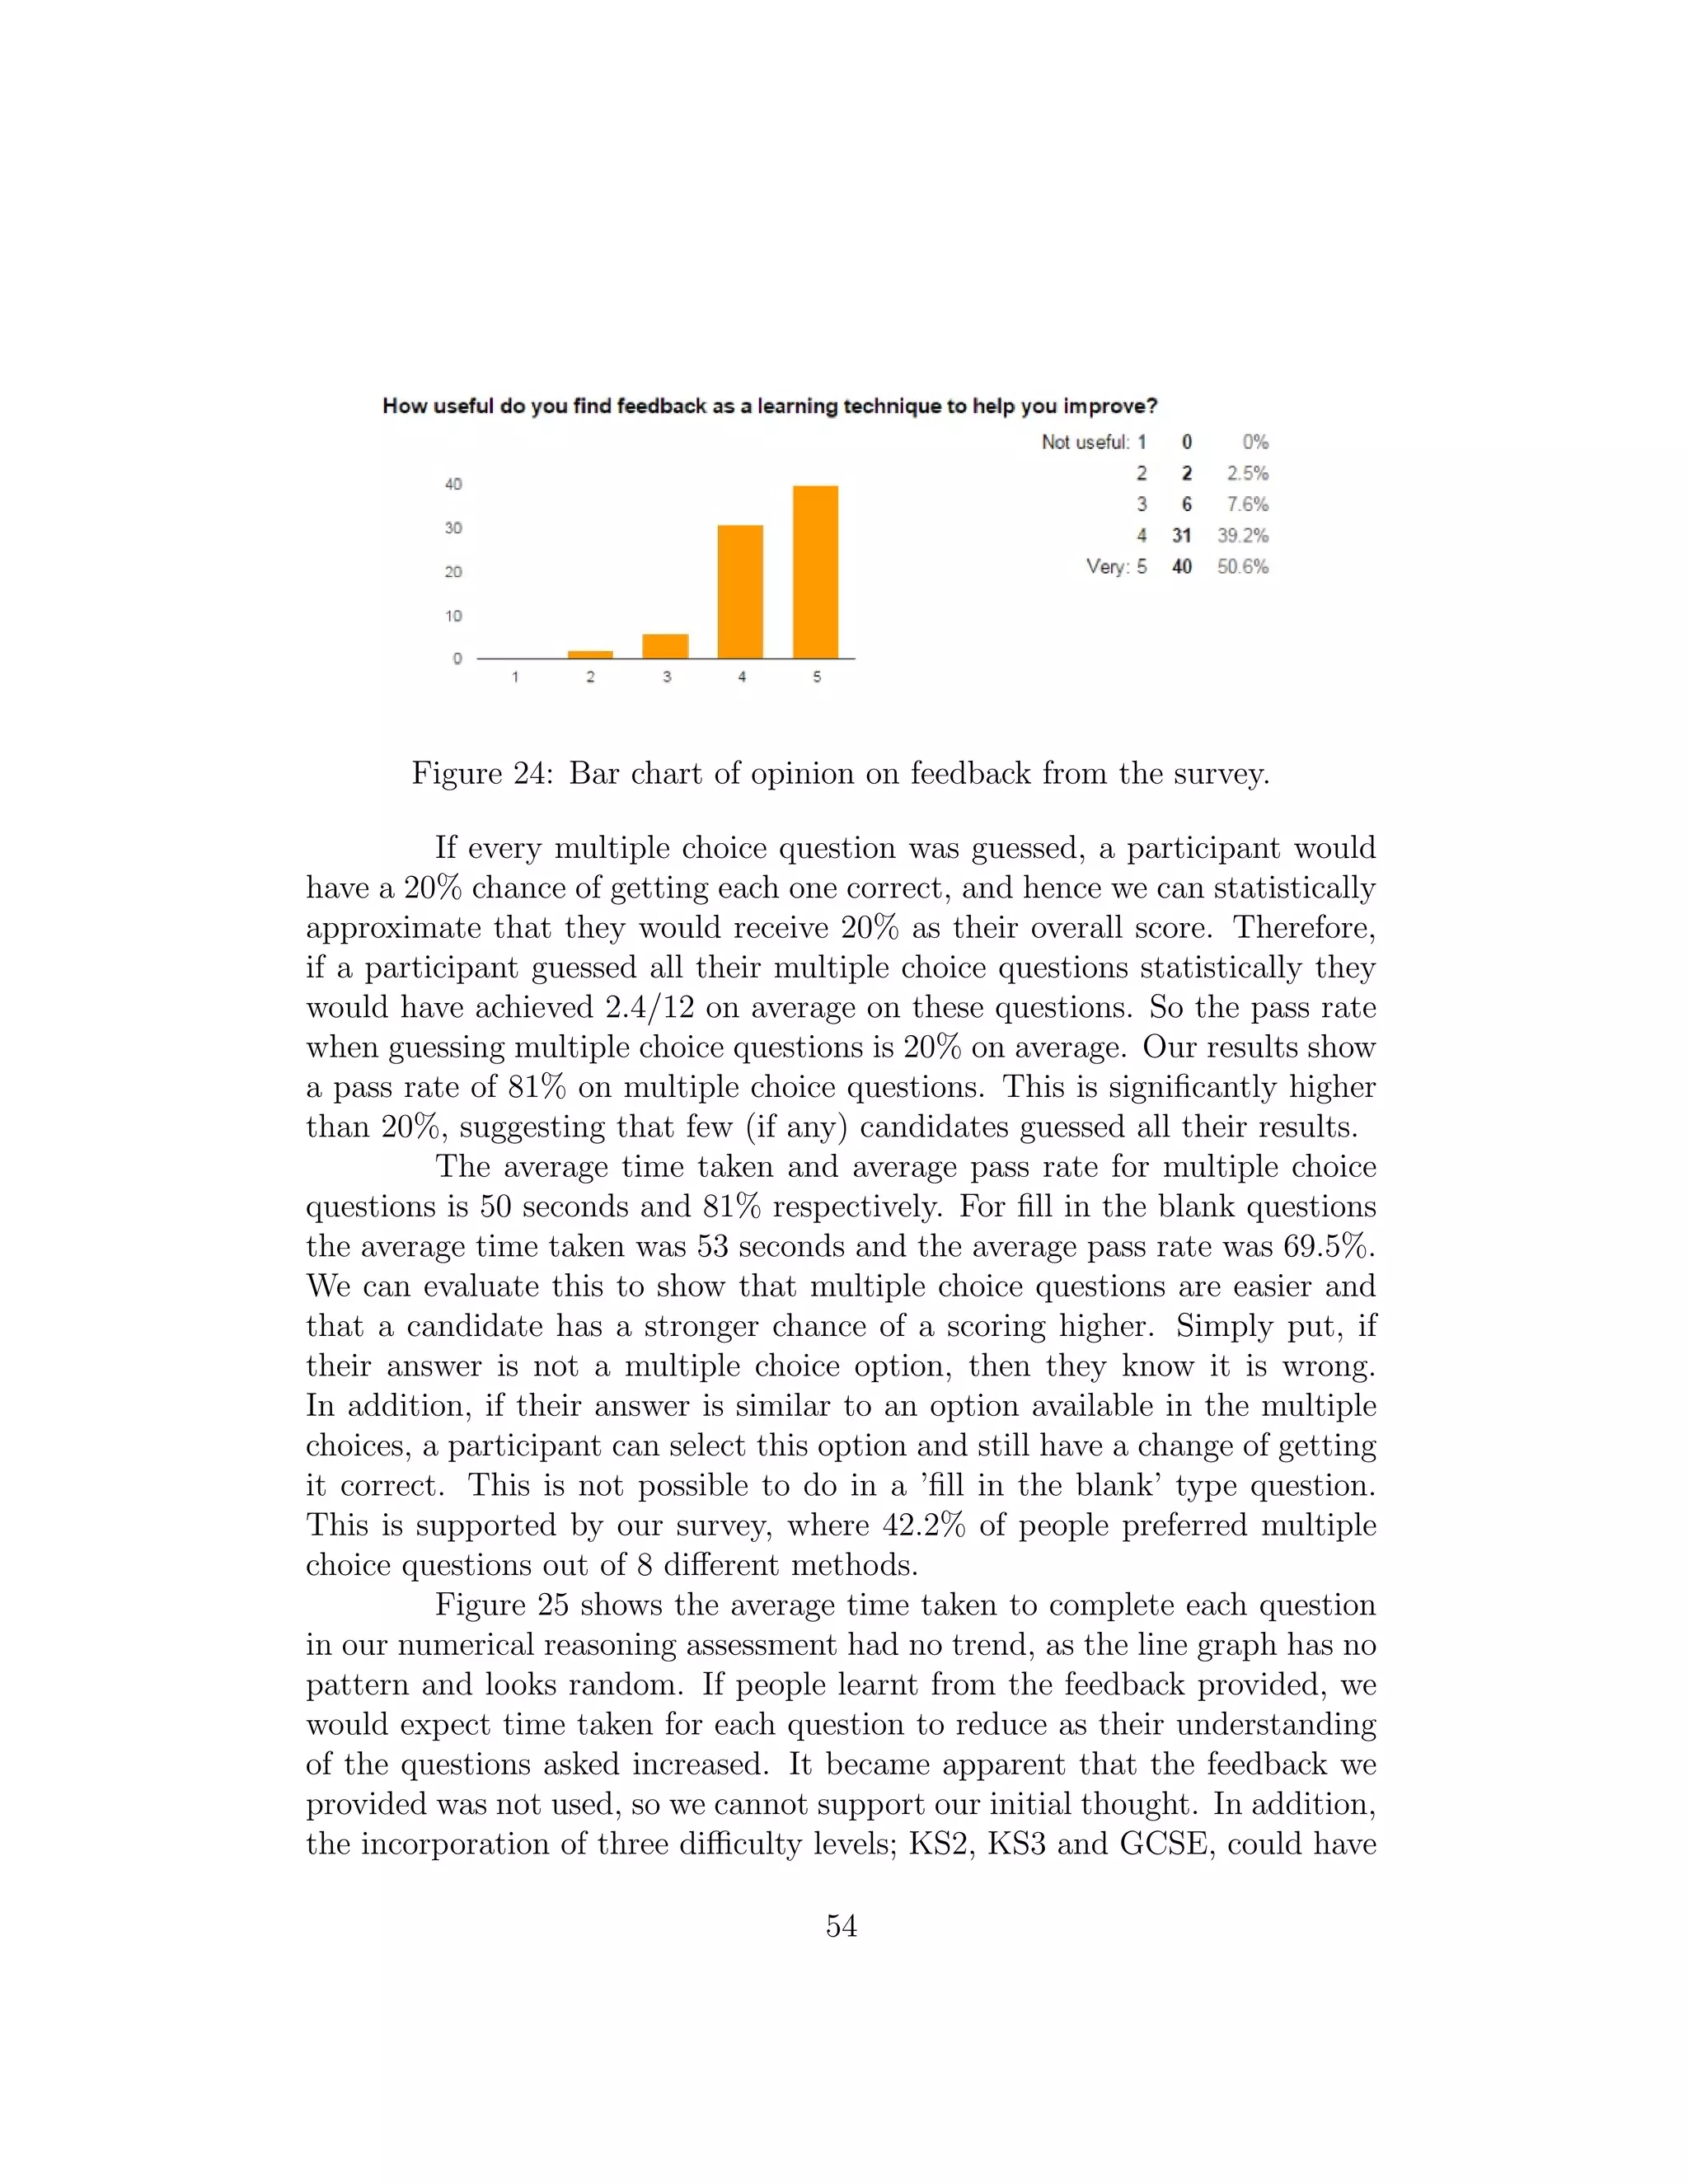
3.2.4 How do people learn through computer-based assessments?
From our results, we can determine that the majority of participants
neglected to read the feedback provided. The average time taken on the
first four questions, were 6, 5, 9 and 5 seconds respectively. This is not
enough time to read, understand and learn from the feedback. Research
proposed that reading feedback improved score result, for example Rob Lowry
in ’Computer aided assessments - an effective tool’ [36]. Our initial survey,
Figure 24, also shows that 89.8% of people thought feedback would be a
useful tool in an online test. However, as our numerical reasoning assessment
was put forward as a ’test’ rather than a casual learning resource, people’s
priority could have been to finish the test rather than learn from it.
53](https://image.slidesharecdn.com/c3a53d9b-627d-4299-ad78-e2ebdf324238-160113151505/75/final-56-2048.jpg)

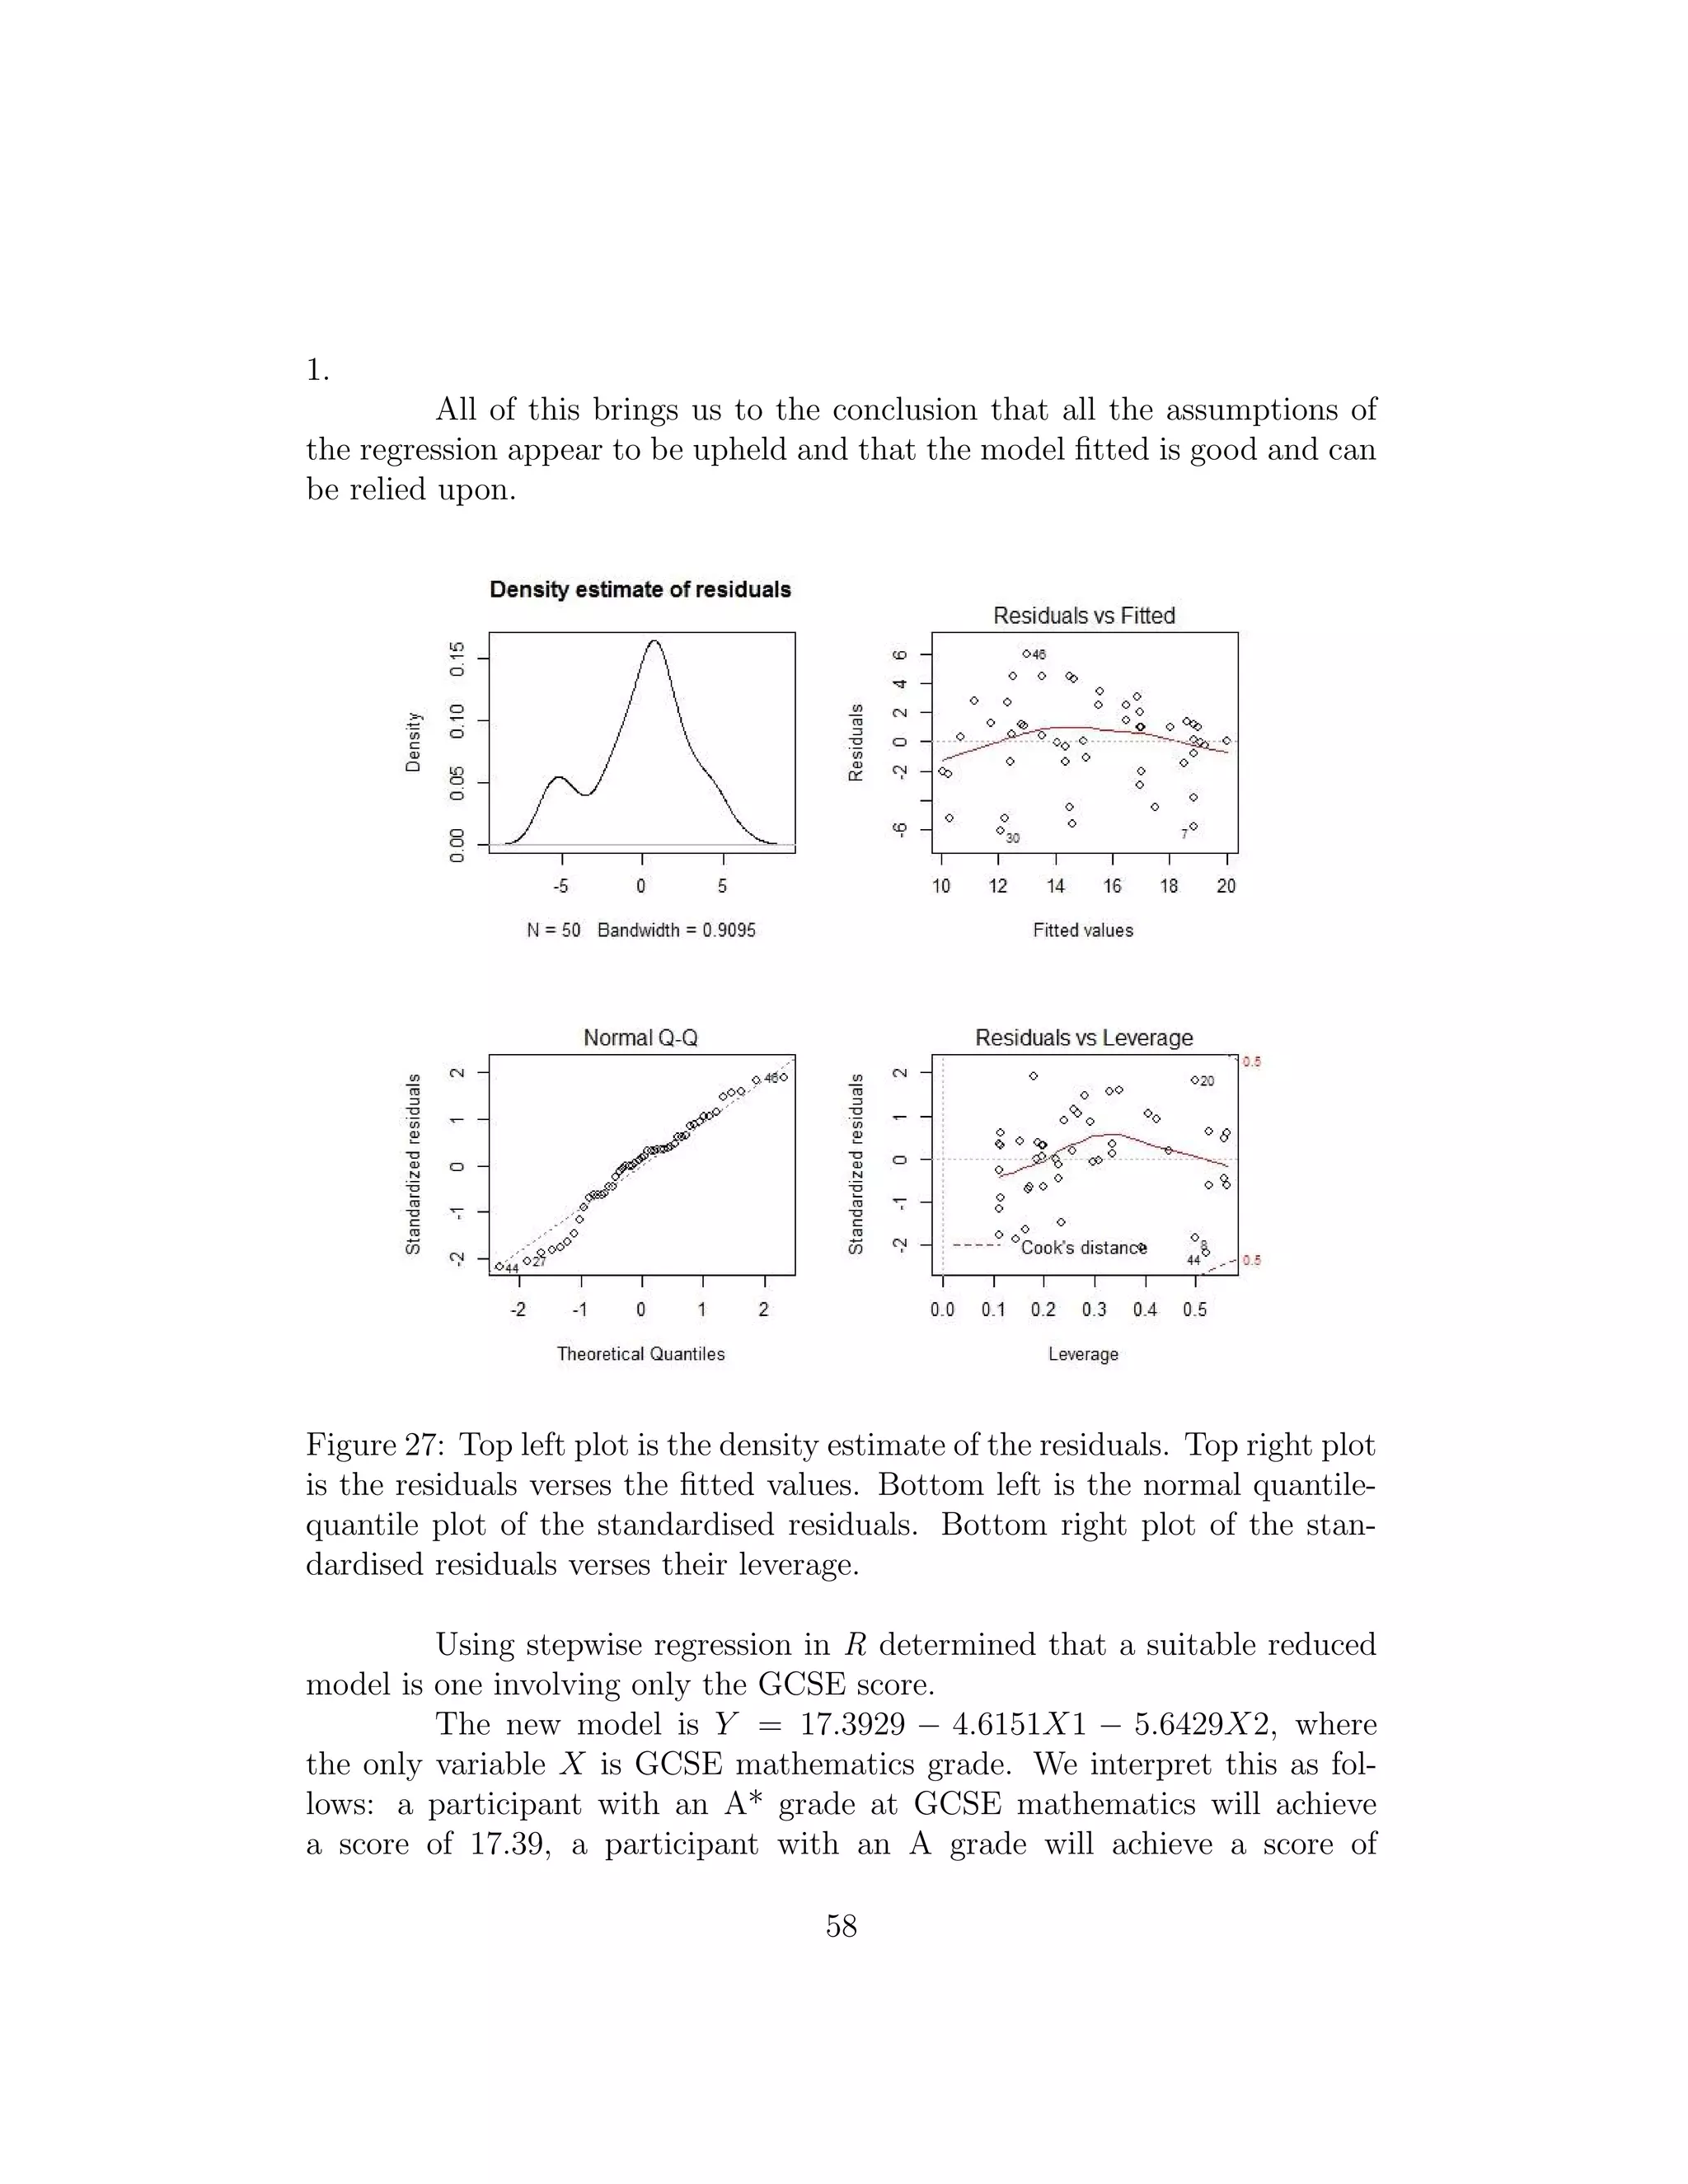


![5 Evaluation
5.1 SWOT Analysis
The following section concludes our project and provides an over-
all evaluation. In order to ensure that we form a comprehensive, reliable
and valid conclusion and hence evaluation, we shall utilise a well renowned
method of evaluation analysis known as SWOT. This acronym stands for
Strengths, Weaknesses, Opportunities and Threats [55]. Using this type of
evaluation structure we aim to provide a well rounded, detailed but most
importantly honest evaluation. In our experience the vast majority of eval-
uations only focus on the strengths and weaknesses. The concept behind
SWOT analysis allows us to reflect more on what threats exist within this
project and provide an important section on what future opportunities our
project could lead to.
5.1.1 Strengths
1. Teamwork
As a team we have worked extremely well together. There has
very rarely been any disagreement with the direction that our project
should take. When there was a disagreement each member was able to
express and explain their views and opinions openly, without restriction
or fear of doing so. Each team member has played a role in helping
to inform and guide other team members whenever they have been
unsure of what they needed to do. Overall our team has been extremely
committed in endeavouring to not only complete this project on time
but importantly to go above and beyond, completing it to a standard
that we are proud to call our own. As a team we held extremely good
communication and enjoyed spending time with each other.
2. External Professional Opinions
One thing that all team members were very in favour of was
seeking the opinions of professional mathematicians such as our Project
Supervisor, Dr Barrie Cooper and an academic from the Universities
Statistics Department, Dr Ben Youngman. We believed these external
professional opinions to be critically useful in guiding our project to
achieve our aims. The team was thankful that Dr Barrie Cooper took
the time to be present at weekly meetings with us, so we were able
66](https://image.slidesharecdn.com/c3a53d9b-627d-4299-ad78-e2ebdf324238-160113151505/75/final-69-2048.jpg)


![university was looking into. This meant we had to call off the meeting
which meant setting back the date on which our programme went live
thus, meaning we were left with less time to both get people to take
the test and then analyse the data.
3. Programme Failure
Those experienced with programming were aware that the
most time consuming parts of creating a working programme is in de-
bugging it. Debugging is a term used in Computer Science to mean the
identifying and removal of errors from computer hardware or software
[16] [17], in our case it was software. For the majority of the develop-
ment of our programme we encountered countless errors. These formed
big obstacles which were critical to the success of our project, as failure
to resolve them meant that we would have no method of collecting data.
An example of a big obstacle we faced in our programming was ensuring
the correct variables were POST through the PHP code which ensured
we were able to make our assessment randomised. Furthermore, just
before our assessment was able to become live we had to work to debug
errors in the code which were not printing correct characters such as
pound signs or apostrophes and we further had to resolve issues with
data being successfully inputted into the database. Dr Barrie Cooper
was great with helping to resolve these programme failures.
4. Student Participation
A big obstacle which we anticipated would arise and which
resultantly did, was getting enough students to participate in our re-
search by undertaking our assessment. We found it a great challenge to
get enough people to sit our test. The participants still did not always
follow the protocol which we provided, such as navigating back via
their browser, using a search engine to look for advice on how to solve
questions. As a group we see that one way in which we would have
been able to encourage more students to do the test more rigorously to
the protocol set out would be to offer some kind of incentive.
5.2 Improvements
The first improvement we could make on our project is to make
an adaptive test where the candidate progresses through levels of ’difficulty’
74](https://image.slidesharecdn.com/c3a53d9b-627d-4299-ad78-e2ebdf324238-160113151505/75/final-77-2048.jpg)

![6 Bibliography
References
[1] Numeracy in practice:teaching learning and using mathematics. Cur-
riculum and Leadership Journal, 7(Issue 28):5, 2009.
[2] May 2013.
[3] Rossbach H. Weinert S. Ebert S. Kuger S. Lehrl S. von Maurice J. An-
ders, Y. Home and preschool learning environments and their relations
to the development of early numeracy skills. Early Childhood Reseacrh
Quarterly, 2011.
[4] P. Bell. Why and how to use psychometric testing. recruiter., August
2015.
[5] Smith H. Braper, N. Applied Regression Analysis Third Edition. Wiley-
Interscience Publication.
[6] Parsons S. Bynner, J. Use It or Lose It. The Impact of Time out of
Work on Literacy and Numeracy Skills. Basic Skills Agency, 1998.
[7] Parsons S. Bynner, J. Qualifications, basic skills and accelerating social
exclusion. Journal of Education and Work, 2001.
[8] Products CEB, SHL Talent Measurement. Assessment types.
[9] SHL Talent Measurement CEB. Aptitude. identify the best talent faster
and at less cost.
[10] S. Cook. Kinesthetic learning styles: 24 activities for teaching.
[11] S. Coughlan. University applications hit record high.
[12] B. Dattner. How to use psychometric testing in hiring. harvard business
review, human resource management.
[13] Michelle E. Davis. Learning PHP and MySQL. O’Reilly, 2006.
[14] New York Univeristy Department of Mathematics. Why study mathe-
matics.
77](https://image.slidesharecdn.com/c3a53d9b-627d-4299-ad78-e2ebdf324238-160113151505/75/final-80-2048.jpg)
![[15] The University of Arizona Department of Mathematics. Why study
mathematics.
[16] Oxford Online Dictionary. Definition of computer hardware.
[17] Oxford Online Dictionary. Definition of ’software’.
[18] Oxford Online Dictionary. Definition of mathematics, November 2015.
[19] Oxford Online Dictionary. Definition of numeracy, November 2015.
[20] Boyle M. Williams B. Fairhall R. Eastwood, K. Numeracy skills of
nursing students. Nurse Education Today, 2010.
[21] J. Faraway. Practical regression and anova using r. July 2002.
[22] Department for Education. Mathematics gcse subject content and as-
sessment objectives. Online PDF File, 2013.
[23] Department for Education. Mathematics programmes of study, key stage
3 national curriculum in england. Online PDF File, September 2013.
[24] Department for Education. Mathematics programmes of study, key
stages 1 and 2 national curriculum in england. Online PDF File, Septem-
ber 2013.
[25] The Department for Education. The national curriculum in england,
key stages 3 and 4 framework document, December 2014.
[26] R. Garner. Ey. firm says it will not longer consider degrees or a level
results when assessing employees. the independent.
[27] The Guardian. Gcse results day 2015: pass rates rise as uk students find
out grades – as it happened.
[28] The Guardian. Maths teaching revolution needed, November 2013.
[29] D. Hallet. How is numeracy different from elementary mathematics?
University of Arizona, Harvard University, November 2014.
[30] K. Herbert. Bias in personnel selection and occupational assessments:
Theory and techniques for identifying and solving bias. International
Journal of Psychology and Counselling, 5(3):38–44, 2013.
78](https://image.slidesharecdn.com/c3a53d9b-627d-4299-ad78-e2ebdf324238-160113151505/75/final-81-2048.jpg)
![[31] Specialist in Graduate Careers Inside Careers. Assessment centres, nu-
merical reasoning tests.
[32] Zuckerberg M. Interview, Facebook Founder. Facebook has a billion
users in a single day, says mark zuckerberg. BBC, August 2015.
[33] A. Jenkins. Companies use of psychometric testing and the changing
demand for skills. A review of the literature. Centre for the Economics
of Education, London School of Economics and Political Science, 2001.
[34] S. Jordan. Assessment for learning: pushing the boundaries of com-
puter based assessment. Assessment in Higher Educaton Conference,
Cumbria, Centre for Open Learning of Mathematics, Computing, Sci-
ence and Technology (COLMSCT), The Open Univeristy, pages 1–12,
July 2008.
[35] K. Lepi. The 7 styles of learning, which works for you. November 2012.
[36] R. Lowry. Chemistry education research and practice, computer aided
self assessment, an effective tool. The Royal Society of Chemistry (RSC),
6:198 – 203, July 2005.
[37] Assessment Day Ltd. Numerical reasoning test.
[38] Metcalf H. Meadows, P. Does literacy and numeracy training for adults
increase employment and employability. evidence from the skills for life
programme in england. Industrial Relations Journal, 39(5):354 – 369,
September 2008.
[39] Watt H. Mogey, N. Implementing learning technology - the use of com-
puters in the assessment of student learning. Learning Technology Dis-
semination Initiative, pages 50 – 57, 1996.
[40] C. Neuhauser. Learning style and effectiveness of online and face-to-
face instruction. American Journal of Distance Education, 16(2):99–113,
2002.
[41] National Numeracy. Why is numeracy important.
[42] J. O’Donoghue. Numeracy and mathematics. Department of Mathe-
matics and Statistics, University of Limerick, Ireland, Irish Math. Soc,
(Bulletin) 48:47–55, 2002.
79](https://image.slidesharecdn.com/c3a53d9b-627d-4299-ad78-e2ebdf324238-160113151505/75/final-82-2048.jpg)
![[43] Better Policies for better lives. OECD. Education report.
[44] Test Partnership. Numerical reasoning (n-ara).
[45] Prospects.
[46] P. Robinson. Literacy, numeracy and economic performance. New Po-
litical Economy, 2007.
[47] C. Rowlands. How organisations get the best out of psychometric test-
ing. personnel today in association with network hr. 2015.
[48] Learning Rx. Types of learning styles. 2015.
[49] Telegraph Staff. Employers receive 39 applications for every graduate
job.
[50] Kinesthetic Learning Strategies. What are the best kinesthetic learning
strategies.
[51] R. Stretton. Talent and capability consultant at rsa insurance. Email
Conversation, October 2015.
[52] ESL Kids Stuff.
[53] BBC Recruitment Team. Recruitment. Email Response.
[54] tes. Algebra - levelled sats questions, July 2014.
[55] Mind Tools. Swot analysis.
[56] A. Tucker. What is important in school mathematics. Technical re-
port, Department of Applied Mathematics and Statistics, Stony Brook
University, 2015.
[57] Indiana University. Academic enrichment. 2015.
[58] R. Vosburgh. The evolution of hr. developing hr as an internal consulting
organization. Human Resource Planning, 30(3):11, 2007.
[59] w3schools.com. Php 5 tutorial.
[60] Head of the Mathematics Department St Teilo’s Cw High School Cardiff
Wylie, G. Information on potential mathematics gcse reforms. Verbal
Conversation, June 2015.
80](https://image.slidesharecdn.com/c3a53d9b-627d-4299-ad78-e2ebdf324238-160113151505/75/final-83-2048.jpg)