Download as PDF, PPTX

![Users
Sales
Web
Users
CustomerId
Firstname
Lastname
Age
Sales
CustomerId
Product
Amount
Time
Web
CustomerId
Page
Time
Users.Customer_Id
Users.Firstname
Users.Lastname
Users.Age
Outcome
Count(Sales.Product)
CountDistinct(Sales.Product)
Mean(Sales.Amount)
Sum(Sales.Amount) where Sales.Product = 'Mobile Data'
Count(Web.Page) where Day(Web.Time) in [6;7]
…
Feature surfacing](https://image.slidesharecdn.com/featuresurfacing-meetup-170308165838/85/Feature-surfacing-meetup-3-320.jpg)
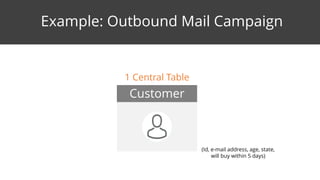
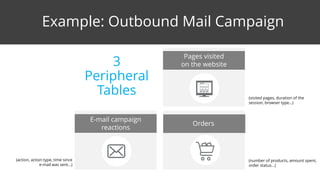
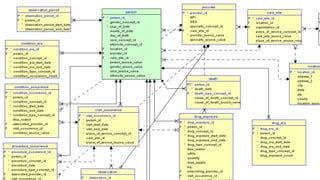
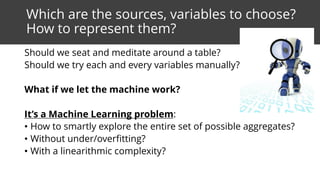
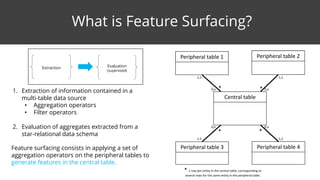
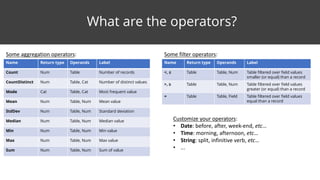
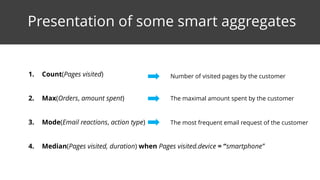
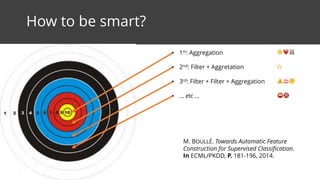
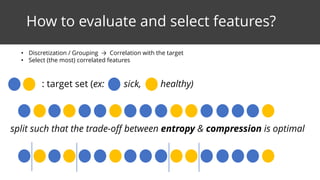
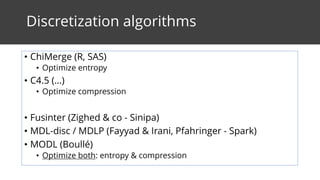
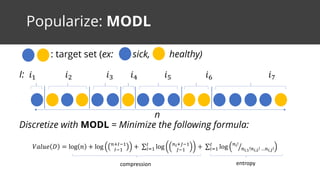
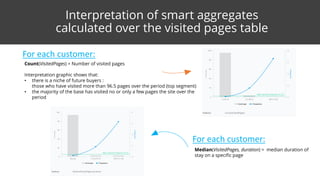

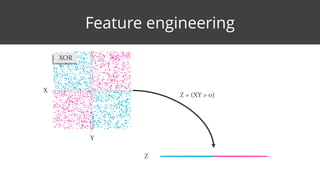
This document discusses feature surfacing, which is a technique for extracting and evaluating features from a central table and related peripheral tables in a relational database. It describes aggregating and filtering data from the peripheral tables to generate new features for the central table. Some examples of aggregation operators provided are count, count distinct, mode, mean, standard deviation, median, min, max and sum. The document also discusses how to evaluate and select the most correlated features to a target variable using discretization and correlation. It promotes using the MODL discretization algorithm to optimize both entropy and compression when grouping feature values. In the end, it analyzes some example smart aggregates calculated from a visited pages table to provide interpretations.