Recommended

Recommended
More Related Content
What's hot
What's hot (20)
Similar to Farm input Marketting System
Similar to Farm input Marketting System (20)
Recently uploaded
Recently uploaded (20)
Farm input Marketting System
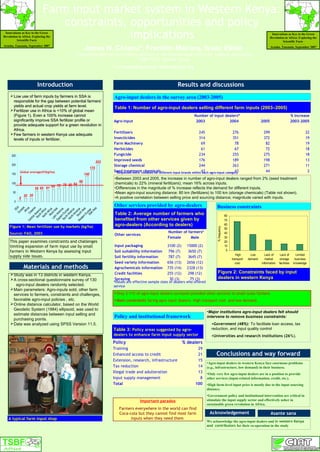
- 1. Farm input market system in Western Kenya: constraints, opportunities and policy implications Low use of farm inputs by farmers in SSA isLow use of farm inputs by farmers in SSA is responsible for the gap between potential farmers’responsible for the gap between potential farmers’ yields and actual crop yields at farm level.yields and actual crop yields at farm level. Fertilizer use in Africa is <10% of global meanFertilizer use in Africa is <10% of global mean (Figure 1). Even a 100% increase cannot(Figure 1). Even a 100% increase cannot significantly improve SSA fertilizer profile orsignificantly improve SSA fertilizer profile or provide adequate support for a green revolution inprovide adequate support for a green revolution in Africa.Africa. Few farmers in western Kenya use adequateFew farmers in western Kenya use adequate levels of inputs or fertilizer.levels of inputs or fertilizer. . Study was in 13 districts in western Kenya. A cross-sectional questionnaire survey of 130 agro-input dealers randomly selected. Main parameters: Agro-inputs sold, other farm services to farmers, constraints and challenges, favorable agro-input policies , etc. Online distance calculator, based on the World Geodetic System (1984) ellipsoid, was used to estimate distances between input selling and purchasing points. Data was analyzed using SPSS Version 11.5. Jonas N. Chianu*, Franklin Mairura, Isaac Ekise Tropical Soil Biology and Fertility institute of the International Centre for Tropical Agriculture (TSBF-CIAT), Nairobi, Kenya 175 140 98 8480787269616059 2020 202 8 0 50 100 150 200 250 SSAEurasia AfricaOceania CentralAmerica SouthAfrica NorthAfricaW estAsia LatinAmerica EasternEurope SouthAmerica NorthAm erica SouthAsia W esternEuropeEastAsia Figure 1: Mean fertilizer use by markets (kg/ha) Source: FAO, 2003 * Corresponding author: jchianu@cgiar.org Introduction Agro-input Number of input dealers* % Increase 2003 2004 2005 2003-2005 Fertilizers 245 276 299 22 Insecticides 314 351 372 19 Farm Machinery 69 78 82 19 Herbicides 61 67 72 18 Fungicide 234 255 275 18 Improved seeds 176 189 198 13 Storage chemical 244 263 271 11 Seed treatment chemicals 43 43 44 2 Materials and methods •Between 2003 and 2005, the increase in number of agro-input dealers ranged from 2% (seed treatment chemicals) to 22% (mineral fertilizers); mean 16% across inputs. •Differences in the magnitude of % increase reflects the demand for different inputs. •Mean agro-input sourcing distance: 80 km (fertilizers) to 100 km (storage chemicals) (Table not shown). •A positive correlation between selling price and sourcing distance; magnitude varied with inputs. Results and discussions Table 1: Number of agro-input dealers selling different farm inputs (2003–2005) Other services Number of farmers# Female Male Input packaging 3100 (2) 15000 (2) Soil suitability information 796 (7) 3650 (7) Soil fertility information 787 (7) 3645 (7) Seed variety information 656 (13) 2656 (12) Agrochemicals information 735 (14) 2328 (13) Credit facilities 255 (12) 298 (12) Spraying 30 (3) 75 (3) Table 2: Average number of farmers who benefited from other services given by agro-dealers (According to dealers) Global average(93kg/ha) Other services provided by agro-dealers Agro-input dealers in the survey area (2003–2005) Only 2-11% of agro-input dealers surveyed provided other services to small-scale farmers Main constraints facing agro-input dealers: High transport cost and low demand. 0 10 20 30 40 50 60 70 80 High transport cost Low demand Lack of market information Lack of storage facilities Limited business knowledge %frequency Business constraints Figure 2: Constraints faced by input dealers in western Kenya Important paradox Farmers everywhere in the world can find Coca-cola but they cannot find most farm inputs when they need them Policy and institutional framework Policy % dealers Training 29 Enhanced access to credit 21 Extension, research, infrastructure 15 Tax reduction 14 Illegal trade and adulteration 13 Input supply management 8 Total 100 Table 3: Policy areas suggested by agro- dealers to enhance farm input supply sector •Major institutions agro-input dealers felt should intervene to remove business constraints: •Government (48%): To facilitate loan access, tax reduction, and input quality control •Universities and research institutions (26%). •Agro-input dealers in western Kenya face enormous problems (e.g., infrastructure, low demand) in their business. •Only very few agro-input dealers are in a position to provide other services (input-related information, credit, etc.). •High farm-level input price is mostly due to the input sourcing distance. •Government policy and institutional intervention are critical in stimulate the input supply sector and effectively usher in sustainable green revolution in Africa. Conclusions and way forward Innovations as Key to the Green Revolution in Africa: Exploring the Scientific Facts Arusha, Tanzania, September 2007 Innovations as Key to the Green Revolution in Africa: Exploring the Scientific Facts Arusha, Tanzania, September 2007 This paper examines constraints and challenges limiting expansion of farm input use by small farmers in Western Kenya by assessing input supply side issues. # Values are effective sample sizes of dealers who offered service A typical farm input shop * Responses were collated for different input brands within each agro-input category We acknowledge the agro-input dealers and in western Kenya and contributors for their co-operation in the study Acknowledgement Asante sana